XRP Analysis==>>Correction Signs!!!XRP ( BINANCE:XRPUSDT ) is moving in the Resistance zone($2.63-$2.50) .
In this post, I want to show you some signs that XRP may still need to be corrected in a one-hour time frame :
1 -Regarding Classical Technical Analysis , XRP seems to have succeeded in forming the Rising Wedge Pattern .
2 -The formation of the Evening Star Candlestick Pattern in the Resistance zone can signify the reverse of XRP .
3 -The formation of the Bearish Gartley Harmonic Pattern can also be another sign of the decline of XRP .
4 -According to Elliott wave theory , XRP seems to be completing the main wave 4 .
I expect XRP to break the lower line of the Rising Wedge Pattern , which should drop to at least $2.38 . If the Support line is broken, the next target will be the Support zone($2.25-$2.17) .
⚠️Note: If XRP manages to break the Resistance zone($2.63-$2.50), we can expect an XRP pump.⚠️
XRP Analyze (XRPUSDT), 1-hour time frame⏰.
🔔Be sure to follow the updated ideas.🔔
Do not forget to put Stop loss for your positions (For every position you want to open).
Please follow your strategy and updates; this is just my Idea, and I will gladly see your ideas in this post.
Please do not forget the ✅' like '✅ button 🙏😊 & Share it with your friends; thanks, and Trade safe.
Gartley

XAGUSD bearish gattli patternOn the 4-hour chart, XAGUSD is currently forming a bearish gattli pattern. Currently, XAGUSD faces a downside risk, with a downside target of around 30.45. If the price breaks through the resistance around 31.45, an upward trend will begin.

XAUUSD has a high short-term downside riskOn the 4-hour chart, XAUUSD has rebounded from a short-term shock, and bears have the upper hand. Currently, the support below is around 2605. If it falls below, it is expected to continue to fall, and the downside target is 2554-2576. When the price tests the 2554-2576 area and stabilizes, you can pay attention to the bullish Gartley pattern. If the price breaks through the resistance near 2666, it will rise again.

BEN GARTLEY HARMONICHello everyone,
Ben may be close to a bottom in the form of a Bullish Gartley Harmonic Pattern. I've shared my entry levels, exit, and stop loss. Good luck!

XAU/USD harmonic Gartley formation with long potential
If the price comes around the blue box, I will start setting up a long trade. For this, I will look for confirmation with oversold and positive divergences in RSI on various time frames.

BTC Trade long1. Bulish divergence
2. Formation of new higher high and higher low
3. Gartley pattern

BILI Technical ConfluenceNASDAQ:BILI
Noting possible bullish spread across BILI:
Suggest stop loss at $17.5

GARTLEY Harmonic Pattern: How does it work?!GARTLEY Harmonic Pattern: How does it work?!
The "Gartley", as its name suggests, was introduced by Henry Mackinley Gartley.
All other harmonic patterns are modifications of the Gartley.
Its construction consists of 5 waves:
XA: This could be any violent movement on the chart and there are no specific requirements for this movement in order to be a Gartley start
AB: This is opposite to the XA movement and it should be about 61.8% of the XA movement.
BC: This price movement should be opposite to the AB movement and it should be 38.2% or 88.6% of the AB movement.
CD: The last price movement is opposite to BC and it should be 127.2% (extension) of CD if BC is 38.2% of BC. If BC is 88.6% of BC, then CD should be 161.8% (extension) of BC.
AD: The overall price movement between A and D should be 78.6% of XA
How to use it
Point D is where you come in, man! It's your entry signal.
-If it's an M pattern, you buy.
-If it's a W, you sell2.
Where to put your STOP LOSS??
-Below or "X" if you are a BUYER.
-Above "X" if you are a SELLER.
These percentages are based on the famous Fibonacci ratios, as mysterious as the pyramids of Egypt!
Ultimately, the Gartley pattern is like a good Cuban cigar: it requires patience and experience to be appreciated at its true value. But once you master it, it can become a powerful tool in your trading arsenal, as effective as a punch from Rocky Balboa!

Motherson Forming Bullish Gartley pattern for 240 targetMotherson Forming Bullish Gartley pattern for 240 target
Target1: 204/210
Target2: 225 / 240

Bullish Gartley + Bullish Pennant Break Combo - XLMHere I have COINBASE:XLMUSD on the Weekly Chart!
After the 2.5 Year long Bullish Gartley Harmonic Pattern had finished forming this July 2024, we see Price has been working into a tight Consolidation Pattern called the Pennant!
This Harmonic Pattern has been quite the Rollercoaster for longtime COINBASE:XLMUSD investors but with the Bullish Rally brought on this week, we see Price Breaking Above the Falling Resistance of this Pennant Pattern to the .10 area!
-If Price can find Support upon retesting the Break of Falling Resistance and stay above, we could see COINBASE:XLMUSD bask in .10 range and Push Higher!!
-RSI is now pushing Above 50 after the period of Consolidation stuck just underneath, indicating Bullish Interest is building
**If Price is unable to sustain these Higher Prices, this current Bullish Break could become False and we could see Price play back down into the Pennant Pattern!
With the Trump/Vance Campaign, we heard a lot of plans and potential being put towards the Cryptocurrency Market and with the win of the Presidency, we could start to see more Interest in this financial area.
Further updates will be on Daily Chart!

CNERGY, Harmonic Gartley, Bullish Move ExpectedHarmonic Gartley Pattern
Expected Reversal
Ascending Triangle Formation
Buy on closing above triangle
Buy above 4.30
Stoploss 3.65
Target 5.42

ABFRL Bullish to form Gar-Fly harmonic Pattern - Target 400ABFRL has formed Bullish Gar-Fly pattern.
Rally will take it to 400
Target1: 335 / 345
Target2: 375 / 400

LTCUSD BUY 65.0On the 4-hour chart, LTCUSD has a chance to form a bullish Gartley pattern in the short term. Currently, we can pay attention to the support near 65.0. If it falls back and stabilizes, we can pay attention to buying opportunities. The upward target is around 71.0. If the price falls below the support near 62.0, the pattern will be declared a failure.

EURUSD BUYEURUSD had a rejection from support level and we have witnessed a double bottom on support level and also seen HH and HL pattern on H4 to H1 time frame also another confluence for being bullish over this moment of time is we have seen a fibonachi retracement of bearish move completed with 68% of retracement we are bearish over the pair from higher TF prespective but bearish on lower ones

26/10/2024 - XAUUSD - Bearish Gartley PatternAs of October 26th, 2024, XAU/USD (Gold) has formed a bearish Gartley pattern, suggesting potential downward movement. Here’s the trade plan:
Trade Details:
Option 1:
Entry: Sell in the Potential Reversal Zone (PRZ)
Stop Loss: 2759.50
Option 2:
Entry: Sell Stop at 2740
Stop Loss: Above the defined last high (LH)
Reason for Trade:
The bearish Gartley pattern suggests a possible reversal to the downside, with opportunities to enter at the PRZ or after a breakout below the defined LH for added confirmation.
Disclaimer: This is not trading advice—it's for educational purposes only. Please conduct your own research before making any trading decisions.

Bearish Gartley on AMDWe have a formation of Bearish Gartley complete on NASDAQ:AMD
✅ Target 1 : $151.46
✅ Target 2 : $124.79
⛔ Stop Loss: $177.39
Have a good weekend! 🫡✌️

BEARISH PRESSURE ON BTC to 56,282.5 priceGood afternoon traders,
Trust you are doing great.
Please find below my outlook on this cryptocurrency, BTCUSD.
Type: Emerging Bullish Gartley
Completion Point (D):
Projected at approximately 56,282.5
Consider short positions as the pattern approaches this level.
Potential Reversal Zone (PRZ):
Range: 56,282.50 to 56,036.69
I expect to close short trades within this zone, anticipating a bullish reversal.
Target Levels:
These are my potential targets
T1: 57,487
T2: 56,935
T3: 56,282.50
These are key Fibonacci levels for exiting trades as the price moves downwards.
Entry Criteria:
Though the trade is currently in play, as such this is a late analysis. But here was my thought line before the trade was triggered. I allowed the 60,298 price to be broken just to allow the market to show bearish commitment before entering short trades.
Stop loss:
The trade will be invalidate if price goes above leg A. However, because the trade is aggressively towards the D leg, 61,355 would be a decent SL position.
Cheers and happy trading!

SMCI: Stock Split with Chart UpdateSMCI had a stock split, so I have to update this chart.
Light Fundamental:
It is a stock called SMCI (or Super Mico Computer). It is a US company that makes super powerful computers and servers. The world needs servers to help run things like big websites, apps, and AI. The stock price fell by half. So, it is selling at a discount for what it is really worth. So, it is a good chance to buy it.
Technicals:
Gartley-like pattern
diagonal support
engulfing bullish pattern with d3 volume and volume confirmation
a-b-c completion at a 78.2% fib pullback
Entry is above the weekly engulfing bullish candle at 475.44.
Target is, tentatively, 1500.
Note: preparing for either an election rally or a Christmas rally in stocks

BITCOIN - Trading Consolidative Markets Using Harmonic PatternsBitcoin, like many other markets has been stuck in a sideways shuffle as of late which can be very frustrating for most traders, since most traders tend to look for continuation type of trading opportunities.
For those looking for an alternative way to trade, here's a look at how I use advanced (harmonic) patterns, specifically the Gartley patter, to take advantage of times when the market is consolidating or moving sideways.
Hope you enjoyed the video and feel free to leave any questions or comments below.
Akil

Surana telecom and pow, little bearSurana telecom and power is looking little bear, there harmonics showing both d points which have possibilities to achieve, in this current mkt negativity I feels it will reach lower d and then bull,

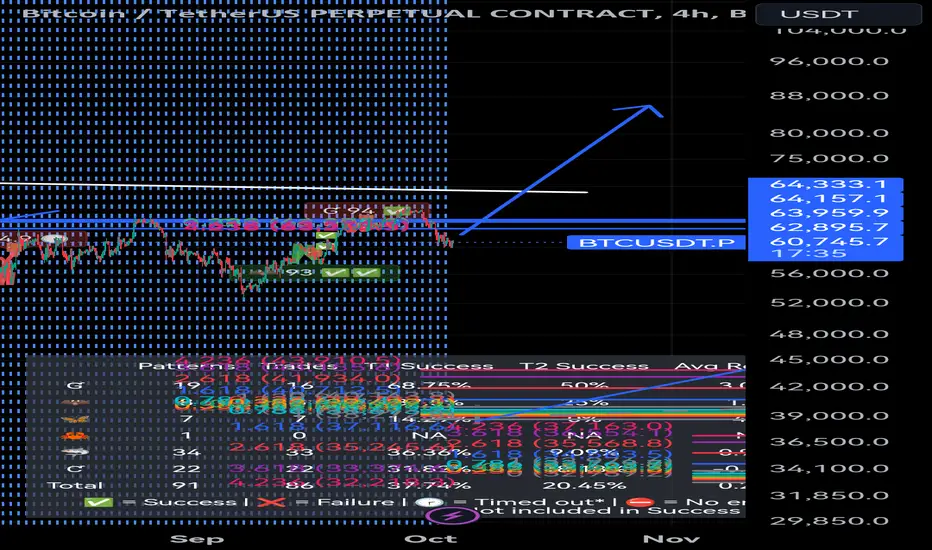
Buyers are looking for buy opportunityprilika za kupnju nakon pada btcusd para na 60 000 popularni gartley uzorak pokazuje da investitori ciljaju take profit nivo od 115 000.. Buyers are looking for buy opportunity as btc dropped to 60 k and targeting famous gartley pattern at 115'000 as take profit area!!!

Buyers are looking for buy opportunityprilika za kupnju nakon pada btcusd para na 60 000 popularni gartley uzorak pokazuje da investitori ciljaju take profit nivo od 115 000.. Buyers are looking for buy opportunity as btc dropped to 60 k and targeting famous gartley pattern at 115'000 as take profit area!!!
Bearish gartley to 46k !!!before we get the halving effects of btc it is fundamentaly correct to expect the retracement of the previous long moves on the daily and weekly scale.. It could be in the form of a flash crash or in the form.of a selloff.. The gartley level.is.46 k where the first larger suport lays!!!
