Bearish Gartley on AMDWe have a formation of Bearish Gartley complete on NASDAQ:AMD
✅ Target 1 : $151.46
✅ Target 2 : $124.79
⛔ Stop Loss: $177.39
Have a good weekend! 🫡✌️
Bearish Gartley

BEARISH PRESSURE ON BTC to 56,282.5 priceGood afternoon traders,
Trust you are doing great.
Please find below my outlook on this cryptocurrency, BTCUSD.
Type: Emerging Bullish Gartley
Completion Point (D):
Projected at approximately 56,282.5
Consider short positions as the pattern approaches this level.
Potential Reversal Zone (PRZ):
Range: 56,282.50 to 56,036.69
I expect to close short trades within this zone, anticipating a bullish reversal.
Target Levels:
These are my potential targets
T1: 57,487
T2: 56,935
T3: 56,282.50
These are key Fibonacci levels for exiting trades as the price moves downwards.
Entry Criteria:
Though the trade is currently in play, as such this is a late analysis. But here was my thought line before the trade was triggered. I allowed the 60,298 price to be broken just to allow the market to show bearish commitment before entering short trades.
Stop loss:
The trade will be invalidate if price goes above leg A. However, because the trade is aggressively towards the D leg, 61,355 would be a decent SL position.
Cheers and happy trading!

TSLA four-hour chart shows a potential Gartley harmonic.NASDAQ:TSLA is forming a potential bearish Gartley on the four-hour chart, which would result in bullish price action on the C to D leg, as long as point C on the chart holds. Point C on the chart also corresponds to the daily 200 SMA, and is right above the psychological $200 level, which adds confluence to the long entry at $202.50.

AUDUSD M15, Intraday TradeI just shorted AUDCAD, Bearish 5-0 Pattern on the 1-hourly chart, and now AUDUSD on this Bearish Gartley Pattern.
It seems like the Australian dollar may have a bearish movement for the next couple of hours.
If you have been following, you should know I don't usually trade on the M15 chart, but this one has an upsize trade component.
What is an upsize trade?
An upsize trade is a trading setup that allows me to stretch my final target to the next pattern completion. It's a Trade Management skill that I've used for years.
Before using it, You must be very familiar with the product and strategy.

GBPUSD Sideways Consolidation and Potential Breakout MovesGBPUSD is currently in a sideways consolidation on the 1-hourly chart, presenting a potential for an expansion move or breakout in the coming week. Should the market break out to the upside, there are two potential shorting opportunities to consider.
Analysis:
- Sideways Consolidation: GBPUSD is in a range-bound phase on the 1-hourly chart.
- Potential Breakout: Watch for an expansion move.
Shorting Opportunities:
Traditional Resistance Level:
- Level: 1.2662
Strategy: Look for Magic Candle Confirmation around this resistance level to enter a short position.
Bearish Gartley Pattern:
- Completion Level: 1.2677
- Strategy: Monitor for the Bearish Gartley pattern completion and confirm with bearish signals to enter a short position.
Strategy:
- Monitor Breakout: Pay close attention to the price action for a breakout, should the market breakout to the upside, there are 2 resistance level you have to take note.
Shorting Levels:
- 1.2662: Traditional resistance level.
- 1.2677: Bearish Gartley pattern completion.
- Confirmation: Ensure to look for confirmation signals (such as bearish candlestick patterns or other technical indicators) before entering a short position.
- Risk Management: Use appropriate stop-loss levels to manage risk, and not risking more than 1% of your equity.
- Stay alert and be ready to act on these potential setups. What’s your take on GBPUSD?
Do you see any other potential setups or insights? Share your thoughts and strategies below!

Technical Analysis of GBPAUD: Bearish Gartley PatternHello traders,
Happy new week to you all.
Allow me to quickly do a detailed analysis of a pattern I identified on the GBPAUD currency pair, called bearish Gartley. I believe in the concerted might of Elliott wave and Harmonic patterns.
The Bearish Gartley pattern is a harmonic pattern that signals a potential reversal in price from bullish to bearish. This pattern consists of four price movements and five points: X, A, B, C, and D. In my GBPAUD analysis today, I noticed the following points:
X = 1.94824
A = 1.89081
B = 1.92500
C = 1.90938
D = 1.93530
To confirm the Bearish Gartley pattern, we need to analyze the Fibonacci retracement levels of these points and verify if they fit the typical Gartley ratios.
Based on the analysis of the Fibonacci ratios, I found that:
The AB leg retraces 59.5% of the XA leg, close to the typical 61.8% retracement.
The BC leg retraces 45.7% of the AB leg, fitting within the typical range of 38.2% to 88.6%.
The CD leg extends 166.0% of the BC leg, slightly above the typical 161.8% but ACCEPTABLE.
The AD leg retraces 77.4% of the XA leg, which is very close to the typical 78.6% retracement.
The Fibonacci ratios calculated for the given points fit well within the typical Bearish Gartley pattern ratios, implying that the pattern is valid and a potential bearish reversal could take place. The sharp reaction of the market from the PRZ zone further confirms thE presence of sellers. We might see the market move slightly to the upside in order to complete the 78.6AD retracement of the XA leg. But I think it should be short-lived. I'm expecting the pair to drop close to the 1.91250 price region.
Cheers and happy trading!!

Comprehensive Analysis of the Gartley Harmonic PatternThe Gartley Harmonic Pattern, a cornerstone of harmonic trading, was first introduced by H.M. Gartley in his 1935 book "Profits in the Stock Market." This pattern leverages Fibonacci retracement levels and geometric price formations to identify potential market reversals, providing traders with a strategic edge.
__________________________The Bullish Gartley Pattern___________________
Structure:
X-A Leg: The initial upward movement.
A-B Leg: A retracement of approximately 61.8% of the X-A leg.
B-C Leg: An upward move retracing between 38.2% and 88.6% of the A-B leg.
C-D Leg: The final downward movement, retracing 78.6% of the X-A leg, marking the pattern completion at point D.
Entry Criteria:
Entry Point: Enter a long (buy) position at point D, where the price is expected to reverse upward. This is typically the 78.6% Fibonacci retracement level of the X-A leg.
Stop-Loss:
Placement: Set a stop-loss order slightly below point X to safeguard against unexpected price movements. This minimizes potential losses if the pattern fails.
Take Profit:
First Target: Place the initial take profit target at point B, the retracement level of the A-B leg.
Second Target: Set the second target at point C, the retracement of the B-C leg.
Extended Targets: For a portion of the position, consider holding to capture further gains if the price continues to rise.
_________________________The Bearish Gartley Pattern_____________________
Structure:
X-A Leg: The initial downward movement.
A-B Leg: A retracement of approximately 61.8% of the X-A leg.
B-C Leg: A downward move retracing between 38.2% and 88.6% of the A-B leg.
C-D Leg: The final upward movement, retracing 78.6% of the X-A leg, completing the pattern at point D.
Entry Criteria:
Entry Point: Enter a short (sell) position at point D, where the price is anticipated to reverse downward. This corresponds to the 78.6% Fibonacci retracement level of the X-A leg.
Stop-Loss:
Placement: Set a stop-loss order slightly above point X to limit potential losses if the pattern does not play out as expected.
Take Profit:
First Target: Place the initial take profit target at point B.
Second Target: Set the second target at point C.
Extended Targets: Consider holding a portion of the position for additional gains if the price continues to decline.
_________________________Key Considerations__________________________
Precision: Accurate measurement of Fibonacci levels is critical. Even slight deviations can invalidate the pattern.
Confirmation: Utilize additional technical indicators or price action signals to confirm the pattern before initiating a trade. This can include moving averages, trend lines, or oscillators.
Risk Management: Adhere to strict risk management practices. This includes setting appropriate stop-loss levels and managing position sizes to protect capital.
____________________________Conclusion______________________________
The Gartley Harmonic Pattern is a sophisticated and reliable tool for identifying potential market reversals. By mastering the intricacies of both the bullish and bearish Gartley patterns, traders can enhance their analytical capabilities and improve trading outcomes. Integrating these patterns with other technical analysis methods and maintaining rigorous risk management protocols is essential for consistent trading success.
Incorporating the Gartley pattern into your trading strategy involves practice and diligence. Ensure that you continuously refine your skills in identifying these patterns and executing trades accordingly, always mindful of market conditions and broader economic factors.

A Han Seng Index Trade Early Monday morning Hello everyone,
The markets are slightly ruffled lately and there is an opportunity to short HS50 on Monday.
Trend:
W1: Up
D1: Down
H4: Down
Moving Average:
Below the Daily MA
H4 pointing downwards
Pattern:
Gartley on M15
Strong resistance at 16450.
Target is 16000
Double top on H1 and lots of divergence
Stop loss of 40 pips and a target of 120.

SOXL: Logscale Bearish Gartley at Trendline ResistanceSOXL has reached the Logscale 0.886 of this potential Logscale Bearish Deep Gartley which aligns with the upper trendline of the channel it has been trading within. If it plays out, I think we could see SOXL come down to the lower trendline and perhaps even lower. This May be sparked by a selloff in NVDA and AVGO.

AVGO: Pre-Earnings Bearish Gartley at ResistanceThere is a Potential Bearish Gartley at Resistance on AVGO leading to the earnings report. I'm not sure if it will hold but I have gotten some calls on SOXS just in case so I want to archive this harmonic setup.

Science of Trading ApproachToday, I'm excited to share a detailed approach for trading GBPUSD. If you're considering a short position, here's a comprehensive strategy:
1. 1-Hourly Chart: Shark Patterns at 1.2676
- Wait for Shark Patterns to complete at 1.2676 on the 1-hourly chart.
- Look for a trading combo within the chart when the market retests the Trendline Break (red line).
- Ensure the market doesn't violate the trendline during this process.
2. 4-Hourly Chart: Bearish Gartley Pattern at 1.2725
- The ideal scenario is for the Bearish Gartley Pattern to complete at 1.2725 on the 4-hourly chart.
- Aim for completion before Monday, March 4, 2024, by 5 pm. Patterns completing after this time are considered disqualified.
This Science of Trading approach allows for a meticulous analysis and synchronization of different patterns across multiple timeframes. It provides a well-defined strategy for traders looking to short GBPUSD.
Feel free to share your thoughts and insights. Are you considering a similar approach or have different plans for GBPUSD?
For a visual representation, please refer to the chart link in the TradingView post.

GBPAUD: Pushing into the PCZ of a Bearish SharkGBPAUD is pushing above the range resistance and into the PCZ of a Bearish Shark with elevated volumes, at the same time there is a Bearish Gartley formed on the RSI and the RSI is setting up to breakdown while in the overextended zone. I think we will likely see the AUD take back dominance for a few months in many of its pairs, particularly in the GBPAUD and AUDUSD pairs.
It is possible that the GBPAUD pushes above 1.95 for a short amount of time, I will likely continue shorting into 1.955

Type2 Bearish Gartley Pattern on 15 Minutes ChartAn intriguing trade opportunity has been identified on the 15-minute chart involving a type2 Bearish Gartley Pattern. While it may not appear significant on the shorter timeframe, looking at the Daily Chart provides a different perspective. Utilizing the Combo Trade Management System and targeting the first level of support can yield attractive returns.
What are your thoughts on this trade?

Combo Trade OpportunityAn amazing Bearish Fib-3 Bat with RSI Divergence has surfaced on the CADJPY 1-hourly chart.
While some may see this as a great counter-trend trading opportunity, others might interpret it as a warning sign and choose not to engage.
But here's the twist - it's a Combo Trade.
On the Weekly Chart, there's a Bearish Shark Pattern Retest, accompanied by a Type2 Bearish Gartley Pattern.
What's your take on CADJPY?
Share your trade plan for CADJPY in the comments below!

Confluence of Bearish PatternsCADJPY is displaying a confluence of bearish patterns:
1. Weekly Bearish Shark Pattern:
- Retest in progress.
2. Daily Type2 Bearish Gartley Pattern:
- Completion aligns with the Bearish Shark on the weekly.
The trader plans to wait for a confirming candle on the daily chart near the level of 110.37.
Share your insights and trade plans for CADJPY!

XAUUSD : Prices continue to weakenHello dear friends!
Gold prices today continued to fall sharply with gold down 25 USD to 2,001SD/ounce but soon regained the level of 2010 USD at the time of writing.
Accordingly, gold prices continued to plummet to a more than 1-month low in mid-week trading session as strong economic data strengthened the USD and Treasury bond yields and reduced market expectations about the US interest rate cut in March.
Gold's close below $2,015/ounce signals that the sideways range has been broken and the precious metal is entering bearish territory, with it still expected to reach $2,000 again and possibly lower to $1,990.

Potential Short Opportunity on Bearish PatternsDespite GBPUSD demonstrating a Weaker Bull Trading setup, my analysis suggests a more bullish outlook compared to EURUSD.
However, I'm currently eyeing a shorting opportunity on a lower timeframe. The emergence of a Bearish Gartley Pattern retesting at 1.2752 or a completion of a Bearish Bat Pattern around 1.2803 appears promising for a potential short position.
What are your thoughts or trade plans for GBPUSD?
Share your insights below!

Awaiting Bullish Gartley Pattern after Bearish Shark SetupNZDUSD showcases a compelling combo trading setup - a Bearish Shark Pattern visible on the weekly and daily charts.
This combination suggests potential movement in the market.
My approach involves waiting patiently for the market to shape a Bullish Gartley Pattern on the 1-hourly chart. This setup offers a more favorable Profit Factor, enhancing the trade's potential.
What are your thoughts or trade plans regarding NZDUSD?
Share your insights below!

PepsiCo: 3 Line Strike at the PCZ of a Bearish GartleyPepsiCo has confirmed a 3 Line Strike on the Daily at the PCZ of a Bearish Gartley with Bearish PPO confirmation, which I think will result in PepsiCo making at least an 88.6% retrace.

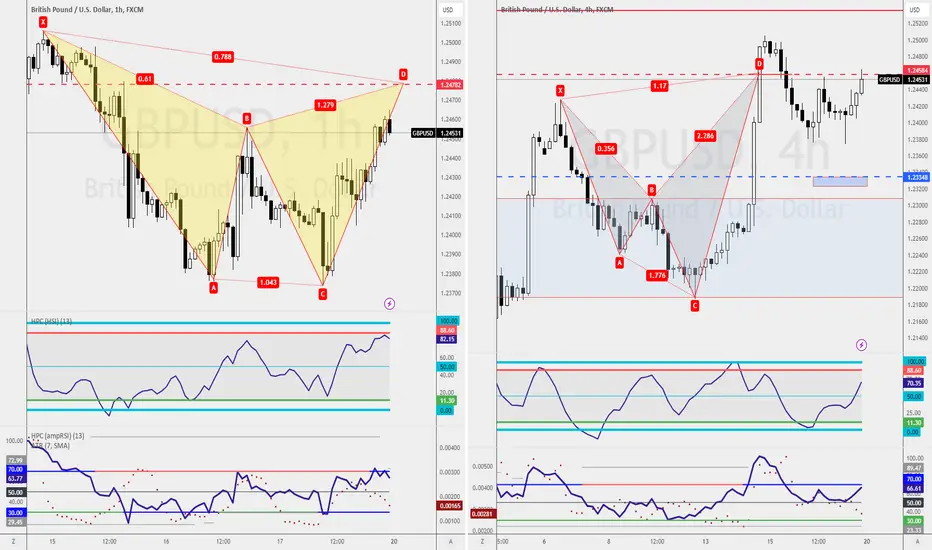
Navigating Contrasting Trading OpportunitiesGBPUSD is currently indicating a Weaker Bull Trend . Here are potential strategies for different trading approaches:
Trend Traders :
Waiting for a Bullish 5-0 Pattern on the 4-hourly chart at 1.2334 might align with your strategy as it complements the ongoing bullish trend.
Counter-Trend Traders :
For those seeking a counter-trend opportunity, a shorting opportunity off the Bearish Shark Pattern retest at 1.2453 or the completion of a Bearish Gartley Pattern on the 1-hourly chart at 1.2478 could be of interest.
Each approach carries its risks and rewards. Ensure to align these strategies with your risk tolerance and trading plan. Best of luck with your trading decisions!
A Lucrative Trading Opportunity with Cautious ConfirmationA retest of the Bearish Gartley Pattern, especially on a Friday, presents an intriguing opportunity.
Waiting for candlestick confirmation before initiating a short on the Gartley pattern aligns with a counter-trend trade strategy.
This cautious approach can often mitigate risks associated with abrupt market movements.
Good luck with your trade and stay vigilant with risk management!

Seize Trading Opportunities This Week!For those seeking a counter-trend trading opportunity, CADJPY may present an intriguing prospect. On the weekly chart, a Bearish Shark Pattern checkback is in play. For those desiring a more precise entry, waiting for the Gartley Pattern confirmation on the daily chart could provide a strategic shorting opportunity.
I'm eager to know your trade plans for CADJPY. How do you intend to navigate this setup? Share your insights below!

CHFJPY: Possible confluence for shortSome possible confluence suggest CHFJPY could possibly short around the 168 area. A potential Gartley pattern on the daily/4 hour chart. Equal measured move/ABCD daily/ 4 hr. Even handle number at 168 even. Testing previous highs. Overbought RSI daily, so possible divergence. Could be a nice area to look at for a shorting opportunity.
