BITCOIN - From the DISTRIBUTION phase to the CONSOLIDATION phaseBINANCE:BTCUSDT.P tested 60K during the current cycle and formed a fairly significant pullback to 70K. However, it is too early to talk about a bullish trend; this is just a reaction to liquidation. The cycle continues...
At the moment, the decline is 52%, which is historically within acceptable limits and is a relatively average indicator.
Fundamentally, there is no support for the crypto market, and Friday's pullback was supported by the recovery of the US stock market.
Global and local trends are bearish, and local spikes in volume and bullish impulses are possible in the hunt for liquidity, which should be viewed conservatively.
The price has entered the key trading channel of 53K - 73K and is likely to stop within the current cycle and form another trading range, which may subsequently reinforce the reversal momentum. Key liquidity zones have not yet been tested: 59650 - 53330.
Resistance levels: 71,900, 73,800, 82,200
Support levels: 65,000, 59,650, 53,330
How can we tell that the market is ready to reverse? Technically, the reversal phase does not come immediately after distribution, the cycle of which is still ongoing. The market must enter a consolidation phase with the gradual formation of sequentially rising lows/highs. The breakdown of local structures + the market holding above key resistance levels will hint at a positive market sentiment.
Thus, we are waiting for the formation of an intermediate bottom and a change in the market phase from distributive to consolidation...
Best regards, R. Linda!
Trend Lines

GBPJPY Will Fall From Resistance LevelHello Traders
In This Chart GBPJPY HOURLY Forex Forecast By FOREX PLANET
today GBPJPY analysis 👆
🟢This Chart includes_ (GBPJPY market update)
🟢What is The Next Opportunity on GBPJPY Market
🟢how to Enter to the Valid Entry With Assurance Profit
This CHART is For Trader's that Want to Improve Their Technical Analysis Skills and Their Trading By Understanding How To Analyze The Market Using Multiple Timeframes and Understanding The Bigger Picture on the Charts

GBPCHF Will Rise After a Bullish Engulfing PatternHello Traders
In This Chart GBPCHF HOURLY Forex Forecast By FOREX PLANET
today GBPCHF analysis 👆
🟢This Chart includes_ (GBPCHF market update)
🟢What is The Next Opportunity on GBPCHF Market
🟢how to Enter to the Valid Entry With Assurance Profit
This CHART is For Trader's that Want to Improve Their Technical Analysis Skills and Their Trading By Understanding How To Analyze The Market Using Multiple Timeframes and Understanding The Bigger Picture on the Charts

GBPNZD Will Fly From SupportHello Traders
In This Chart GBPNZD 4 HOURLY Forex Forecast By FOREX PLANET
today GBPNZD analysis 👆
🟢This Chart includes GBPNZD market update)
🟢What is The Next Opportunity on EURNZD Market
🟢how to Enter to the Valid Entry With Assurance Profit
This CHART is For Trader's that Want to Improve Their Technical Analysis Skills and Their Trading By Understanding How To Analyze The Market Using Multiple Timeframes and Understanding The Bigger Picture on the Charts

EURUSD Will Rise From SupportHello Traders
In This Chart EURUSD HOURLY Forex Forecast By FOREX PLANET
today EURUSD analysis 👆
🟢This Chart includes_ (EURUSD market update)
🟢What is The Next Opportunity on EURUSD Market
🟢how to Enter to the Valid Entry With Assurance Profit
This CHART is For Trader's that Want to Improve Their Technical Analysis Skills and Their Trading By Understanding How To Analyze The Market Using Multiple Timeframes and Understanding The Bigger Picture on the Charts

GBPUSD: Intraday Buying Setup 04/02/2026The FX:GBPUSD pair dropped after the DXY reversed to bullish. Since the start of this week, the price has been declining. We’ve identified a potential buying zone where we believe the price will likely move. Once the price reaches our marked ‘point of interest’ the trade will activate and you can set a stop loss based on your analysis and risk management.
If you agree with our work, please comment below.
Team Setupsfx_

AUDUSD: Upward Support And ResistanceHi everyone,
AUDUSD is in uptrend momentum move of support and resistance, the pair have been scaling on bullish rise, for a long time now, with the formation of higher highs, higher lows and support and resistance. price is presently at the resistance zone, in respect of the structure. we anticipate a short below this resistance.
Possible scenario:
More retracement confirmation, would trigger a sell position down to 0.6879 as potential support and target.
Thanks for reading.

BTC Bull Run For Wave 5🅶🅷🅾🆂🆃 _ 🆃🆁🅰🅳🅴🆁 _ 🆂🅰
Guys, I'm hoping everyone is doing well and printing a lot of pips 💵💵💵😊💵💵💵 during this bear move...
We might have completed (wave(4)) then we should expect more BULLS to get on board now to ride us all the way UP. for wave 5
Please make sure you validate this pattern.
I wish you all the best💵💵💵😊💵💵💵

ALGO to provide us with some GAINS as well?Hi guys,
Again as seen on the chart and historic price action or ALGO we can clearly see the PAIN points of where price is reacting and providing opportunities.
If we manage to break this trendline my first BUYS will begin at $0.16.
Risk here is holding drawdown of around -26% if price drops towards second area, so yes, in my eyes it is worth it!
Second area of accumulation and buying ALGO would be my ALL IN BUY ZONE from $0.10 to $0.14.
Potential gain from first zone towards our first target - HIGH of this cycle in 2024 is 280%!
Potential gain from ALL IN BUY ZONE is around 400%!
Second TP zone would be of course psychological level $1 where our gains from first buying area would be around 500% and from the second area would be around 700%
Please invest only what you are willing to lose, play it smart and be patient as patience is the key.

$BTC 1H Chart Analysis! CRYPTOCAP:BTC needs to reclaim $72.1K RED box level for a upside rally.
Strong hold and acceptance above this zone can open the door for bullish continuation.
Until then I’ll stay cautious and watch price reaction around this level.

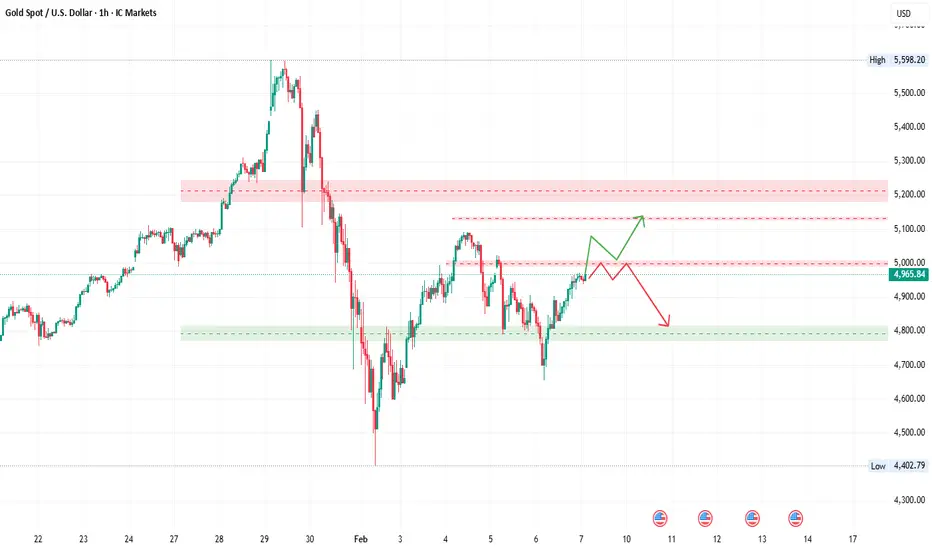
XAUUSD COILED Breakout or Breakdown? Don’t Miss This MoveICMARKETS:XAUUSD
GOLD (XAUUSD) – 1H
Bias: RANGE → BREAKOUT-BASED (Neutral to Conditional Bullish/Bearish)
Gold is currently trapped between a strong supply and demand zone, so the bias depends on which zone breaks first.
Market Structure & Reasoning
Supply Zone (Sell Area)
Zone: 5,000 – 5,200
This area caused strong bearish impulsive move earlier
Multiple rejections → institutional selling zone
Price is currently reacting just below this level
Demand Zone (Buy Area)
Zone: 4,780 – 4,820
Previous strong bullish reaction from this area
Acts as HTF demand + liquidity pool
Buyers defended this zone multiple times
Scenario 1: Bearish Rejection (Higher Probability)
Sell Setup
Sell Entry: 4,990 – 5,020
Stop Loss: 5,220
Take Profit 1: 4,880
Take Profit 2: 4,800 (demand zone)
Extended TP: 4,650 (range low sweep)
Logic:
Failure to break supply + lower high formation = downside move back into demand.
Scenario 2: Bullish Breakout (Confirmation Required)
Buy Setup
Buy Entry: 1H close above 5,050
Stop Loss: 4,950
Take Profit 1: 5,150
Take Profit 2: 5,250
Logic:
Strong close above supply turns resistance into support → continuation toward upper imbalance.
Key point to keep in mind
No aggressive buys inside supply
No aggressive sells inside demand
Wait for 1H candle close confirmation
News events can cause fake breakouts
Trade Summary
Current Bias: Range-bound
Best Trade: Sell from supply OR buy after breakout
Risk–Reward: 1:3+ possible on both setups
Continue to adjust and identify entry points for long positions.Gold has been fluctuating by $200-300 daily recently, which is no longer unusual. Our focus should be on managing and minimizing risk. We're watching the resistance level around 5000-5020. Gold is likely to continue its consolidation before choosing a direction. On the downside, we're watching the support level around 4820-4800. Technically, we continue to focus on buying on dips that hold. Recent international developments, including the US-Iran negotiations, will be key drivers of gold's price movements. We must be cautious in the face of volatile markets. Overall, gold is expected to trend upwards with some volatility. We should continue to maintain our strategy of buying on dips. If you're interested in gold but don't know where to start or are experiencing difficulties with your trading, feel free to contact me for discussion.

AUDUSD – Rejection at VAH → Gap MagnetPrice failed to accept above VAH and is trading back below value, signaling rejection.
As long as price stays below 0.7005–0.7030, downside rotation toward the gap zone (~0.6920) remains favored.
Bias: 📉 Bearish below value
Invalidation: Acceptance back above VAH

Gold Will Buy After The BreakoutHello Traders
In This Chart GOLD HOURLY Forex Forecast By FOREX PLANET
today Gold analysis 👆
🟢This Chart includes_ (GOLD market update)
🟢What is The Next Opportunity on GOLD Market
🟢how to Enter to the Valid Entry With Assurance Profit
This CHART is For Trader's that Want to Improve Their Technical Analysis Skills and Their Trading By Understanding How To Analyze The Market Using Multiple Timeframes and Understanding The Bigger Picture on the Charts

Gold Recovery Alert! Entry 4910, Watch 5107/5410Bias: Bullish above 4850
Entry Zone : 4910 – 4940 (wait for H1/H4 bullish candle)
Stop-Loss : 4780 (protects against deeper drop)
Take-Profit:
TP1 → 5107
TP2 → 5410
TP3 → 5593
Path: Expect minor dip to 4850–4860 before strong push to 5107 → 5410 → 5593.
Risk Notes : High volatility – reduce position size by 50%. Watch 5000–5050 for possible fakeout.
Summary : Buy above 4850, ride the bullish recovery. Keep SL tight, scale out at resistance levels. 🚀
⚠️Disclaimer: 👇
This is not a financial advice, trade your own Analysis

NAS100 Liquidity Play: Sweep the Lows, Then Back to the HighsTHINKMARKETS:NAS100
Market Structure & Context
Price has formed equal highs at resistance → buyers failing to break higher
Multiple rejections confirm range-bound market, not a trend
Recent sell-off shows distribution from the top of range
Current price approaching range support, where liquidity rests
Trade Bias
Range-play bias (Buy low → Sell high)
Primary idea: liquidity sweep below support, then rotation back into range
Trade Setup
Long from Support (Primary Setup)
Entry Zone: 24,250 – 24,200
(Range support + prior demand)
Stop Loss: 23,900
(Clean break below range = invalidation)
Targets:
TP1: 24,800 (mid-range reaction)
TP2: 25,400 (range high / equilibrium)
TP3: 26,000 – 26,250 (equal highs / sell-side target)
Alternative Scenario (If Support Fails)
Daily close below: 23,900
Expect continuation toward: 23,200 → 22,970
Bias flips bearish, range idea invalidated
Trade Reasoning
Equal highs signal distribution and capped upside
Price trades inside a well-defined daily range
Best R:R comes from buying support, not chasing breakdowns
Risk Note
This is a mean-reversion trade, not a trend trade — manage size accordingly.

Silver is in the Bullish directionHello Traders
In This Chart XAGUSD HOURLY Forex Forecast By FOREX PLANET
today XAGUSD analysis 👆
🟢This Chart includes_ (XAGUSD market update)
🟢What is The Next Opportunity on XAGUSD Market
🟢how to Enter to the Valid Entry With Assurance Profit
This CHART is For Trader's that Want to Improve Their Technical Analysis Skills and Their Trading By Understanding How To Analyze The Market Using Multiple Timeframes and Understanding The Bigger Picture on the Charts

Bitcoin $58,700 SupportBitcoin fell very close to final support in a dramatic sell off. That means there's a potential for it to move in this current uptrend range for a bit before it could eventually hit $58.7k. It's possible there simply aren't enough sellers to get us exactly to support either, but just keep in mind that's your optimal place to buy. This cream uptrend could also be the second best place to buy on the chance it doesn't make it to $58.7k (it's at least likely to be a good short term trade I currently have shorts at the close Friday targeting that trendline). I personally am waiting for it to hit 58.7k before buying. Ethereum still has a bit further to go to $1,530 for support, suggests to me that Bitcoin isn't done falling.
Good luck!

AAVE dump may not be over, macro triangle invalidatedCRYPTOCAP:AAVE macro triangle analysis was finally invalidated with the thrust lower. Instead, wave B of an ABC seems to be underway with an initial target of the altCoin golden pocket 0.786 Fibonacci retracement and High Volume Node support, $70.
Weekly RSI has a little room to fall until oversold. There is bullish divergence from July 1st 2024 bottom.
AAVE is again demonstrating its abnormal distribution of price action.
Safe trading

Paypal Bottom is in ?! Long from herePayPal Holdings (PYPL) is currently trading at approximately $40.42 (as of the latest close, +1.30% on the session), marking a continuation of the multi-year downtrend from its 2021 peak of ~$310–$340.
The chart applies a Fibonacci retracement drawn from the 2021 high (~$310.16) to the post-peak low zone (~$30–$34 area projected or historical).
Price has broken below several key Fib levels in sequence:
0.618 (~$89–$105 zone, previously respected as support)
0.705 / 0.786 (~$51–$67 cluster)
Current price action is testing the deeper 0.886 retracement level near $40, aligning closely with the current close.
A notable 1st Quarter Order Block (1Q OB) is visible in the $45–$50 region (prior consolidation/support area), now acting as overhead resistance following the breakdown.
Buy now, or wait for the trendline confirmation.

SILVER TRAP SET Premium Zone Rejection → Big Drop LoadingICMARKETS:XAGUSD
Market Bias: BEARISH (4H – Silver / XAGUSD)
Overall market structure is bearish (clear Lower Highs & Lower Lows).
Price is respecting a descending trendline → trend continuation bias.
The recent bullish push failed to break the 61.8%–78.6% Fibonacci retracement zone, which is acting as strong supply.
Price is trading below the 50% Fib equilibrium, confirming sellers still control the market.
Previous impulsive drop shows strong bearish momentum, current move is only a corrective pullback.
Trade Reasoning
HTF Structure
Major bearish leg from the top → impulsive sell-off.
Current price action is a corrective retracement, not a trend reversal.
Fibonacci Confluence
Strong rejection zone between 61.8% (≈81.40) and 78.6% (≈86.17).
Price failed to sustain above this premium zone → ideal sell area.
Trendline Resistance
Descending trendline is intact.
Price is expected to retest and reject this line before continuation lower.
Liquidity Targeting
Equal lows / liquidity resting below 70.40 → 68.00 → 63.80.
Market typically moves to clean downside liquidity in bearish structure.
Trade Plan
Sell Entry (Preferred)
Sell Zone: 78.50 – 80.00
Entry confirmation on LTF (rejection / bearish candle)
Stop Loss
SL: 86.30
Above 78.6% Fib + structure high
This level invalidates bearish idea
Take Profit Targets
TP1: 74.70 (38.2% Fib – partial booking)
TP2: 70.40 (23% Fib + demand zone)
TP3 (Runner): 63.80 (range low / major liquidity)
Trade Summary
Trend: Bearish
Setup: Pullback → Sell from premium
Logic: Structure + Fib + Trendline confluence
Risk-Reward: High (1:3 to 1:5)
As long as price stays below 86.30, the bearish bias remains valid.
A strong close above that level would invalidate the setup.

GBPUSD – LVN + 50% Retrace as Decision ZonePrice is reacting into a LVN aligned with the 50% retracement, acting as a decision area, not value.
Failure to accept above 1.3640–1.3650 keeps downside rotation favored toward lower value.
Bias: 📉 Bearish below LVN
Invalidation: Acceptance above 1.3650

USDJPY – LVN → HVN RotationPrice is rotating through a Low Volume Node (LVN), acting as a fast transition zone toward the HVN (158.10–158.30).
As long as 157.20 holds, continuation higher remains favored.
Bias: 📈 Bullish above LVN
Invalidation: Acceptance below 157.20
