Mastering MACDTurning a Popular Indicator Into a Structured Decision Tool
Many traders use MACD as a simple signal generator. They see a crossover, enter a trade, and later realise the result does not match the expectation. MACD becomes useful only when it is applied inside a clear framework built on trend, momentum, and timing. Its real value lies in reading shifts in participation rather than delivering standalone entry signals.
Understanding what the indicator represents is the first step. MACD measures the relationship between two moving averages and reveals how fast price is accelerating or slowing down. The histogram shows the rate of change. When used with intent, MACD helps you read the strength behind a move instead of trying to predict direction. Momentum confirms structure and brings clarity to the decision process.
Define the market environment before looking at MACD. Trending markets and ranging markets produce different behaviours. In a trend, a rising histogram often supports continuation and helps you judge whether a pullback is healthy or the start of a deeper rotation. In a range, the histogram moves around the zero line and highlights areas where momentum is fading. Without this context, MACD signals tend to mislead more than they help.
The next step is aligning MACD with the locations your system already relies on. Use it as part of the confluence, not as a trigger. When price reaches a higher-timeframe level, a liquidity area, or a clear structural pivot, the histogram can show whether momentum is shifting in your favour. You are not asking MACD to discover the trade. You are using it to confirm the logic you have prepared.
With structure and location in place, create specific decision rules for MACD behaviour. Examples include shrinking momentum when price approaches a level, expansion that supports a breakout, crossovers that match the higher-timeframe direction, or divergences that signal exhaustion at important zones. Every rule needs to serve a practical purpose. Reacting to every crossover removes discipline and weakens the system. Well-defined conditions make MACD a reliable filter.
Risk management remains outside the indicator. MACD does not define stops, invalidation, or how much to risk. Those rules come from structure. Stops should respect swing highs or lows, well-defined invalidation areas, or volatility-based distances. Combining this approach with MACD’s momentum read protects you from chasing trades that lack strength and reduces over-engagement during slow conditions.
Validation closes the loop. Backtest the exact behaviours you rely on, not the indicator as a whole. Study how histogram shifts behave at your chosen levels. Compare momentum against structure. Track how timing improves when MACD is used to refine execution instead of generate entries. When the data confirms the rules across different market conditions, the system gains stability.
MACD becomes a valuable asset when integrated into a disciplined process. On its own, it produces too much noise. Inside a structured system, it sharpens momentum reading, filters out weak trades, and builds cleaner execution. Traders who use MACD to support their framework instead of driving it achieve far greater consistency over time.
Analysis

Trend Shift Observed Can Rally ContinuationThe price structure shows a clear trend shift, indicating that momentum has changed direction. After this structure change, the chart suggests that the rally may continue based on current price behavior and follow-through. This idea focuses only on observing trend transition and continuation through price action.

Gold Forex Trading During Major Economic Events & News Releases
I guess you already noticed how impulsively the markets may react to economic events and news.
In this article, I will teach you a simple strategy to follow during important news release s and how to trade news.
1. Sort out the economic calendar
There are a lot of news in the economic calendar.
They are not equal in their impact.
Most of the economic calendars indicate the potential significance of each event: while some news have low importance, some have medium importance and some are considered to be extremely important.
For example, above is the list of coming UK fundamental news.
You can see that these news have different degree of importance.
My recommendation to you is to sort out the economic calendar in a way, so it would display only the most important news.
Among the news that we discussed above, only one release has high importance.
2. Know on what trading instruments does the news have an effect
While some of the news in the economic calendar may impact many financial markets and trading instruments, some news may affect very particular instruments.
For example, a FED Interest Rate decision may have a very broad effect on financial markets.
At the same time, Interest Rate Decision in Australia may affect only Australia - related instruments.
3. Don't trade one hour before the news and one hour after the release
Once you see the important fundamental news coming, don't trade the trading instruments that can be affected by the new s 1 hour before and after the release.
For example, in 5 minutes we are expecting important UK news - CPI data.
I stopped trading GBP pairs 1 hour before the release of the news, and will resume trading them one hour after the release.
4. Protect your trading positions 5 minutes ahead of the news
If you have an active trading position and related important news are expected, move your stop loss to entry 5 minutes ahead of the release of the news.
For example, I have a short trade on GBPAUD. I see that in 5 minutes important UK data is coming. I will move stop loss to entry 5 minutes ahead of the news and make a position risk-free.
I always say to my students, that news trading is very complicated. Due to a high volatility, it is very hard to make wise decision during the news releases.
The approach that I suggest will help you to avoid all that and trade the markets when they are calm.
❤️Please, support my work with like, thank you!❤️
I am part of Trade Nation's Influencer program and receive a monthly fee for using their TradingView charts in my analysis.

How to Build a Consistent Execution Checklist on TradingViewMost trading mistakes don’t come from bad strategy, they come from inconsistent execution.
An execution checklist removes guesswork and replaces it with structure.
When your actions follow a routine, your results stabilize.
TradingView gives you everything you need to build a checklist that stays visible, actionable, and tied directly to your chart.
1. Define Your Core Conditions
Before any trade, the bigger picture must be clear.
Start your checklist by answering three questions:
What is the higher-timeframe direction
Where is price relative to key levels
Is price approaching with strength or weakness
Use TradingView’s drawing tools to mark support, resistance, value zones, and session highs and lows.
Add a simple text note on the chart listing your core conditions so they are always visible.
If the market context fails this first screen, the trade is already invalid.
2. Build Confirmation Criteria
Once structure is confirmed, you move to evidence.
Mark confirmation areas directly on your chart:
Liquidity pools
Fair value zones or imbalances
Previous session highs and lows
Asian range or New York open
If your strategy uses indicators, document exact conditions:
Moving average position and slope
Volume behavior
VWAP location
Volatility expansion or contraction
Define rules that don’t change based on emotion.
Confirmation should prove your bias, not justify your urge to trade.
3. Validate Risk Before Execution
Every setup must survive a risk checkpoint before it’s allowed to go live.
Your checklist must answer:
Where is my invalidation level
How much capital am I risking
Does this violate any daily limits
Is the reward worth the risk
Use TradingView’s long or short position tool to visualize risk directly on the chart.
Save it as a template so your risk process stays uniform across all trades.
No trade is valid if risk isn’t clean.
4. Create a Pre-Execution Routine
A checklist only works if you actually follow it.
Add a short pre-trade process directly to your chart notes using checkboxes or bullet points:
Example execution checklist:
Market phase confirmed
Level identified
Confirmation present
Risk valid
Entry condition active
Walk through this list before clicking buy or sell.
If one item fails, the trade fails.
Over time, this routine removes emotional impulse completely.
5. Review and Refine Weekly
Your checklist isn’t static, it evolves.
Every week ask:
Where did I break my rules
What conditions led to losses
Which confirmations work best
What rules saved me from bad trades
Use TradingView’s trade replay and journaling features to review execution quality, not just profit.
Consistency improves when your system evolves with you.
Final Thought
A checklist doesn’t restrict your trading, it frees you from emotion.
When your process is clear, your confidence increases.
When your confidence increases, discipline follows.
Good traders make decisions.
Great traders execute procedures.
Stay Green!
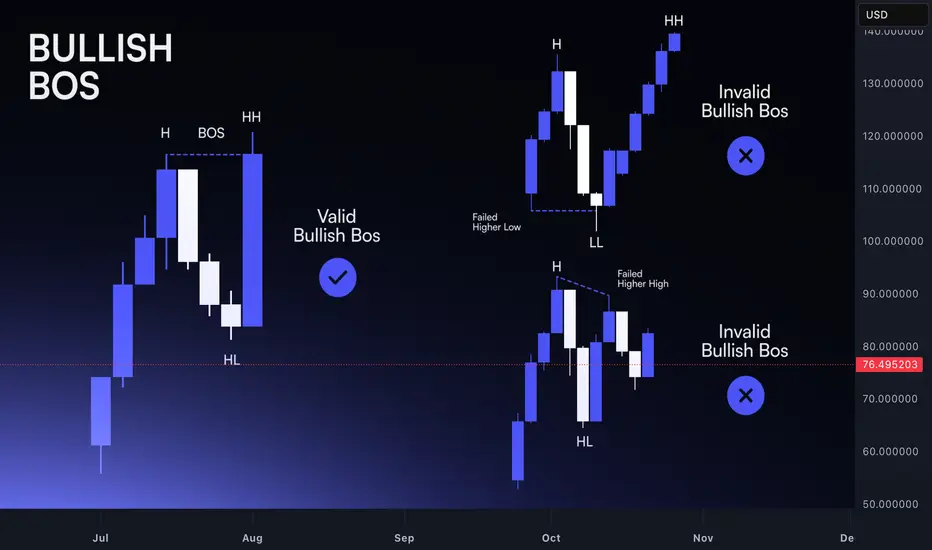
Break of Structure: Identifying Real Trend Shifts Markets move in phases, and structure is the clearest way to read those transitions. A trend doesn’t reverse because price slows down or because a candle looks different. It reverses when the underlying pattern of highs and lows breaks.
Understanding this sequence is what separates disciplined analysis from reactive guessing.
In an uptrend, buyers defend higher lows and push price into higher highs. As long as this structure holds, the trend is intact. Noise may create deep pullbacks or temporary hesitation, but the narrative remains unchanged.
The first sign of vulnerability appears when price fails to create a meaningful higher high. Momentum stalls, and the next push upward shows less conviction.
The real shift comes when a higher low is taken out. This is the break of structure. It shows that buyers no longer control the market, and sellers have absorbed enough liquidity to push through a prior defensive point.
This is not a prediction; it’s an objective change in the market’s behaviour. A single candle doesn’t define it. The sequence does.
For downtrends, the logic is the same in reverse. Lower highs and lower lows define control. When price fails to print a clean lower low and then breaks a prior lower high, the trend loses integrity. Structure reveals the turning point before sentiment catches up.
However, not every break is a real shift. Crypto produces countless intraday spikes that violate levels without altering the broader narrative.
The difference lies in context. A valid break is supported by:
– Clear momentum into the break
– Liquidity taken before the shift
– Follow-through after the level is broken
– A retest that confirms the new direction
These factors filter out noise and highlight genuine transitions. Watching price break structure is not enough; you must also assess whether the move fits within the larger story of the trend.
A break of structure doesn’t mean instant reversal. It means the previous trend has ended. The next phase might be consolidation, re-accumulation, or immediate reversal, but the bias shifts the moment structure changes.
Traders who read structure objectively adjust earlier and avoid fighting a direction that no longer has control.
Once you internalize how highs and lows interact, spotting real shifts becomes a structured process instead of an emotional reaction. Structure turns confusion into clarity and gives you a reliable framework for navigating both trends and transitions.
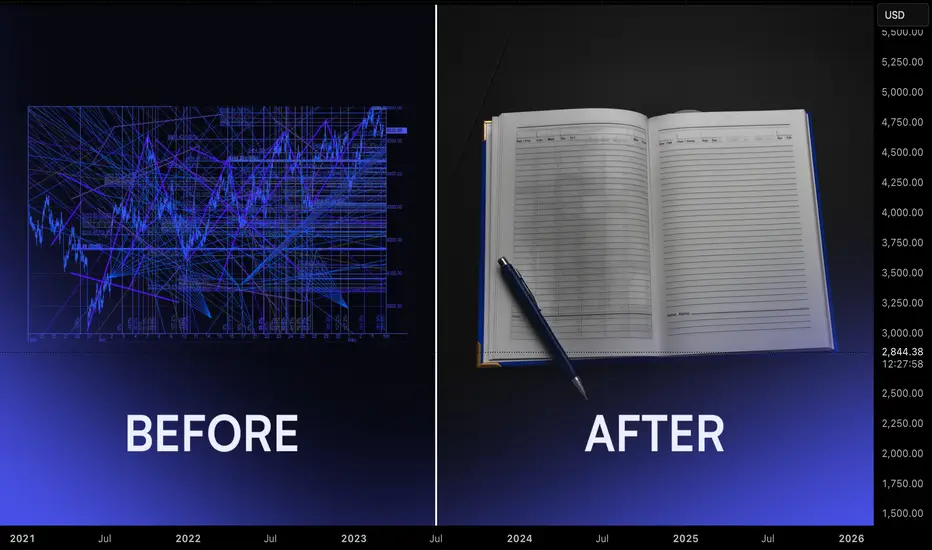
Journaling For Traders: Turning Random Results Into A Feedback Most traders spend years tweaking indicators and strategies while leaving their process undocumented. Without a journal, every trade feels new, every mistake repeats, and progress stays vague. A structured journal turns experience into data. It shows what you do well, what keeps failing, and which behaviours appear before your best and worst decisions.
The first step is simple: record every trade. Log the setup, market structure, entry reason, risk, and emotional state. Write whether you felt rushed, confident, bored, or frustrated. Do not only record wins or big losses. Incomplete data keeps blind spots alive.
The real value appears during weekly review. Set time aside after markets slow down and go through the trades as a batch. Look for recurring situations. You may notice that late-session entries perform poorly, that you increase size after wins, or that you cut trades early when size feels uncomfortable. These patterns are not visible inside a single session. They emerge only over a cluster of trades.
Next, extract insights. Group trades by setup, session, and emotional state. Identify your highest quality combinations. For example, trend continuation trades in London with fixed risk might show a strong performance profile while countertrend entries in low volume hours consistently underperform. This step separates what you think works from what actually delivers.
Finally, adjust strategy. Turn observations into rules. Reduce or remove the behaviours that repeatedly drain capital. Formalise the conditions that define your best trades. Add small process rules rather than full rewrites, then track the impact in the next review cycle. Over time, your playbook becomes evidence based rather than theoretical.
Journaling is not an extra task for perfectionists. It is the operating system behind professional execution. When you continuously record, review, extract, and adjust, your trading process compounds in quality even when individual weeks are difficult.
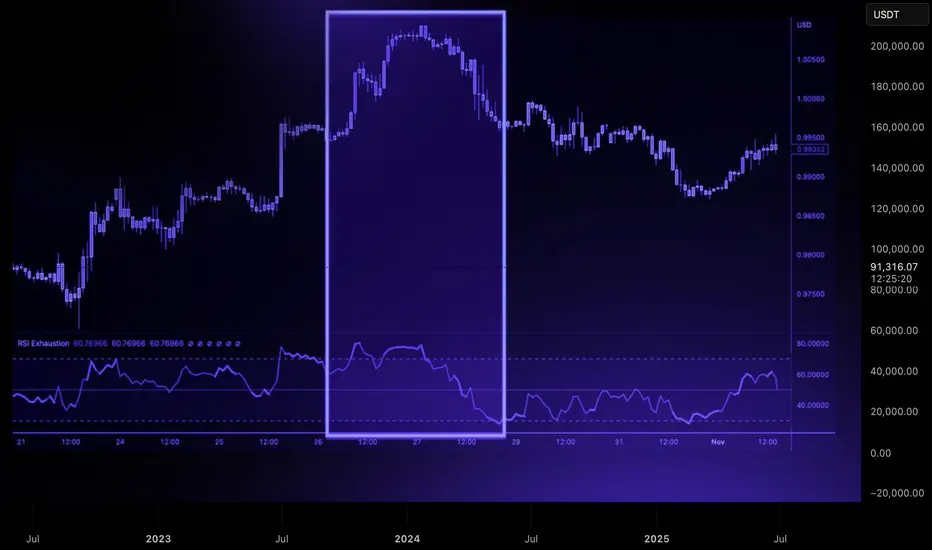
Trend Exhaustion: How to Spot a Reversal Before It HappensReversals rarely start with dramatic candles. They begin quietly, through subtle shifts in momentum and structure that most traders overlook.
A strong trend doesn’t collapse all at once. It loses strength in stages, and those stages are visible long before price turns in the opposite direction.
The first sign of exhaustion is weakening impulse strength. In a healthy trend, impulsive moves are clean and decisive, and retracements are controlled. When each new push produces smaller higher highs or lower lows, it signals reduced participation.
Buyers or sellers are still present, but the force driving the trend is fading.
The second clue lies in how price interacts with liquidity. Strong trends break key levels with conviction. Exhausted trends start reaching above highs or below lows only to reject immediately.
These sweeps show that the market is clearing liquidity without gaining follow-through, often trapping late entries and signaling that larger players are offloading positions.
A third indication appears when structure begins to fracture. An uptrend losing its higher-low sequence or a downtrend failing to maintain lower highs is a shift in narrative. A single break is not confirmation, but when it aligns with slowing impulses and liquidity failures, momentum is clearly changing.
Volatility then begins to compress. Candle ranges shrink, movement becomes less directional, and price enters a tightening pattern.
This compression often precedes expansion in the opposite direction. When a decisive candle breaks out of this cluster, the reversal typically accelerates.
Trend exhaustion is about recognizing when the conditions that supported continuation no longer exist.
By reading momentum, liquidity, and structure together, you can anticipate shifts earlier, manage risk more effectively, and position yourself on the right side of the next move.
Anticipate Movement Inside of a Range EnvironmentA large portion of crypto price action does not trend. It ranges. And for many traders, this is where the most capital is lost. A range environment feels simple on the surface price moves between two boundaries, but inside those boundaries, liquidity builds, traps form, and false signals appear constantly. Understanding how ranges behave is a core skill for developing consistency.
A range forms when the market fails to create meaningful higher highs or lower lows. Buyers and sellers balance out, and price oscillates between defined support and resistance. This compression is not random. It reflects indecision, accumulation, or distribution depending on the higher-time frame context. Traders who treat a range like a trend are the ones most often punished.
The first step is identifying the boundaries. Equal highs at the top of a range and equal lows at the bottom reveal where stops accumulate. These stops become liquidity pools. Price frequently sweeps one side of the range before moving to the other, trapping breakouts and fading momentum traders. A clean sweep is not the breakout; it is the intention-revealing event before direction is chosen.
Inside the range, structural signals lose reliability. Traditional trend tools cannot be applied. Instead, focus on behaviour at the edges: rejection wicks, failed breakouts, displacement after a sweep, and reclaim patterns. These reactions show whether a sweep is simply clearing liquidity or if a genuine expansion is developing.
Patience is critical. Entering in the middle of the range exposes you to noise, uncertainty, and poor reward-to-risk. The edge comes from waiting at the boundaries where liquidity sits and confirmation appears. A range can persist far longer than expected, so forcing trades inside it leads to frustration and unnecessary losses.
The real purpose of studying ranges is not just to trade them but to anticipate what follows. A compression phase often precedes expansion. When liquidity on one side is taken and price breaks structure with intent, the next directional leg becomes far easier to participate in. Ranges are where future trends prepare themselves.

Risk Management for Automated SystemsAutomation gives you speed, consistency, and emotionless execution, but it also has a dark side.
A bot can follow rules perfectly, but if the rules are risky, it will amplify the danger with mechanical precision.
That’s why risk management is the backbone of every successful automated strategy.
It doesn’t matter how good your code is — without proper risk control, even the smartest system can fail fast.
Below are five core pillars of risk management that every trader should build into their automation framework.
1. Know Your Maximum Drawdown
Every trading system, even the best one, goes through losing streaks.
What matters isn’t avoiding them, but controlling how deep they cut.
Setting a maximum drawdown limit defines the exact point where your bot pauses or shuts down.
Whether it’s 5%, 10%, or 20%, this boundary protects your capital and your mindset.
Why it matters:
Prevents “death spirals” during high volatility
Stops the system if market conditions change
Forces you to step back and evaluate logic
Protects the account from black swan trends
A bot that can’t stop itself, is a bot that will eventually blow up.
A bot that knows when to stop, survives.
2. Position Sizing Is Everything
You can have the best entry logic in the world, but if your position sizes are inconsistent or too large, the system becomes unstable.
Smart position sizing adapts to:
Account balance
Market volatility
Asset liquidity
A fixed-percentage model, such as risking 1–2% per trade, keeps performance steady even during rough periods.
It also allows your system to grow naturally without taking oversized risks.
Think of sizing as the volume knob of your bot — turn it too high, and you distort everything.
3. Avoid Correlated Exposure
Running several bots doesn’t automatically mean you are diversified.
Many traders make the mistake of running multiple strategies that all rely on the same market behavior.
For example:
Three momentum bots on BTC, ETH, and SOL are still highly correlated
Two trend systems may fail at the same time if the market suddenly ranges
Several “dip-buying” strategies will all get hit hard during a crash
True diversification means mixing:
Uncorrelated assets
Different signal types
Varying timeframes
Both trend and mean-reversion logic
The goal is for your bots to perform differently, not identically.
4. Review Your System’s Risk Profile
Markets change, and so should your risk model.
Volatility increases and decreases, spreads widen, volume dries up, and certain assets become more unpredictable.
Regular reviews ensure your system stays aligned with real conditions.
What to check:
Has drawdown increased over the last quarter?
Are trades becoming larger than planned due to volatility shifts?
Has your system entered a new market phase it wasn’t designed for?
Are win rates or profit factor weakening?
A quarterly or monthly audit reveals issues before they explode.
Risk management isn’t a one-time setup — it’s a continuous process.
A strategy tester can be very good tool to help you manage risk properly and evaluate risk.
Here is an example from one of our strategies.
5. Let Risk Management Be Automated Too
If your entries are automated but your risk controls aren’t, you’re only half-protected.
Risk management logic you can automate:
Stop-loss placement
Progressive stop tightening
Position scaling
Reducing size after a losing streak
Pausing after reaching a daily or weekly limit
Complete shutdown at max drawdown
This turns your bot into a self-regulating system that responds to both opportunity and danger.
The more risk rules you automate, the less emotional interference you’ll face — and the more consistent your results become.
How i trade This is how i trade.
Looking at AUDJPY, I want to show you step by step how i trade using volume, momentum and rsi, looking at each timeframe from the monthly to the 5 min.

Building a Trading System: From Idea to ExecutionEvery trader starts with an idea — a setup, a pattern, a theory that seems to work.
But until that idea becomes a structured system, it’s just intuition.
A trading system gives your ideas rules, logic, and repeatability.
That’s the difference between a trader who hopes, and a trader who executes.
Define the Core Idea
Every system begins with an observation.
Maybe you notice breakouts after volume spikes, or reversals after RSI divergence.
Whatever the logic, write it down.
A system has to be specific, if you can’t define it clearly, you can’t test it.
Set Your Entry and Exit Rules
Your system should answer three things precisely:
When to enter a trade
When to exit a trade
How much to risk
Ambiguity is the enemy.
Rules make your strategy repeatable, testable, and objective.
Backtest the Logic
Before going live, test your rules on past data.
You’re not looking for perfection, you’re looking for consistency.
If your logic survives bull, bear, and sideways markets, it’s valid.
Track win rate, drawdown, and profit factor — they’ll tell you what’s working.
Execute With Discipline
A system only works if you do.
Follow the rules exactly as tested, even when it feels uncomfortable.
Consistency turns probability into profit — emotions destroy both.
Application
Here we have a very good example from our trading signals where we executed one of our strategies for 10 days. The strategy was designed with detailed inputs, logic and executed with a precise setup in a trading bot.
Refine and Evolve
Once live, keep notes.
Track how the system performs under real conditions.
Make small, measured improvements based on data, not emotion.
A system should evolve, not change its identity.
Redefining and tuning is a part of the process, there is no strategy that lasts forever, everything needs to evolve and adjust!
Backtesting 101: How to Turn an Idea Into a Tested StrategyEvery trader has thought it:
“If I’d just followed that setup every time, I’d be up big.”
That’s where backtesting steps in, it separates luck from logic.
It’s how you find out whether your strategy has a real edge, or just worked in hindsight.
Most traders skip it, not because it’s useless, but because it forces them to face the truth.
But if you can handle that truth, backtesting will make you a far more confident trader.
What Backtesting Really Is
Backtesting means applying your trading rules to historical data to see how your system would have performed.
It’s not about predicting the future, it’s about proving whether your idea works in different market conditions.
When done properly, it gives you three key insights:
Profitability: does your edge actually exist?
Risk: how deep are the drawdowns, and can you handle them?
Consistency: does it work across bull, bear, and sideways markets?
A solid backtest gives you confidence, not because it guarantees profit, but because it exposes weakness before the market does.
The Most Common Mistakes
Curve-fitting: tweaking rules until the past looks perfect.
Ignoring fees and slippage: small costs that quietly erase profits.
Testing too little data: short periods create false confidence.
Focusing on one market: edges must survive different conditions.
If your backtest looks too clean, it’s probably lying to you.
Why It Matters
Backtesting builds trust in your system and discipline in yourself.
When you know your data, you stop second-guessing every trade.
Losing trades stop feeling like failure, because you understand they’re part of a proven edge.
Even bots rely on backtesting. Without it, automation is just random execution.
With it, every trade follows structure, not emotion.
All of these points make a difference between a winning or losing strategy.
From Idea to System
Every strategy starts as a hypothesis.
Backtesting turns that hypothesis into data.
Data turns into structure.
Structure turns into consistency.
That’s the real path to professional trading - logic first, emotion second.

Trading Bots: The Future of the Markets?Let’s be real, the idea of a trading bot sounds like the holy grail.
Set it up, go to bed, and wake up to profit.
If only it were that simple.
Most bots don’t fail because of bad code, they fail because of bad logic.
A bot is only as good as the rules you give it.
What a Trading Bot Actually Does
A bot doesn’t predict the market, it reacts to it.
It follows a defined strategy:
Buy when X happens, sell when Y is confirmed, cut losses if price breaks Z.
That’s all.
No fear. No greed. No “maybe I’ll wait for one more candle.”
The power of bots isn’t in magic,it’s in consistency.
They do what most traders can’t: follow the plan exactly as written, every single time.
Why Most Bots Fail
The truth?
Most traders plug in random bots they find online without understanding what’s inside.
They win a few trades, feel invincible… and then lose it all when volatility spikes.
The reason isn’t the bot, it’s the lack of testing and understanding.
If you don’t know your system’s weak spots, you’ll eventually find them the hard way.
That’s why backtesting matters.
Backtesting: Your First Line of Defense
Backtesting shows how your logic performs over hundreds of trades — across bull, bear, and sideways markets.
It reveals your system’s strengths, weaknesses, and drawdowns before you risk a dollar.
A good backtest should tell you:
Your average win rate and risk/reward ratio.
How your system handles volatility.
How often it hits consecutive losses.
Whether your edge actually holds over time.
If your bot looks good in backtests and performs similarly in live conditions — you’re onto something real.
*Example of one of our indicator
How Bots Can Enhance Your Trading
You don’t have to hand everything over to automation.
In fact, many great traders use bots to handle the mechanical side, while keeping the decision-making human.
Here are a few examples:
Trade Execution: Let the bot enter trades instantly after your setup triggers.
Risk Management: Bots can move stop-losses, take partial profits, or scale positions automatically.
Signal Filtering: Use automation to scan hundreds of pairs and alert you only when conditions align.
Backtesting Sandbox: Test new ideas safely with data before deploying them live.
Bots don’t replace traders, they multiply efficiency.
They free your mind from execution so you can focus on refinement.
The Real Lesson
A trading bot isn’t a shortcut.
It’s a mirror, it reflects your discipline, your rules, and your logic.
If your plan is solid, a bot will make it unstoppable.
If your plan is weak, it’ll just lose money faster.
Automation doesn’t fix bad habits, it exposes them.
So learn the logic, test it hard, then let the system do what humans struggle with most: follow the plan.

Indicators and Trading Signals — How It WorksWhen you first start trading, indicators feel like the secret sauce.
RSI, MACD, EMA, Volume every line promises to reveal what the market will do next.
You start stacking them like LEGO blocks, thinking more confirmation = more accuracy.
But here’s the hard truth: indicators don’t predict they react.
The real skill isn’t using more of them, it’s knowing when to listen and when to ignore.
The Role of Indicators
Indicators are tools, not magic formulas.
They exist to translate price action into structure. That’s it.
RSI tells you about momentum.
Volume shows commitment.
Moving averages reveal trend direction.
Volatility indicators show risk zones.
The power isn’t in the tool itself, it’s in how consistently you interpret it.
That’s why two traders can look at the same RSI line and do completely opposite things.
The Trap: Signal Hunting
Every trader falls into this phase: jumping from one setup to another, waiting for that “perfect signal.”
The problem?
There isn’t one.
Even the best indicators will fail if your execution and mindset aren’t aligned.
Signals don’t make money! Systems do.
Systems combine momentum, volume, volatility, and trend logic, so signals confirm each other, not contradict.
Signal vs Execution
Let’s be real, getting a signal is the easy part.
Following it correctly is where most traders fall apart.
You get a buy signal… but wait for “one more candle.”
You see a sell alert… but hold, just in case it bounces.
You close early because “it already moved enough.”
That’s why automation matters.
It doesn’t second-guess, it executes.
From Noise to System
If your screen looks like a Christmas tree of indicators, you’re not trading, you’re guessing.
Clean it up.
Pick a few tools that complement each other, build rules around them, and stick to those rules.
That’s how professionals think: less emotion, more structure.
2008 Crisis and How the Banking System Has Changed Since:
⚠️These headlines serve as a reminder that despite the Basel I, II, and III global banking regulations, we have not been spared from systemic risks originating within the financial system itself
🏦After the 2008 crisis, banks became heavily overregulated. As a result, many of their most lucrative investment and financing activities shifted into affiliated offshore hedge funds — entities that remain very much part of the same global financial machinery. They are simply no longer called “banks,” and therefore escape almost all regulation.
💵These hedge funds lend, repackage loans, buy and sell exotic financial instruments, re-hypothecate, and re-collateralize. They use questionable collateral to issue risky loans , which are then resold, repackaged, and used again as collateral again.
💰 Exotic derivatives, curreny swaps, REPO operations, outright fraud,risky options market-making, — you name it — all thrive offshore , far from regulatory oversight yet just a click away for clients. And make no mistake: these so-called “non-banks” are deeply interconnected with the global financial system. If they fail, the shockwaves will be felt everywhere.
📈 The next financial tsunami will begin offshore — but it’s the onshore world that will be hit the hardest . So don’t keep large sums of money in the bank, guys. Once your funds are in the bank, they’re no longer truly yours — they belong to the bank. Your account can be frozen, blocked, seized, taxed, or even converted into shares (as happened in Spain in 2011).
⚠️And remember: banks can fail. They will fail. And when they do — the government won’t save you.
Yours truly,
Greg🌹

Friday - the day the market shows its true faceEveryone loves chasing moves early in the week - Monday, Tuesday, news, data drops. But if you look closer, the most honest market signals usually appear on Fridays. By that time, the fight between buyers and sellers is settled, and the price reveals who really has control.
When big funds and banks are confident about direction, they don’t rush to close positions before the weekend. The market often ends the week at its highs - and Monday continues the same move. But if selling pressure picks up late on Friday, it’s usually a warning sign: traders are nervous and prefer not to hold risk over the weekend.
Friday’s close isn’t just another candle - it’s the verdict for the entire week. A close near the top of the range means demand is strong; near the bottom means fear and profit-taking are taking over.
Retail traders often close everything before the weekend to “stay safe.” But smart money uses those thin Friday hours to shake out weak hands and grab liquidity. That’s why the real moves often begin right after those late-week impulses.
What to keep an eye on:
1. Watch where the price closes within the weekly range - it sets the tone for Monday.
2. Check volume during the last trading hours - it tells you who’s really in control.
3. A strong Friday move with no news? Often that’s the setup for next week’s trend.
Friday’s action is rarely random. It’s the final scene before the next act of the market drama.
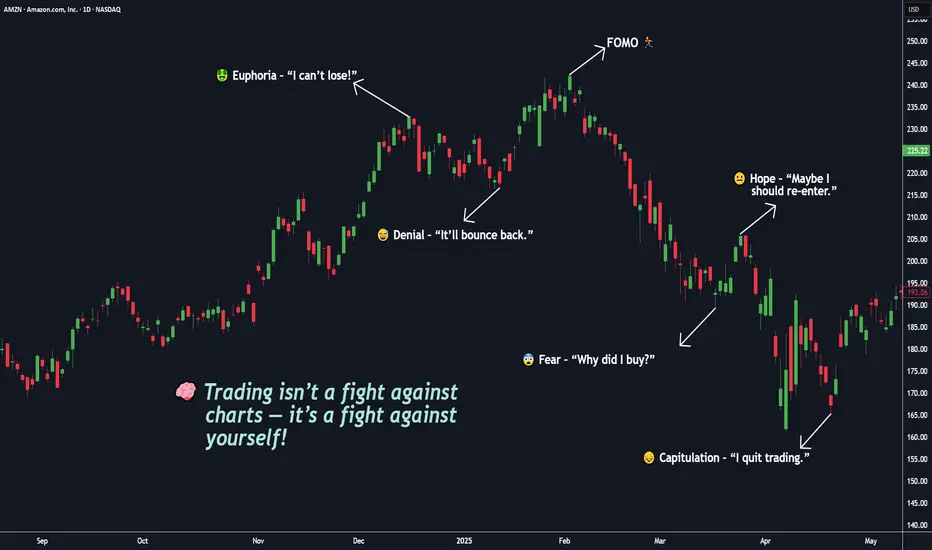
You’re Not Competing With the Market, You’re Competing With Self🧠 Trading isn’t a fight against charts — it’s a fight against yourself.
If you’ve ever told yourself “I’ll just take one more trade”, you already know this battle.
But in truth — the real battle happens inside your mind.
You start your day with discipline: BITSTAMP:BTCUSD , NASDAQ:AMZN , OANDA:XAUUSD , NASDAQ:META
📋 “ Two setups max. 1% risk. No emotions. ”
But then the market shows you something that looks perfect.
Price moves fast. Your pulse jumps. You click “BUY BUY BUY.”
Seconds later , the candle reverses — and suddenly, you chase a candle, break a rule, or move your stop just to “ give it a little more space ,” you’re not losing to the market my friend, You’re losing to your own impulses. ⚔️
You’re not trading the chart anymore — you’re trading your hope. And that’s what makes trading beautiful — it’s not a test of intelligence, it’s a mirror of your self-awareness.
That’s when the market does what it always does: it punishes emotional decisions and rewards patient ones.
💭 Emotionally! You start bargaining with yourself:
“It’ll come back.” ( When you’re greedy → it exposes it. )
“I’ll just move my stop a little.” ( When you’re fearful → it magnifies it. )
“Let me add to average out.” ( When you’re calm → it rewards it. )
The market doesn’t care if you win or lose. It simply amplifies your inner state.
You Digest it or not!, the truth most don’t want to accept:
You can’t control the market.
You can’t control news, indicators, or price spikes.
But you can control your reactions.
The moment you stop reacting and start observing — your trading transforms.
Clarity comes only when emotion leaves. 💎
⚡ Trading isn’t about predicting moves — it’s about managing yourself during those moves.
🎯 Real-Life Example:
Think back to the last time you made money on a random FOMO entry. It felt good, right?
That “instant win” wired your brain to believe impulsiveness works.
But the next time, that same instinct cost you twice as much.
That’s recency bias — one of trading’s silent killers.
Your brain craves the last emotion it felt, not the right decision.
💎 True mastery begins when you stop asking:
“Why did the market do that?”
and start asking:
“Why did I react like that?” ( 👉 “ Am I reacting, or am I responding ?” )
The market has no emotions . It’s just reflecting yours back at you — amplified, delayed, and multiplied by leverage. ⚔️
🧩 Here’s the mindset shift, that changes everything:
You don’t need to win every trade. You need to trade as if you already know yourself.
You don’t need a better indicator. You need a clearer mirror.
The edge isn’t on the screen — it’s inside your head.
When you realize that, trading becomes peaceful and You stop chasing, You start choosing.
Master that single question, and you’ll outperform 90% of traders who never will.
💬 What’s one emotion you think costs you the most trades —
👉 Fear 😨
👉 Greed 🤑
👉 Impatience ⚡
🧩 Drop it below 👇 and let’s talk about how to overcome it — build awareness together as traders, not competitors.
If this Idea gave you a value information then please, Boost it, share your thoughts in comments, and follow for more practical trading!
Happy Trading & Investing!
Team @TradeWithKeshhav
Quantitative Trading Models in Forex: A Deep DiveQuantitative Trading Models in Forex: A Deep Dive
Quantitative trading in forex harnesses advanced algorithms and statistical models to decode market dynamics, offering traders a sophisticated approach to currency trading. This article delves into the various quantitative trading models, their implementation, and their challenges, providing insights for traders looking to navigate the forex market with a data-driven approach.
Understanding Quantitative Trading in Forex
Quantitative trading, also known as quant trading, in the forex market involves using sophisticated quantitative trading systems that leverage complex mathematical and statistical methods to analyse market data and execute trades. These systems are designed to identify patterns, trends, and potential opportunities in currency movements that might be invisible to the naked eye.
At the heart of these systems are quantitative trading strategies and models, which are algorithmic procedures developed to determine market behaviour and make informed decisions. These strategies incorporate a variety of approaches, from historical data analysis to predictive modelling, which should ensure a comprehensive assessment of market dynamics. Notably, in quantitative trading, Python and similar data-oriented programming languages are often used to build models.
In essence, quantitative systems help decipher the intricate relationships between different currency pairs, economic indicators, and global events, potentially enabling traders to execute trades with higher precision and efficiency.
Key Types of Quantitative Models
Quantitative trading, spanning diverse markets such as forex, stocks, and cryptocurrencies*, utilises complex quantitative trading algorithms to make informed decisions. While it's prominently applied in quantitative stock trading, its principles and models are particularly significant in the forex market. These models are underpinned by quantitative analysis, derivative modelling, and trading strategies, which involve mathematical analysis of market movements and risk assessment to potentially optimise trading outcomes.
Trend Following Models
Trend-following systems are designed to identify and capitalise on market trends. Using historical price data, they may determine the direction and strength of market movements, helping traders to align themselves with the prevailing upward or downward trend. Indicators like the Average Directional Index or Parabolic SAR can assist in developing trend-following models.
Mean Reversion Models
Operating on the principle that prices eventually move back towards their mean or average, mean reversion systems look for overextended price movements in the forex market. Traders use mean reversion strategies to determine when a currency pair is likely to revert to its historical average.
High-Frequency Trading (HFT) Models
Involving the execution of a large number of orders at breakneck speeds, HFT models are used to capitalise on tiny price movements. They’re less about determining market direction and more about exploiting market inefficiencies at micro-level time frames.
Sentiment Analysis Models
These models analyse market sentiment data, such as news headlines, social media buzz, and economic reports, to gauge the market's mood. This information can be pivotal in defining short-term movements in the forex market, though this model is becoming increasingly popular for quantitative trading in crypto*.
Machine Learning Models
These systems continuously learn and adapt to new market data by incorporating AI and machine learning, identifying complex patterns and relationships that might elude traditional models. They are particularly adept at processing large volumes of data and making predictive analyses.
Hypothesis-Based Models
These models test specific hypotheses about market behaviour. For example, a theory might posit that certain economic indicators lead to predictable responses in currency markets. They’re then backtested and refined based on historical data to validate or refute the hypotheses.
Each model offers a unique lens through which forex traders can analyse the market, offering diverse approaches to tackle the complexities of currency trading.
Quantitative vs Algorithmic Trading
While quant and algorithmic trading are often used interchangeably and do overlap, there are notable differences between the two approaches.
Algorithmic Trading
Focus: Emphasises automating processes, often using technical indicators for decision-making.
Methodology: Relies on predefined rules based on historical data, often without the depth of quantitative analysis.
Execution: Prioritises automated execution of trades, often at high speed.
Application: Used widely for efficiency in executing repetitive, rule-based tasks.
Quantitative Trading
Focus: Utilises advanced mathematical and statistical models to determine market movements.
Methodology: Involves complex computations and data analysis and often incorporates economic theories.
Execution: May or may not automate trade execution; focuses on strategy formulation.
Application: Common in risk management and strategic trade planning.
Implementation and Challenges
Implementing quantitative models in forex begins with the development of a robust strategy involving the selection of appropriate models and algorithms. This phase includes rigorous backtesting against historical data to validate their effectiveness. Following this, traders often engage in forward testing in live market conditions to evaluate real-world performance.
Challenges in this realm are multifaceted. Key among them is the quality and relevance of the data used. Models can be rendered ineffective if based on inaccurate or outdated data. Overfitting remains a significant concern, where systems too closely tailored to historical data may fail to adapt to evolving market dynamics. Another challenge is the constant need to monitor and update models to keep pace with market changes, requiring a blend of technical expertise and market acumen.
The Bottom Line
In this deep dive into quantitative trading in forex, we've uncovered the potency of diverse models, each tailored to navigate the complex currency markets with precision. These strategies, rooted in data-driven analysis, may offer traders an edge in decision-making.
*Important: At FXOpen UK, Cryptocurrency trading via CFDs is only available to our Professional clients. They are not available for trading by Retail clients. To find out more information about how this may affect you, please get in touch with our team.
This article represents the opinion of the Companies operating under the FXOpen brand only. It is not to be construed as an offer, solicitation, or recommendation with respect to products and services provided by the Companies operating under the FXOpen brand, nor is it to be considered financial advice.

Peace Headlines Are Here — But Markets Have Already Moved OnA Russia-Ukraine peace deal making headlines right now is historic news — politically and emotionally.
But for the forex and commodities markets?
The real money already left this story behind months ago.
🧠 Smart Money Knows: Markets Price in the Future, Not the Past
Two years ago, the war sent shockwaves through oil, gas, wheat, and risk currencies.
By late 2023, price action had already normalized — the "war premium" faded out quietly.
Commodities stabilized. Forex volatility shifted. Safe havens lost their edge.
Traders adapted, recalibrated, and moved on to new battlegrounds.
Bottom Line:
The market already priced in a future where this conflict would eventually fade — peace or no peace.
📊 What Actually Drives Forex Now
While peace headlines grab attention, the real macro drivers today are:
🔥 Tariff escalation and global trade wars
🔥 Sticky inflation battles (core services inflation still high)
🔥 Central bank pivot games (Fed, ECB, BoJ)
🔥 Global growth fears (China slowdown, EU stagnation)
This is where new money is flowing.
Not into a two-year-old headline finally catching up.
🛡️ "Buy the Rumor, Sell the Fact" in Action
For two years, markets have priced in an eventual end (or fade) to the Ukraine conflict.
A peace agreement now?
→ It confirms expectations, not shocks them.
→ It may trigger a short-lived risk-on pop (EUR, AUD, NZD up, gold down) —
→ But unless it unleashes massive new money flows (unlikely), that pop gets sold.
🔥 Final Thought:
If you're still trading the last war, you're already late.
The next major moves won't come from peace headlines — they'll come from tariff escalations, inflation battles, and central bank pivots.
Focus forward.
That's where opportunity lives.
💬 Question for Serious Traders:
Which macro theme are you really watching into summer 2025?
Peace headlines... or the new fires already burning?
Drop your insights below. 👇

9 Simple Ratios Every Great Investor Uses - Buffett Included!Forget the hype, headlines, or hope. These 9 financial ratios are what real investors actually use to pick winners, but...
P/E? ROE? EPS? 🧐
- What are they, or better yet, WHO are they? 🤯
- How high is “too high”?
- Is a low number always good, or just a trap?
- Do all industries follow the same rules… or is that another myth?
Buffett. Greenblatt. Graham. Lynch.
They didn’t rely on vibes — they trusted fundamentals
After years of relying on charts, I built a 9-point fundamentals checklist to filter stocks faster and smarter. Now I’m sharing it with real-life examples and key insights to help you spot what really makes a stock worth owning:
Easy enough for new investors diving into fundamentals
Sharp enough to level up seasoned pros
Real enough to avoid hype
…but the truth is: these numbers did flag companies like Amazon, Apple, and Nvidia before the market gave them credit.
-----------------------------------------------------
✅ Quick Reference Table
Scan the table, then dive into the stories…
First Pro Tip: Bookmark this. You’ll check these before every stock pick.
-----------------------------------------------------
📊 1. P/E Ratio | Price-to-Earnings
What it tells you: How much you pay for each dollar of a company’s profit.
Short Example: A P/E of 20 means you pay $20 for $1 of profit. High P/E? Expect big growth or risk overpaying.
Strong: Between 15 and 25
Caution: Above 30 (unless fast growth)
Industry Averages:
- Tech: 25–40
- Utilities: 10–15
- Consumer Staples: 15–20
- Energy: 10–20
- Healthcare: 20–30
Story: In early 2023, NVIDIA’s P/E ratio hovered around 25, near the low end for tech stocks. Investors who saw this as a steal amid the AI boom were rewarded—NVIDIA’s stock made 4x by the end of 2024 as AI chip demand soared.
Contrast that with Tesla in Q1 2025, when its P/E spiked above 40 with slowing sales and Tesla’s stock dropped 50% in weeks.
Pro tip: A low P/E is not always good. If growth is weak or falling, it's often a trap.
Example: A utility company with a P/E of 30 is probably overpriced. A tech stock with 35 might still be fair — if growth justifies it.
-----------------------------------------------------
🧠 2. PEG Ratio | Price-to-Earnings-to-Growth
What it tells you: If a high P/E is worth it based on future profit growth. Whether the earnings growth justifies the price.
Short Example: A PEG below 1 means you’re getting growth at a fair price. High PEG? You’re overpaying.
Strong: Below 1
Caution: Above 2
Industry Averages:
- Software: below 1.5 is solid
- Consumer Goods: Below 2 is more realistic
- Tech: Below 1
- Consumer Staples: Below 1.5
- Healthcare: Below 1.2
- Financials: Below 1.5
- Energy: Below 1.3
Story: In mid-2022, Salesforce’s PEG was 0.8 (P/E 35, forward EPS growth 45%) as cloud demand surged. Investors who spotted this steal saw the stock climb 130% by the end of 2024. Meanwhile, Peloton in 2023 had a P/E of 20 but near-zero growth (PEG above 3). Its stock cratered -50% as fitness trends faded.
Story: NVIDIA’s PEG hit 0.9 in Q3 2023 (P/E 30, growth 35%) during AI hype, a steal for tech (average PEG below 1.2).
PEG filters hype. A stock can look expensive until you factor in growth.
-----------------------------------------------------
🧱 3. P/B Ratio | Price-to-Book
What it tells you: How much you pay compared to what the company owns (like buildings or cash).
Short Example: A P/B below 1.5 means you’re paying close to the company’s asset value. High P/B? Expect strong profits or risk.
Strong: Below 1.5
Caution: Below 1 + poor earnings = value trap
Industry Averages:
- Banks: Below 1.5
- Insurance: Below 1.3
- REITs: Use NAV (aim below 1.2)
- Tech: Often ignored
- Energy: Below 2
Story: In 2024, JPMorgan Chase’s P/B was 1.4, solid for banks (average below 1.5). Investors who bought enjoyed 100% gains.
n 2023, Bed Bath & Beyond’s P/B fell below 1 with collapsing earnings. It looked cheap but filed for bankruptcy that year.
Tip: Only use this in asset-heavy sectors like banking or real estate.
-----------------------------------------------------
⚙️ 4. ROE | Return on Equity
What it tells you: How well a company turns investor money into profits.
Short Example: An ROE above 15% means the company makes good money from your investment. Low ROE? Weak returns.
Strong: Above 15%
Caution: Below 10% unless in slow-growth industries
Industry Averages:
- Tech: 20–30%
- Consumer Staples: 15–25%
- Utilities: 8–12%
- Financials: 10–15%
- Healthcare: 15–20%
Story: Coca-Cola (KO) has kept ROE above 35% for years, a sign of brand power and pricing strength.
Eli Lilly’s (LLY) ROE stayed above 25% from 2022–2024, a healthcare leader (average 15–20%). Its weight-loss drug Mounjaro drove consistent profits, lifting the stock 150%+ in two years. Checking ROE trends helped investors spot this winner.
Tip: If ROE is high but D/E is also high, be careful, it might just be leverage.
-----------------------------------------------------
💰 5. Net Margin | Profitability
What it tells you: How much profit a company keeps from its sales or what % of revenue ends up as pure profit.
Short Example: A 10% margin means $10 profit per $100 in sales. Low margin? Tough business or high costs.
Strong: Above 10-15%+
Caution: Below 5%
Industry Averages:
- Software: 20–30%
- Retail: 2–5%
- Manufacturing: 8–12%
- Consumer Staples: 10–15%
- Energy: 5–10%
- Healthcare: 8–15%
Story: Walmart’s (WMT) 2% net margin looks tiny — but it’s expected in retail.
A software firm with 5%? That’s a warning — high costs or weak pricing.
In 2023, Zoom’s (ZM) net margin fell to 5% (down from 25% in 2021), well below software’s 20–30% average. Pricing pressure and competition crushed its stock quite a lot. Meanwhile, Apple’s 25% margin in 2024 (tech average 20%) remained a cash cow.
Tip: Margins show whether the company owns its pricing or competes on price.
-----------------------------------------------------
💣 6. D/E Ratio | Debt-to-Equity
What it tells you: How much debt a company uses compared to investor money.
Short Example: A D/E below 1 means more investor cash than debt. High D/E? Risky if profits dip.
Strong: Below 1
Caution: Above 2 (except REITs or utilities)
Industry Averages:
- Tech: 0–0.5
- Industrials: 0.5–1.5
- REITs: 1.5–2.5 (manageable due to structure)
- Utilities: 1–2
- Energy: 0.5–1.5
Story: In 2024, Tesla’s D/E dropped below 0.3 (tech average 0–0.5) as it paid down debt, signaling strength despite sales dips - a massive rally afterward.
Tip: Rising debt + falling profits = a storm coming. Always check both.
-----------------------------------------------------
💵 7. Free Cash Flow (FCF)
What it tells you: Cash left after paying for operations and growth investments.
Short Example: Apple’s $100 billion cash pile in 2024 funded stock buybacks, boosting shares. Low cash? Trouble looms.
Strong: Positive and growing
Caution: Negative for multiple years
Sector notes:
- Tech: Lots of cash (think billions)
- Industrials: Up and down, check trends
- REITs: Look at FFO (cash from properties), aim high
- Energy: Has cash, but swings with oil prices
- Healthcare: Steady cash, not too high
Story: Netflix had negative FCF while scaling content. Once costs stabilized, FCF turned positive and stock re-rated sharply.
Pro tip: Profits don’t mean much without real cash. FCF is often more honest.
Cash is king: Companies need cash to pay bills, reduce debt, or fund growth. If FCF is falling, they might be burning through cash reserves or borrowing, which isn’t sustainable.
Potential issues : This mismatch could signal problems like poor cash collection, heavy spending, or even accounting tricks to inflate profits.
-----------------------------------------------------
🚀 8. EPS Growth | Earnings Power
What it tells you: How fast a company’s profits per share are growing.
Short Example: EPS up 10% yearly means more profit per share, lifting stock prices. Flat EPS? No growth, no gains.
Strong: Above 10%
Caution: Below 5%, flat/negative for 3+ years
Industry Averages:
- Tech: 15–30%
- Staples: 5–10%
- REITs: 3–6% (via FFO growth)
- Healthcare: 10–15%
- Financials: 5–10%
- Energy: 5–15% (cyclical)
Story: In Q1 2024, NVIDIA’s forward EPS growth of 30% (tech average 20%+) fueled a rally as AI chips dominated. Checking forward estimates helped investors avoid traps like Intel, with flat EPS and a drop.
Pro tip: A stock with flat EPS and no dividend? There’s no reason to own it.
-----------------------------------------------------
💵 9. Dividend Yield | Passive Income
What it tells you: How much cash you get yearly from dividends per dollar invested.
Short Example: A 3% yield means $3 per $100 invested. High yield? Check if it’s sustainable.
Good: ~3–4%
Red Flag: Above 6% with a payout ratio above 80-90%
Industry Averages:
- Utilities: 3–5%
- REITs: 3–6%
- Consumer Staples: 2–4%
- Tech: 0–2%
- Energy: 2–5%
-----------------------------------------------------
💡 Final Thought: How to Use All of This
Top investors don’t use just one metric. They look at the whole picture:
Good growth? Check PEG.
Good profits? Confirm with ROE and margin.
Safe balance sheet? Look at D/E and cash flow.
Fair valuation? P/E + FCF Yield + P/B.
Real power = Combining metrics.
A company with P/E 15, PEG 0.8, ROE 20%, low debt, and positive FCF? That’s your winner.
A stock with P/E 8, but no growth, high debt, and negative cash flow? That’s a trap.
-----------------------------------------------------
Real-World Combos
🎯Winners:
Tech Gem: P/E 20, PEG 0.8, ROE 25%, D/E 0.4, growing FCF, EPS 20%+ (e.g., NVIDIA 2023: AI-driven growth, stock soared).
Energy Steal: P/E 15, P/B 1.5, FCF positive, Dividend Yield 3.5% (e.g., Chevron 2023: Cash flow king).
⚠️Traps:
Value Trap: P/E 8, flat EPS, D/E 2.5, negative FCF (e.g., Peloton 2023).
Overhyped Tech: P/E 50, PEG 3, Net Margin 5%, D/E 1.5 (e.g., Rivian 2024).
-----------------------------------------------------
🚀 Share your own combos!
What do you personally look for when picking a stock?
If you spotted something off in the numbers, or have a valuable insight to add — please, drop it in the comments.👇
💡 Let’s turn this into a thread that’s not just good but superb and genuinely helpful for everyone.
-----------------------------------------------------
Final Thought
“Buy great companies at fair prices, not fair companies at great prices.” – Warren Buffett
This guide gives you the map.
Charts, tell you when.
These numbers tell you what, and why.
And this post?
It’s just the beginning!
These 9 metrics are part one of a bigger series I’m building — where we’ll go even deeper, with more advanced ratios, smarter combos, and real case studies.
If this guide helped you see financial numbers a little clearer, there’s a good chance it’ll help your investor friend too, especially if they’re just starting their journey...🤝Share it with them!
I built this as much for myself as for anyone else who wants to get better.👊
If you made it this far — thank you! 🙏
...and super thankful if you hit "The Boost" on this post 🚀
Cheers,
Vaido

Why DCA Does Not Work For Short-Term TradersIn this video I go through why DCA (Dollar Cost Averaging) does not work for short-term traders and is more suitable for investors. I go through the pitfalls than come through such techniques, as well as explain how trading should really be approached. Which at it's cost should be based on having a positive edge and using the power of compounding to grow your wealth.
I hope this video was insightful, and gives hope to those trying to make it as a trader. Believe me, it's possible.
- R2F Trading

How to pick a benchmark for you portfolio and beat the market What is a benchmark?
A benchmark is an index or a basket of assets used to evaluate the performance of an investment portfolio In the context of portfolio analysis the benchmark serves as a point of comparison to determine whether a fund a strategy or an investment is performing better worse or in line with the reference market.
In the current chart, Bitcoin ( BINANCE:BTCUSDT ) is displayed with a solid and larger blue line in relation to other cryptocurrencies for the current period.
Benchmarks are essential tools for institutional and private investors as they allow measuring the effectiveness of asset allocation choices and risk management Additionally they help determine the added value of an active manager compared to a passive market replication strategy.
Benchmark analysis example: NASDAQ:TSLA - NASDAQ:NDX
Benchmark analysis example: NASDAQ:TSLA - NASDAQ:AAPL - NASDAQ:NDX
What is the purpose of a benchmark
The use of a benchmark in portfolio analysis has several objectives
1) Performance Evaluation: Provides a parameter to compare the portfolio's return against the market or other funds
2) Risk Analysis: Allows comparing the volatility of the portfolio against that of the benchmark offering a measure of risk management
3) Performance Attribution: Helps distinguish between returns derived from asset selection and those linked to market factors
4) Expectation Management: Supports investors and managers in assessing whether a portfolio is meeting expected return objectives
5) Strategy Control: If a portfolio deviates excessively from the benchmark it may signal the need to review the investment strategy
How to select an appropriate benchmark?
The choice of the correct benchmark depends on several factors:
1) Consistency with Portfolio Objective: The benchmark should reflect the market or sector in which the portfolio operates
2) Representativeness of Portfolio Assets: The benchmark should have a composition similar to that of the portfolio to ensure a fair comparison
3) Transparency and Data Availability: It must be easily accessible and calculated with clear and public methodologies
4) Stability Over Time: A good benchmark should not be subject to frequent modifications to ensure reliable historical comparison
5) Compatible Risk and Return: The benchmark should have a risk and return profile similar to that of the portfolio
Most used benchmarks
There are different benchmarks based on asset type and reference market Here are some of the most common.
Equity
FRED:SP500 Representative index of the 500 largest US companies.
NYSE:MSCI World Includes companies from various developed countries ideal for global strategies
FTSE:FTSEMIB Benchmark for the Italian stock market
NASDAQ:NDX Represents the largest technology and growth companies
Bonds
Barclays Global Aggregate Bond Index Broad benchmark for the global bond market
JP Morgan Emerging Market Bond Index EMBI Benchmark for emerging market debt
[* ]BofA Merrill Lynch US High Yield Index Representative of the high-yield bond market junk bonds
Mixed or Balanced
6040 Portfolio Benchmark 60 equities SP 500 and 40 bonds Bloomberg US Aggregate used to evaluate balanced portfolios
Morningstar Moderate Allocation Index Suitable for moderate-risk investment strategies
Alternative
HFRI Fund Weighted Composite Index Benchmark for hedge funds
Goldman Sachs Commodity Index GSCI Used for commodity-related strategies
Bitcoin Index CoinDesk BPI Benchmark for cryptocurrencies
A reference benchmark is essential in portfolio analysis to measure performance manage risk and evaluate investment strategies The selection of an appropriate benchmark must be consistent with the strategy and market of the portfolio to ensure meaningful comparison.
Understanding and correctly selecting the benchmark allows investors to optimize their decisions and improve long-term results.

A poem of the marketIn the financial markets, the Pin Bar candle is like a poem silently composed within the charts, a poem that tells the tale of the battle between buyers and sellers. This candle, with its long shadow, narrates the story of effort and defeat, as if one side sought to conquer the sky or split the earth, but in the end, was pushed back, leaving only a shadow of its aspirations.
**The Bullish Pin Bar** is like a poet who, in the darkness of night, sees a star and, with hope for light, draws its long shadow toward the earth. It says, "The sellers tried to pull me down, but I, with the light of hope, rose again and conquered the sky."
**The Bearish Pin Bar** is like a poet who, at the peak of day, sees a dark cloud and, with fear of darkness, casts its long shadow toward the sky. It says, "The buyers tried to lift me up, but I, with the force of reality, returned to the ground and embraced the darkness."
The Pin Bar candle, with its small body and long shadow, is like a poem that encapsulates all the emotions of the market in a single moment. This candle, in its simplicity and beauty, reminds us that sometimes efforts do not yield results, and sometimes, turning back is the only way forward. Within this candle lies the story of hope and despair, effort and defeat, light and darkness—a story that repeats itself every day in the financial markets, each time narrated in a new language.
"Taken from artificial intelligence."
