The Art of the Exit: Mastering the "Wise Cut"Hello Friends, Welcom to RK_Chaarts,
Today we are going to understand that what is The Art of the Exit: Why "Cutting Losses" is Your Most Important Skill.
Let’s be real: nobody likes losing money. It stings. But if you’re going to survive in these markets, you have to get comfortable with being wrong.
In trading, a loss is just a business expense. The goal isn’t to avoid them entirely (that’s impossible); the goal is to keep them small enough that they don't take you out of the game.
Here is how to manage your exits without losing your mind—or your account:
1. Your Stop-Loss is Non-Negotiable
Think of a stop-loss as your "insurance policy." You should know exactly where you’re getting out before you ever hit the buy button. By setting a hard exit point, you take the decision-making out of your hands when emotions are running high.
2. Stick to the Script
We’ve all been there: price hits your stop, and you think, "Maybe if I just give it a few more pips, it’ll bounce." Don't do it. That’s how a small, manageable loss turns into a portfolio-killer. Trust your plan, not your gut.
3. Lock in Gains with Trailing Stops
If a trade is moving in your favor, don’t be greedy. Use a trailing stop to follow the price up (or down). This lets you stay in the trend while ensuring that even if the market reverses, you still walk away with a profit.
4. Don't Bet the House
The "Golden Rule" is simple: never risk more than you can afford to lose on a single trade. Most pros only risk 1-2% of their account per setup. This way, even a string of five losses is just a minor setback, not a disaster.
5. Keep an Eye on the Bigger Picture
Markets don't move in a vacuum. High-impact news or economic shifts can wreck a perfectly good technical setup. Stay informed, check the calendar, and be ready to step aside if the environment gets too chaotic.
6. "Hope" is Not a Strategy
Holding onto a losing position and praying for a miracle is the fastest way to blow an account. Cut the dead weight early. There will always be another setup tomorrow. Protect your capital so you can live to trade it.
7. Pay for Your Education
Every time you take a loss, you’ve essentially paid a "tuition fee" to the market. Don't waste it. Review the trade: Did you follow your rules? Was the entry off? Use those mistakes to sharpen your edge for the next one.
The Bottom Line
Trading isn't about being right; it's about math and discipline. If you can keep your losses small and your winners big, the math will eventually work in your favor.
Stop trying to be "right" and start being "profitable."
How do you handle a losing streak? Drop a comment below 👇
I am not Sebi registered analyst.
My studies are for educational purpose only.
Please Consult your financial advisor before trading or investing.
I am not responsible for any kinds of your profits and your losses.
Most investors treat trading as a hobby because they have a full-time job doing something else.
However, If you treat trading like a business, it will pay you like a business.
If you treat like a hobby, hobbies don't pay, they cost you...!
Hope this post is helpful to community
Thanks
RK💕
Disclaimer and Risk Warning.
The analysis and discussion provided on in.tradingview.com is intended for educational purposes only and should not be relied upon for trading decisions. RK_Chaarts is not an investment adviser and the information provided here should not be taken as professional investment advice. Before buying or selling any investments, securities, or precious metals, it is recommended that you conduct your own due diligence. RK_Chaarts does not share in your profits and will not take responsibility for any losses you may incur. So Please Consult your financial advisor before trading or investing.
Beyond Technical Analysis

Earnings Demystified If you are a trader, the chances are you have run into observing an earnings release. And more chances are, you have been like “WTF?!” when the ticker tanked on solid earnings released, or rallied on terrible earnings releases.
And so you’re sitting there being like “what the heck is going on?”, “earnings is a gamble”, “ earnings make no sense ”, etc. etc.
And you wouldn’t be wrong, at least for the most part. Centuries ago, I wrote about the relationship between earnings for META (and because it was literally centuries ago at the time it was called FB) and how the earnings release impact PA.
Since centuries have passed and I now have a whole server (that keeps growing in computational power) dedicated just to market analysis and statistics, I think its time for this idea to be updated slightly. And also, in the process, hopefully demystify earnings and provide traders with a more fundamental understanding of earnings and its nuances.
So, let’s get into it!
The task:
Task AI (or more specifically machine learning algorithms) to look at many different features surrounding earnings and return which features actually improve prediction accuracy (i.e. enhance the algorithms ability to predict successfully) and which do not.
Method:
For this approach I usually like Random Forest, but for simplicity and speed in execution, we will use XG Boost to feature select.
The Sample:
I think we do 10 comparisons to highlight nuances but we will deep dive into maybe 2.
Understanding the lingo:
Because we are using AI and MLA (Machine Learning Algorithms) applying pure statistical concepts, I will clarify the 3 key terms we need to understand in order to make sense of this analysis. The 3 main results we will get are
Gain: is the most critical metric because it measures the direct contribution a feature makes to the model's performance. It calculates how much the "error" or "uncertainty" in the model drops every time this feature is used to make a decision. The higher the gain, you can visualize it as the more important and higher the prediction confidence.
Cover: measures the breadth of a feature, specifically how many observations (samples) are affected by a specific rule. If a feature has high cover, it means the model is using it to make decisions for a large portion of the dataset, rather than just a few niche cases.
Frequency: (also called Weight) simply counts how many times a feature appears in all the trees the model built. While it sounds important, a feature can have high frequency just because it’s a "busybody" (like RSI, which has many levels to check) without actually providing much "Gain" or "Cover."
The Features:
For this analysis, I chose to include:
Previous day returns leading into earnings,
RSI
MFI
Previous Day Volume,
14-Day Trend Information,
EPS Estimate,
Actual EPS,
Surprise EPS,
Previous Actual EPS from the last quarter Release,
Seasonality
The Analysis
Let’s start with the ticker in which this idea is being posted, $NFLX.
NFLX
Significance:
As you can see, the model knowing that its Q1 improves its ability to predict exponentially. The 100% you see means Q1 is a substantial quarter for NFLX. However, you will notice there is no mention of other quarters. That means, the seasonality effect dissipates after Q1 and seasonality no longer becomes predictive of NFLX earnings in the other quarters.
The most interesting thing for NFLX is looking at the General features. Here, you will see that the actual EPS release is the LEAST important feature, all the way at the bottom of the list, offering only 0.3% gain to the model. This is incredible! It means that the actual EPS is, essentially, useless in predicting the investors response to the earnings release.
This alone is the EURKA! Moment that we should all have. Remember those tickers tanking on solid earnings? Well, now you know.
The next observations one would need to look closely at is that NFLX is a highly momentum driven stock. If you look at the top features, you will see a lot of momentum based metrics added the most value for the models predictions, including the 14 day trend (Trend_cor), the RSI, MFI, previous day volume, previous day returns, etc. These are the metrics providing the model with the most predictive power. These are also mostly momentum based metrics, devoid of really anything fundamental about earnings.
An example of Q1 earnings for NFLX:
This was January 2024. The surprise was a whopping -4.81%. Yes, NFLX under-delivered by over 4% and it still rallied > 10%.
Next Up, NYSE:MMM
MMM returned all NULLs on Seasonal metrics. Meaning, there is no significant seasonality impact on MMM’s earnings.
Jumping to the general table, we can see that MMM is mostly fundamentally driven. For MMM, their earnings and performance matter, unlike NFLX which is all about trend, momentum and most likely characteristic of meme traders. MMM, on the other hand, is about solid performance and growth.
Why do I say this? Well look at the General table. The top 3 metrics are all fundamental, based on the actual earnings release and all add >= 10% gain to the model, meaning that the models accuracy is improving by >= 10% based on these metrics alone.
We can see a little bit of trend following, with the 14 day trend accounting for feature 4. This can still be fundamentally driven in the sense that investors may be anticipating good releases and buying into the release. However, the model is not capable of making that determination, so its mostly conjecture from me.
Let’s take a look at an example:
Here, MMM delivered a surprise of 5.59% and ended up rallying 7.66%, indicating the direct link between actual earnings and response.
Next NASDAQ:META
I think its fair to go back to META, since this was the ticker that was my first ever ticker of interest for analysis of earnings and price action! So let’s check the results.
Interestingly, seasonality means nothing to NASDAQ:META which is interesting.
And even more interestingly, META, which I assumed would be full of memers, is actually very fundamentally driven. If you look at the top features, one can see that actual fundamental aspects of META ‘s earnings are driving its response, most notably its estimate, its surprise and interestingly the previous investors response to the last earnings release.
However, for META, this is very visible in the historical responses. Take a look at this example:
Here, META delivered a whopping surprise of -84%. Yes, NEGATIVE 84%. This caused it to tumble >11%, highlighting the importance of META’s earning’s estimates and actual EPS releases.
Let’s take a look at 2 actual MEME stocks, legendary ones:
Seasonality has no effect here as well, but what is incredibly interesting is that these memers are mostly driven by momentum and speculation. And what makes me say that? Its because if you look at the feature importance, you will see the top drivers are PREVIOUS response to earnings and momentum metrics.
To put it into context of trading psychology, this is what this feature profile could translate to in an investors/trader’s mind:
“ The stock is trending up, the last earnings release was bullish, so I am going to long it” .
This statement embodies the feature selection of this ticker perfectly!
Math meets Psychology, don’t you love it?!
Before we tie this analysis/idea off, let’s look at 1 more modern/new meme stock, AKA NASDAQ:RKLB and one historic behemoth, $MSFT.
First up, RKLB:
No seasonality here. Just pure momentum with a dash of speculation we saw with GME and AMC. However, the major driver is momentum here.
I want to highlight this because this is another “retail fingerprint” you can see when you breakdown ticker anatomy. Here you can see “We are trending X (up/down), last earnings release was Y, so I am going to Z (long/short)”.
This is a very interesting nuance I have discovered in meme / retail stocks and I find it absolutely fascinating as the math really embodies human psychology!
And last but definitely not least we have that behemoth of a money maker, NASDAQ:MSFT
Again, seasonality is a no go. But we can also see something interesting.
What is it, you ask?
Well, despite MSFT’s long standing, old status of being an ancient but modern and adaptive tech giant, it still succumbs to some momentum based plays. In fact, looking at MSFT, the model prefers momentum based metrics over more fundamental based metrics.
This is another thing I find just absolutely fascinating. How can we understand trader psychology here? Actually, it is pretty easy!
“ MSFT is trending. It’s a long standing company that can’t fail. I am bullish ”.
BOOM.
Done.
Conclusion
I have went over and attempted to demystify earnings and explain the nuances of a few specific tickers. But I think it’s important to understand, what are the key take aways here? I mentioned in some of these analysis “trader psychology”. At the end of the day, if you look at these metrics that the model has found that indicate importance, it tells you a lot about the psychology that goes into earnings releases and that, for the most part, earnings are less about math and eps and more about investor psychology.
Each ticker is unique. While some important metrics tend to overlap, at the end of the day, each ticker has its own unique composition that drives its response to earnings. And these drivers likely play into the psychology of the particular group of investors/traders trading that particular equity into the release.
I hope you found this helpful and informative!
As always, leave your questions/comments below and safe trades!
If you are interesting in the centuries old post about META (former FB) earnings and Price Action, check it out here.
If you want my indicator that assesses earnings seasonality and creates EPS profile of earnings response, check it out here.

Behavioral Biases: Why Most Traders Make the Same MistakesHello, traders! 😎
Crypto markets may look chaotic, but they are driven by a single force: human psychology — the core of trading psychology. Every pump and dump is fueled by cognitive biases, fear and greed, and distorted decision-making under uncertainty, which is exactly why most traders end up repeating the same costly mistakes.
Fear-Driven Herding in a Sideways Market
Since late 2025, Bitcoin has spent months grinding sideways between roughly $80K and $97K, frustrating trend followers and wearing down traders who were betting on a clean breakout to new highs. Retail traders who bought panic dips often ended up selling into relief rallies — a textbook fear-and-greed cycle — while more seasoned players quietly rotated into BTC as a relative safe haven amid rising macro stress.
This wasn’t random price action; it was market psychology on full display . Those caught on the wrong side struggled to stay disciplined, letting emotion override their plans, chasing tops and dumping into support instead of executing a strategy.
Overconfidence and Risk Neglect Bias
Throughout 2025, futures markets were pushed to historic leverage extremes, only to be repeatedly wiped out by relentless volatility. Retail traders running 50× or even 100× got steamrolled when minor pullbacks triggered cascading liquidations. It was a brutal display of cognitive bias — especially overconfidence and optimism — as traders underestimated risk while wildly overestimating their edge, often blowing up their accounts in the process.
Hype-Driven Narrative Bias
The 2025–26 cycle has been littered with fiascos like the sudden collapse of “NYC Token” after its high-profile launch, wiping out speculative holders almost overnight. It wasn’t just a fundamental failure — it was a textbook case of behavioral finance bias: herd chasing and narrative addiction , where traders bought the story and ignored the absence of real underlying value.
Smart Money Anchoring Bias
From mid-2025 into 2026, institutional demand — driven largely by Bitcoin and altcoin ETFs — became one of the dominant forces shaping market structure. Record XRP ETF inflows pulled sidelined capital back into risk assets, pushing momentum traders to chase relief rallies without any real risk framework.
The irony is that professional money doesn’t chase highs the way retail does — but retail trader psychology tends to shadow institutional headlines, magnifying every move. Once ETF flows hit the mainstream narrative, FOMO breeds crowded positioning , turning yet another behavioral bias into a market-moving force.
News-Driven Anchoring Bias
Every macro headline — inflation prints, regulatory noise, or the latest Senate drama — becomes fuel for biased interpretation, amplified by emotions in trading and flawed decision making under uncertainty. Anchoring bias makes traders cling to whatever narrative they heard last: “Bitcoin is a safe haven” one week, “crypto is collapsing” the next.
When markets stop trending cleanly, traders swing between these extremes instead of relying on probability, structure, and risk management .
This macro-crypto feedback loop exposes how psychology drives risk appetite in often contradictory ways. Patterns keep repeating because people repeat the same mental errors — chasing price, overleveraging, anchoring to headlines, and letting emotion overrule strategy. Understanding that behavior is a far more powerful edge than any indicator.
This material is for informational purposes only and does not constitute trading or investment advice.

How to Use the Pivot Zones Indicator by StewdamusA brief walk-through on how I use my AI crafted "Pivot Zones" indicator to trade. I will be sampling Google on the daily here with the chart replay.

Finding Edge Where Others Aren't Looking
The Best Traders Aren't Just Looking at Charts Anymore
While most traders stare at the same charts, indicators, and news feeds...
A new breed of traders is counting cars in parking lots from space, tracking shipping containers across oceans, and analyzing millions of social media posts.
This is alternative data - and it's changing who has the edge.
What Is Alternative Data?
Definition:
Alternative data is any data used for investment decisions that isn't traditional financial data (price, volume, earnings, etc.).
Traditional Data:
Price and volume
Financial statements
Earnings reports
Economic indicators
Analyst ratings
Alternative Data:
Satellite imagery
Social media sentiment
Web traffic and app usage
Credit card transactions
Geolocation data
Weather patterns
Job postings
Patent filings
And much more...
Types of Alternative Data
1. Satellite and Geospatial Data
What It Tracks:
Retail parking lot traffic
Oil storage tank levels
Crop health and yields
Shipping and logistics
Construction activity
Example:
Count cars in Walmart parking lots before earnings.
More cars = more sales = potential earnings beat.
Edge: Information before it appears in financial reports.
2. Social Media and Sentiment Data
What It Tracks:
Brand mentions and sentiment
Product buzz
Consumer complaints
Viral trends
Influencer activity
Example:
Track sentiment around a new product launch.
Negative sentiment spike = potential sales disappointment.
Edge: Real-time consumer reaction before sales data.
3. Web Traffic and App Data
What It Tracks:
Website visits
App downloads and usage
Search trends
E-commerce activity
User engagement
Example:
Track app downloads for a gaming company.
Declining downloads = potential revenue miss.
Edge: Usage data before quarterly reports.
4. Transaction Data
What It Tracks:
Credit card spending
Point-of-sale data
E-commerce transactions
Consumer behavior patterns
Example:
Aggregate credit card data shows spending at restaurants declining.
Restaurant stocks may underperform.
Edge: Spending patterns before earnings.
5. Employment and Job Data
What It Tracks:
Job postings
Hiring trends
Layoff announcements
Glassdoor reviews
LinkedIn activity
Example:
Company suddenly posts many engineering jobs.
Could indicate new product development.
Edge: Corporate strategy signals before announcements.
6. Supply Chain Data
What It Tracks:
Shipping container movements
Port activity
Supplier relationships
Inventory levels
Logistics patterns
Example:
Track shipping from key suppliers to Apple.
Increased shipments before product launch = strong demand.
Edge: Supply chain signals before sales data.
How AI Processes Alternative Data
Challenge:
Alternative data is:
Massive in volume
Unstructured (images, text, etc.)
Noisy
Requires specialized processing
AI Solutions:
1. Computer Vision
Analyzes satellite imagery
Counts objects (cars, ships, tanks)
Detects changes over time
2. Natural Language Processing
Processes social media text
Extracts sentiment
Identifies trends and topics
3. Machine Learning
Finds patterns in transaction data
Predicts outcomes from alternative signals
Combines multiple data sources
4. Time Series Analysis
Tracks changes over time
Identifies anomalies
Forecasts future values
Alternative Data in Practice
Case Study 1: Retail Earnings
Satellite data shows parking lot traffic up 15% vs last year
Social sentiment for brand is positive
Web traffic to e-commerce site increasing
Prediction: Earnings beat
Result: Stock rises on earnings
Case Study 2: Oil Prices
Satellite shows oil storage tanks filling up
Shipping data shows tankers waiting to unload
Prediction: Supply glut, prices may fall
Result: Oil prices decline
Case Study 3: Tech Company
App download data shows declining engagement
Job postings show layoffs in key division
Social sentiment turning negative
Prediction: Guidance cut coming
Result: Stock falls on earnings
Alternative Data Challenges
Cost - Quality alternative data is expensive. Satellite data: $10,000-$100,000+/year. Transaction data: $50,000-$500,000+/year. Not accessible to most retail traders.
Signal vs Noise - Most alternative data is noise. Requires sophisticated processing. Easy to find false patterns. Overfitting risk is high.
Alpha Decay - As more traders use the same data, edge disappears. Popular datasets become crowded. Unique data sources are key.
Legal and Ethical Issues - Some data collection is questionable. Privacy concerns. Data sourcing legality. Regulatory scrutiny increasing.
Integration Complexity - Combining alternative data with trading is hard. Different formats and frequencies. Requires specialized infrastructure.
Alternative Data for Retail Traders
Accessible Options:
1. Social Sentiment Tools
Free or low-cost sentiment indicators
Twitter/X trending analysis
Reddit sentiment trackers
2. Google Trends
Free search trend data
Track interest in products/companies
Identify emerging trends
3. Web Traffic Estimators
SimilarWeb, Alexa (limited free tiers)
Estimate website traffic
Compare competitors
4. App Store Data
App Annie, Sensor Tower (limited free)
Track app rankings and downloads
Monitor mobile trends
5. Job Posting Aggregators
Indeed, LinkedIn trends
Track hiring patterns
Identify company direction
Building an Alternative Data Framework
Step 1: Identify Your Edge
What information would give you an advantage?
What do you trade?
What drives those assets?
What data could predict those drivers?
Step 2: Find Data Sources
Free sources first (Google Trends, social media)
Low-cost aggregators
Premium sources if justified
Step 3: Process and Analyze
Clean and structure the data
Look for correlations with price
Backtest any signals
Step 4: Integrate with Trading
How will you use the signal?
What's the trading rule?
How do you size positions?
Step 5: Monitor and Adapt
Track signal performance
Watch for alpha decay
Continuously improve
Key Takeaways
Alternative data provides information before it appears in traditional sources
Types include satellite imagery, social sentiment, web traffic, transactions, and more
AI is essential for processing unstructured alternative data at scale
Challenges include cost, noise, alpha decay, and integration complexity
Retail traders can access some alternative data through free or low-cost tools
Your Turn
Have you used any alternative data sources in your trading?
What unconventional information do you think could provide edge?
Share your thoughts below 👇

How to Sit through Drawdown on GBPUSD (Part 1)Most traders don’t fail because they lack strategy.
They fail because they never slow down long enough to master one market.
In this video, I’m starting the only series I’m running in 2026: Mastering GBPUSD.
This is not about indicators or hype. It’s about rebuilding consistency by focusing on one pair, learning its rhythm, managing drawdown, and developing the discipline most traders avoid.
We cover
• Why mastering GBPUSD starts with a decision, not a strategy
• How to build trust in a market before increasing position size
• How to sit through normal drawdown without sabotaging your plan
• Practical ways to observe price, mark levels, and reduce overtrading
• Why alerts and walking away matter more than staring at charts
If you’ve traded before, had success, lost momentum, and you’re looking to get back into rhythm, this video is for you.
This series is about focus, patience, and self-mastery through one market.
Watch. Apply. Repeat.
Comment “GBPUSD only” if you’re committing to this journey, and subscribe so you don’t miss the next deep dive in the series.

How to Build Trust With GBPUSD Before You Ever Place SizeMost traders don’t fail because they lack strategy.
They fail because they never slow down long enough to master one market.
In this video, I’m starting the only series I’m running in 2026: Mastering GBPUSD.
This is not about indicators or hype. It’s about rebuilding consistency by focusing on one pair, learning its rhythm, managing drawdown, and developing the discipline most traders avoid.
We cover
• Why mastering GBPUSD starts with a decision, not a strategy
• How to build trust in a market before increasing position size
• How to sit through normal drawdown without sabotaging your plan
• Practical ways to observe price, mark levels, and reduce overtrading
• Why alerts and walking away matter more than staring at charts
If you’ve traded before, had success, lost momentum, and you’re looking to get back into rhythm, this video is for you.
This series is about focus, patience, and self-mastery through one market.
Watch. Apply. Repeat.
Comment “GBPUSD only” if you’re committing to this journey, and subscribe so you don’t miss the next deep dive in the series.

GBPUSD PSYCHOLOGY: Profitability is a Decision, Not a StrategyMost traders don’t fail because they lack strategy.
They fail because they never slow down long enough to master one market.
In this video, I’m starting the only series I’m running in 2026: Mastering GBPUSD.
This is not about indicators or hype. It’s about rebuilding consistency by focusing on one pair, learning its rhythm, managing drawdown, and developing the discipline most traders avoid.
We cover
• Why mastering GBPUSD starts with a decision, not a strategy
• How to build trust in a market before increasing position size
• How to sit through normal drawdown without sabotaging your plan
• Practical ways to observe price, mark levels, and reduce overtrading
• Why alerts and walking away matter more than staring at charts
If you’ve traded before, had success, lost momentum, and you’re looking to get back into rhythm, this video is for you.
This series is about focus, patience, and self-mastery through one market.
Watch. Apply. Repeat.
Comment “GBPUSD only” if you’re committing to this journey, and subscribe so you don’t miss the next deep dive in the series.

Detachment Is a Skill, Not a FeelingDetachment Is a Skill, Not a Feeling
“Detachment isn’t about not caring.
It’s about not clinging.”
Many traders misunderstand detachment.
They think it means being cold.
Emotionless.
Disconnected.
That misunderstanding keeps them stuck.
True detachment is not the absence of emotion.
It is the presence of clarity.
Why Traders Struggle With Detachment
Attachment forms quietly.
To:
• A bias
• A winning streak
• A well-researched idea
• A trade that “should work”
The more effort you put into an analysis,
the harder it becomes to let go.
You don’t want to be wrong.
So you stop listening.
Engagement vs Attachment
Engagement is healthy.
Attachment is dangerous.
Engagement means you observe price closely.
Attachment means you defend your opinion.
Engagement adapts.
Attachment insists.
Professionals stay engaged.
Amateurs get attached.
What Attachment Does to Trading
• You ignore early warning signs
• You delay exits
• You justify holding longer
• You confuse hope with patience
• You feel personally affected by outcomes
The trade becomes about you,
not about price.
What Detachment Actually Looks Like
Detachment means:
• You accept invalidation quickly
• You respect structure changes
• You exit without emotional negotiation
• You treat each trade independently
• You care about execution, not outcome
You’re still focused.
You’re just not entangled.
How to Train Detachment
• Define invalidation before entry
• Journal emotional reactions, not just results
• Reduce position size to reduce attachment
• Pause after wins and losses
• Ask: “What is price telling me now?”
Detachment is not a personality trait.
It’s a practiced skill.
📘 Shared by @ChartIsMirror
Where do you feel the strongest attachment — entries, exits, or bias?
Comment honestly. Awareness begins there.

Trading Center: The Dashboard That Changes EverythingStop Drowning in Data. Start Seeing What Matters.
Most traders have 47 browser tabs open, three charting platforms running, and still miss important information.
The problem isn't lack of data. It's lack of organization.
A well-designed trading dashboard transforms chaos into clarity — showing you exactly what you need, when you need it.
Why You Need a Dashboard
The Problem:
Information scattered across platforms
Important data buried in noise
Constant tab-switching and distraction
Missing signals while looking elsewhere
Decision fatigue from information overload
The Solution:
A centralized dashboard that:
Shows key metrics at a glance
Alerts you to important changes
Reduces cognitive load
Keeps you focused on what matters
Dashboard Components
1. Market Overview Panel
What to Include:
Major indices (SPY, QQQ, IWM)
Key sectors
VIX/volatility
Market breadth
Futures if relevant
Purpose:
Understand overall market context before any trade.
2. Watchlist Panel
What to Include:
Your active watchlist
Current price and change
Key levels (support/resistance)
Volume vs average
Alerts status
Purpose:
Track potential opportunities without switching screens.
3. Open Positions Panel
What to Include:
All current positions
Entry price and current price
P&L ($ and %)
Stop loss and target levels
Time in trade
Purpose:
Monitor all positions at a glance.
4. Risk Dashboard
What to Include:
Total portfolio exposure
Open risk ($ at risk)
Daily P&L
Drawdown from peak
Correlation warnings
Purpose:
Never lose track of your risk.
5. Economic Calendar
What to Include:
Upcoming economic events
Earnings dates for watchlist
Fed meetings
Major news events
Purpose:
Avoid being surprised by scheduled events.
6. Performance Metrics
What to Include:
Win rate (recent and overall)
Average R-multiple
Profit factor
Current streak
Monthly P&L
Purpose:
Track performance without opening spreadsheets.
7. Alerts and Notifications
What to Include:
Price alerts
Indicator alerts
News alerts
Risk threshold warnings
Purpose:
Get notified of important events without constant monitoring.
Dashboard Design Principles
Principle 1: Hierarchy of Information
Most important information should be most visible.
Critical data: Large, prominent
Supporting data: Smaller, secondary
Reference data: Available but not distracting
Principle 2: Reduce Noise
Only include what you actually use.
If you haven't looked at it in a week, remove it
Every element should serve a purpose
White space is valuable
Principle 3: Consistent Layout
Same information in same place every time.
Build muscle memory
Reduce search time
Faster decision making
Principle 4: Color Coding
Use color meaningfully.
Green: Positive/bullish
Red: Negative/bearish
Yellow: Warning/attention
Neutral: Normal state
Principle 5: Real-Time Where Needed
Not everything needs to update every second.
Price data: Real-time
Performance metrics: Daily update fine
Economic calendar: Daily update fine
AI-Enhanced Dashboards
1. Smart Alerts
AI filters alerts to show only significant ones:
Unusual volume
Pattern completions
Correlation changes
Risk threshold approaches
2. Anomaly Detection
AI highlights unusual conditions:
Abnormal price movements
Unusual options activity
Sentiment shifts
Correlation breakdowns
3. Predictive Insights
AI provides forward-looking information:
Expected volatility
Probability of hitting targets
Risk scenario analysis
4. Personalized Recommendations
AI suggests based on your patterns:
Best times to trade
Setups matching your edge
Risk adjustments needed
Building Your Dashboard
Option 1: TradingView Layout
Multiple chart layout
Watchlists
Alerts
Limited customization but integrated
Option 2: Spreadsheet Dashboard
Google Sheets or Excel
Pull data via APIs or manual
Highly customizable
Requires maintenance
Option 3: Dedicated Dashboard Tools
Notion, Airtable
Trading-specific tools
More features, learning curve
Option 4: Custom Build
Python + visualization libraries
Maximum flexibility
Requires coding skills
Dashboard Checklist
Before Market Open:
Check market overview (futures, indices)
Review economic calendar
Check open positions
Review watchlist for setups
Verify alerts are set
During Trading:
Monitor open positions
Track risk exposure
Watch for alerts
Note market context changes
After Market Close:
Review daily P&L
Update performance metrics
Adjust watchlist
Set alerts for tomorrow
Dashboard Mistakes
Too Much Information — Cramming everything onto one screen. Only include what you actually use daily.
No Hierarchy — Everything same size and prominence. Make critical information stand out.
Inconsistent Layout — Moving things around constantly. Set a layout and stick with it.
Ignoring Mobile — No way to check when away from desk. Have a simplified mobile version.
Not Updating — Dashboard becomes stale and ignored. Regular review and refinement.
Sample Dashboard Layout
Top Row: MARKET OVERVIEW — SPY, QQQ, IWM, VIX at a glance
Left Column: WATCHLIST — Your opportunities with price, change, key levels
Center: OPEN POSITIONS — All positions with P&L, stops, targets
Right Column: RISK DASHBOARD — Exposure, open risk, drawdown
Bottom Left: ALERTS — Price alerts, indicator alerts, warnings
Bottom Right: CALENDAR — Today's events, upcoming earnings
Key Takeaways
A dashboard transforms scattered information into organized clarity
Include only what you actually use — less is more
Design with hierarchy — critical information most prominent
Consistency builds speed — same layout every day
Regular refinement keeps the dashboard useful
Your Turn
What does your current trading setup look like?
What information do you wish you could see at a glance?
Share your dashboard ideas below 👇

One small loser and a lot of patient waiting. This recording is a look at what it takes to be a professional trader. I took a fake out short and got stopped for a small loss. Spent the rest of the session waiting for a good setup, including NOT jumping on many fake break outs.
Successful trading is about patience and discipline. Have a plan and follow it. Wait for confirmation. Always use a stop loss. Have a plan for how you will manage your trade once you've entered.

GBPUSD: Mastering One Pair Teaches Swing Trading PerfectlyMost traders don’t fail because they lack strategy
They fail because they lack discipline
In this video, we break down the psychology of trading a single pair and why mastering GBPUSD is one of the fastest ways to build consistency, confidence, and emotional control in the markets.
This isn’t about indicators or chasing setups
It’s about learning one market deeply enough to trust your decisions
Hold trades through drawdown
Stick to a plan
And stop sabotaging yourself with overtrading and noise
We cover
Why focusing on one pair sharpens discipline
How mastering GBPUSD improves risk management and execution
The mental edge that comes from knowing a market inside and out
How to hold trades during drawdown without breaking your rules
If you’re getting back into trading or rebuilding consistency
This video is for you
CTA
Drop a comment with the pair you’re committing to mastering
Subscribe for practical trading psychology and execution-based lessons
And if this resonates share it with a trader who needs to hear it

How To Make Macroeconomics Work For YouIntroduction
Trading around news releases is a powerful tool in financial markets.
The ability to identify the direction of the economy and understand market behavior is a skill that requires patience and extensive practice. In this post, we break down the theory behind trading macroeconomic releases and systematically explain how to form a structured view of the market.
Actual vs. Consensus
In almost any economic calendar, you will see a consensus / forecast column. To properly understand released macroeconomic data, it is not enough to simply look at the headline number. The key to interpretation lies in comparing the actual result with the consensus forecast.
This deviation — often referred to as a “surprise” — is the primary driver of volatility in financial markets.
The reason is that the market is a forward-discounting machine. By the time a report is released, asset prices already reflect the prevailing consensus expectations. The market has priced in a specific scenario. When the actual data comes in above or below those expectations, an immediate repricing occurs — the market reassesses future growth, inflation, and central bank policy paths, adjusting prices to reflect the new information.
Therefore, at the moment of the release, the market is not reacting to the number itself, but rather correcting a previously held — and potentially incorrect — expectation. It is this collective and instantaneous adjustment that creates the surge in volatility we observe around economic data releases.
Trend
Trend is the alpha and omega of analysis — the foundation upon which most trading systems are built. This principle fully applies to macroeconomics as well: to correctly interpret a single data release, one must clearly understand the trend in which the economy, or a specific sector, currently operates.
Yes, a trend on its own rarely generates the same explosive volatility as an unexpected deviation from consensus. However, its role is far more fundamental: the trend is what shapes the consensus itself. The dynamics of previous months define the baseline for analysts’ forecasts and market expectations.
Without accounting for the trend, an individual macro indicator becomes just a number in a vacuum. It may point to completely opposite scenarios depending on interpretation. Data must be evaluated in context and over time. A sector may be performing below its long-term averages, but consistent improvement over recent quarters can be a clear signal that central bank policy is having a positive effect. Conversely, a peak reading within a broader downtrend is far more likely to be a statistical anomaly than a genuine turning point.
Historical data serves as a compass for central banks. By understanding what is “normal” for a given sector, policymakers can interpret readings that break away from the trend not as noise, but as structural shifts — a “slowdown in growth” or a “fundamental change in trend.” This is the power of trend analysis: it separates signal from noise, transforming raw data into a coherent picture of the economic cycle.
Context
Accurately understanding the macroeconomic landscape and anticipating market reactions is only possible when data is viewed collectively, not in isolation. Financial markets are complex, interconnected systems, where developments in one sector inevitably ripple through others.
Labor market data directly shape inflation expectations. Central bank decisions and forward guidance impose structural constraints, defining not only the current phase of the cycle but also future conditions across the entire spectrum of assets.
Equally important is the global political and geo-economic backdrop. These forces either introduce a risk premium, increasing volatility, or reduce uncertainty, making outcomes more predictable.
Together, all of this forms the context — the interpretive framework in which numbers exist. Without it, even the most significant deviation from forecast is nothing more than a statistical outlier. Context turns fragmented data into a coherent narrative, allowing us to understand what is truly happening in the economy and where capital is flowing.
The ability to identify this context is the core skill that translates the language of macroeconomic statistics into the language of real market movements.
Federal Reserve Policy
We have reached the key element that determines the development of both individual sectors and the financial market as a whole. Central bank policy is the primary force that sets the rhythm of market movements. Most forecasts and trading strategies ultimately boil down to an attempt to anticipate the regulator’s next steps.
When analyzing a new set of data, the first question we ask is:
what does this mean for the Federal Reserve? What actions will the regulator take to stabilize conditions or support positive momentum?
To do this, the central bank has a set of fine-tuning tools at its disposal. By understanding how each of them works, one can form well-reasoned assumptions about the future direction of financial markets. The central bank’s toolkit includes:
• the policy interest rate
• the interest rate on reserves
• forward guidance
• balance sheet operations
• open market operations
• direct lending facilities
All of these are important, but the central role belongs to the policy rate — the Federal Funds Rate (FFR).
The policy rate is the central bank’s main interest rate. It defines the base cost of money in the financial system and serves as the primary benchmark for all other interest rates in the economy. By adjusting it, the central bank directly influences inflation and economic activity.
Accommodative stance (rate cuts):
The central bank lowers borrowing costs for businesses and households. This expands the money supply and stimulates demand, supporting economic growth, but it also creates inflation risks and may put downward pressure on the national currency.
Restrictive stance (rate hikes):
The central bank makes borrowing more expensive. This cools demand, slows economic activity, and restrains inflationary pressure. In such an environment, the cost of money in the economy rises, often leading to a strengthening of the national currency.
Thus, by monitoring the Fed’s rate decisions, we gain insight not only into the current diagnosis of the economy, but also a clear signal of the environment — accommodative or restrictive — in which all markets will operate in the near future.
Which Data Actually Move the Market?
Having mastered the basic principles of macro analysis, we move on to practice. Now, when looking at an economic calendar, we no longer see just a list of events — we understand their meaning and can anticipate market reactions. To do this, indicators must be grouped by the type of information they provide about the state of the economy.
1. Inflation Indicators
CPI (Consumer Price Index) and especially Core CPI are the primary measures of consumer inflation and directly influence central bank decisions.
2. Labor Market Data
• NFP (Nonfarm Payrolls) and the Unemployment Rate (UR) are key indicators of labor market health.
• AHE (Average Hourly Earnings) reflects wage-driven inflationary pressure.
• JOLTS (Job Openings, Quits) are leading indicators of labor demand and worker confidence.
• Jobless Claims provide a weekly “pulse check” of the labor market.
3. Consumer Demand Indicator
Retail Sales are the main barometer of consumers’ willingness to spend and a key component of GDP.
4. Leading Indicators
PMI (Purchasing Managers’ Index) from ISM and S&P Global is the most important monthly leading indicator, capturing sentiment and the pace of change in the real economy (manufacturing and services).
Beyond these indicators, there are many other important metrics (industrial production, consumer confidence, housing data). However, we focus on the primary market movers — the releases that generate the most volatility and most often reshape the market narrative. Understanding these four categories provides the key to decoding the majority of price movements driven by macroeconomic news.
Inflation Indicators (CPI and Core CPI)
These indices track changes in the cost of living. Imagine a basket that contains everything a typical household buys: food, gasoline, housing costs, clothing, and medical services.
The headline Consumer Price Index looks at this entire basket. However, prices for certain items — such as gasoline or vegetables — can swing sharply due to weather conditions or political decisions. These swings create a lot of noise and make it harder to see the underlying trend.
That is why analysts and central banks focus primarily on core inflation. It is the same index, but with the most volatile components — food and energy — removed. What remains are prices that move more slowly but persistently: rent, childcare, repair services, and healthcare.
If core inflation is rising, it means the foundation of everyday life is becoming more expensive. The cause is usually an overheated economy — when consumers have ample money and are willing to pay more, while businesses face rising costs, often driven by higher wages. This type of inflation is sticky and difficult to contain. That is precisely why central banks react to core inflation when deciding whether to raise interest rates.
If, on the other hand, only headline CPI rises due to a temporary spike in gasoline prices while core inflation remains stable, the central bank is unlikely to tighten policy — such moves are usually seen as transitory.
Labor Market Data (NFP, AHE, JOLTS, Jobless Claims)
The labor market is not a collection of isolated numbers, but a living system where some indicators lay the groundwork for others. To understand it, one must see the sequence and the cause-and-effect relationships.
The first warning signal usually comes from weekly jobless claims. When the number of people filing for unemployment benefits begins to rise consistently, it is a direct signal that companies are laying off workers more frequently. This is the earliest indication that, a few weeks later, the main monthly report may deliver unpleasant surprises: weak job growth or even outright job losses, followed by a rise in the unemployment rate.
However, the strength of the labor market is determined not only by the number of jobs, but also by their quality and the balance of power between employers and workers. This is where the JOLTS report on job openings and labor turnover becomes critical. When job openings are abundant and workers are quitting voluntarily in large numbers, it points to a unique situation: employees are confident enough to switch jobs in search of higher pay. This scenario almost inevitably leads to accelerated wage growth, which later shows up in the Average Hourly Earnings (AHE) data.
Wages are where the strongest link to central bank policy lies. Persistent wage growth acts as a powerful engine for inflation in the services sector. Therefore, when the Fed sees low unemployment combined with steadily rising wages, it has little choice but to keep interest rates high in order to cool the economy. Conversely, when job creation slows and wage growth begins to decelerate, it sends the regulator a long-awaited signal that labor-driven inflationary pressure is easing — opening the door to discussions about policy easing.
By closely monitoring weekly jobless claims and vacancy data, one can anticipate the likely outcome of the key monthly labor report and, with a high degree of confidence, predict how the central bank will react.
Consumer Demand Indicator (Retail Sales)
This is the most direct snapshot of household wallets. The index shows how much money consumers spent during the month on goods — in physical stores, online, at car dealerships, and at gas stations.
Its strength lies in its simplicity. It does not attempt to predict the future or measure sentiment — it simply records whether people are actually spending their money. And since household consumption is the main engine of the U.S. economy, this number is closely watched by everyone.
Retail Sales are highly sensitive to two factors: labor market conditions and Federal Reserve policy.
When jobs are plentiful and wages are rising (strong NFP and AHE), consumers spend with confidence — sales increase.
When the Fed raises rates, borrowing costs (including credit cards) rise, large purchases are postponed, and sales slow or decline.
As a result, Retail Sales often serve as the final confirmation — or refutation — of trends suggested by other data. Persistent growth in sales despite high interest rates tells the Fed that the economy remains too hot and that policy is not restrictive enough. A sudden drop, especially against the backdrop of an already weakening labor market, becomes a powerful argument for a pivot toward policy easing.
What to focus on in the data:
• The month-over-month change, with particular attention to the Control Group, which excludes the most volatile components (autos, gasoline, and building materials) and provides a cleaner view of core consumer activity.
Leading Indicator (PMI)
PMI is a leading indicator that captures turning points in the economic cycle.
It does not measure production volumes or revenues. Its purpose is to identify the moment when business activity is accelerating or beginning to contract. The index is based on surveys of executives who make daily decisions about purchasing, hiring, and investment. Their collective assessment of changes is one of the most sensitive barometers of demand dynamics.
The key is not the absolute level of the index, but its direction and internal components. A decline from 55 to 52 still signals expansion, but indicates a loss of momentum. A rise from 48 to 49 still reflects contraction, but points to a slowdown in the pace of decline.
For central banks, two PMI components are particularly critical:
• New Orders — the purest indicator of future demand. A decline here typically precedes reductions in production and investment.
• Prices Paid — a direct signal of inflationary pressure in supply chains and the services sector. Sustained increases in this component can prevent monetary policy easing, even if the headline index is slowing.
PMI functions as an early warning system. A sustained deterioration over several months often precedes slower GDP growth and weakening labor market data. Conversely, resilience at elevated levels — especially when price components are rising — serves as evidence for central banks that the economy is overheating and that a restrictive stance must be maintained.
Conclusion
You now have a solid theoretical foundation for interpreting news releases and the signals they send to the market. To truly understand this framework and apply it effectively in trading, consistent practice is essential. From my own experience, keeping a macro trading journal can be extremely helpful. Record how the market reacts under different conditions and gradually develop your own independent view of each situation.
Be especially cautious of market rumors — more often than not, such opinions are simply attempts to attract attention with sensational headlines rather than provide meaningful insight.
Enjoy!


Shock Waves in TradingUnderstanding Sudden Market Movements and Their Impact
Financial markets are often perceived as systems driven by logic, data, and rational decision-making. However, in reality, markets are highly sensitive ecosystems where unexpected events can send powerful “shock waves” across asset classes, geographies, and investor psychology. Shock waves in trading refer to sudden, sharp, and often unforeseen movements in prices, volumes, and volatility caused by disruptive information or events. These shocks can originate from economic data, geopolitical developments, policy decisions, corporate actions, or even rumors amplified by modern technology. Understanding how shock waves form, propagate, and influence trading behavior is essential for traders, investors, and policymakers alike.
The Nature of Market Shock Waves
A shock wave in trading is characterized by speed, intensity, and wide-ranging impact. Unlike gradual trends that develop over time, shocks occur abruptly, catching market participants off guard. Prices may gap up or down, liquidity can evaporate, bid-ask spreads widen, and correlations between assets change rapidly. These movements resemble physical shock waves: a single disturbance at the source spreads outward, affecting everything in its path.
For example, an unexpected interest rate decision by a central bank can instantly alter currency valuations, bond yields, equity prices, and commodity markets. Similarly, a sudden geopolitical conflict can trigger risk-off behavior globally, pushing investors toward safe-haven assets like gold or government bonds while equities and emerging-market currencies sell off sharply.
Key Sources of Shock Waves in Trading
Shock waves can originate from multiple sources, often overlapping and reinforcing one another:
Macroeconomic Surprises
Economic indicators such as inflation data, employment reports, or GDP figures can trigger shocks when they deviate significantly from market expectations. Since many trades are positioned around forecasts, surprises force rapid repricing as traders adjust positions.
Central Bank Actions and Policy Shifts
Interest rate hikes, cuts, or unexpected policy statements are among the most powerful shock generators. Central banks influence the cost of capital, currency values, and risk appetite, making their decisions highly market-sensitive.
Geopolitical and Global Events
Wars, trade disputes, sanctions, elections, and diplomatic breakdowns can instantly change the outlook for industries and entire economies. These events often carry uncertainty, which markets tend to price aggressively.
Corporate-Specific Events
Earnings surprises, mergers and acquisitions, fraud revelations, or regulatory actions against companies can send shock waves through individual stocks and sometimes entire sectors.
Technological and Structural Factors
Algorithmic trading, high-frequency trading, and passive investment flows can amplify shocks. Once a trigger is hit, automated systems may execute large volumes of trades simultaneously, accelerating price movements.
How Shock Waves Spread Across Markets
One of the defining features of trading shock waves is contagion. A disturbance in one market rarely remains isolated. For instance, a sharp fall in U.S. equities can ripple through Asian and European markets due to global capital flows and interconnected investor sentiment. Currency markets may react to equity volatility, while commodity prices adjust based on revised growth expectations.
Correlation patterns often change during shocks. Assets that usually move independently may suddenly move together as investors rush to reduce risk. This phenomenon, sometimes called “correlation breakdown,” makes diversification less effective during extreme events and adds to portfolio volatility.
Psychological Impact on Traders
Beyond numbers and charts, shock waves have a profound psychological effect. Fear, panic, and uncertainty dominate decision-making during sudden market moves. Traders may abandon well-planned strategies, chase prices, or exit positions prematurely. Cognitive biases such as loss aversion and herd behavior become more pronounced, intensifying volatility.
At the same time, shock events can create overreactions. Prices may overshoot fair value as emotions take control, later correcting once clarity returns. Experienced traders often focus on managing emotions and sticking to risk rules during such periods, recognizing that survival is more important than short-term gains.
Risk Management During Market Shocks
Effective risk management is the primary defense against destructive shock waves. Traders who anticipate the possibility of sudden moves are better positioned to handle them. Common risk management practices include:
Position Sizing: Limiting exposure so that a single shock does not cause catastrophic losses.
Stop-Loss Orders: Predefined exit points help control downside risk, though slippage can occur during extreme volatility.
Diversification Across Assets and Time Frames: While correlations can rise during shocks, diversification still reduces reliance on a single outcome.
Liquidity Awareness: Trading highly liquid instruments reduces the risk of being trapped in unfavorable positions.
Professional traders also monitor volatility indicators, option pricing, and news flow to gauge the probability of upcoming shocks.
Opportunities Created by Shock Waves
While shocks are often associated with losses, they also create opportunities. Sudden dislocations can present attractive entry points for traders with a clear plan and strong discipline. Volatility increases option premiums, benefiting option sellers or volatility-focused strategies when managed carefully. Long-term investors may find quality assets trading at discounted prices due to temporary panic.
Event-driven traders, in particular, specialize in navigating shock environments by anticipating outcomes and positioning ahead of known risk events such as earnings releases or policy announcements.
Long-Term Implications for Markets
Repeated shock waves shape market structure over time. Regulatory reforms often follow major market disruptions, as seen after financial crises. Risk models evolve, trading strategies adapt, and participants become more sensitive to tail risks. Markets may also develop new instruments, such as volatility indices and derivatives, to hedge against sudden movements.
Importantly, shock waves remind participants that uncertainty is a permanent feature of financial markets. No model or strategy can eliminate risk entirely; the goal is to understand, prepare, and adapt.
Conclusion
Shock waves in trading are unavoidable expressions of uncertainty, information flow, and human behavior within financial markets. They can arise suddenly, spread rapidly, and challenge even the most experienced traders. By understanding their sources, recognizing how they propagate, and maintaining robust risk management, market participants can reduce damage and, in some cases, turn disruption into opportunity. Ultimately, success in trading is not about avoiding shocks altogether, but about building resilience and discipline to navigate them when they inevitably occur.
Indices Are Climbing: Understanding the Momentum Behind MarketsWhat Does It Mean When Indices Are Climbing?
Market indices like the Nifty 50, Sensex, Dow Jones, S&P 500, or Nasdaq track the performance of a selected group of stocks. When these indices climb consistently, it indicates that a majority of the constituent companies are gaining value. This upward movement usually reflects improving corporate earnings, favorable economic conditions, strong liquidity, or positive expectations about the future.
Climbing indices are often associated with a bullish market phase, where buying interest outweighs selling pressure. Investors feel confident about deploying capital, institutions increase exposure, and retail participation grows.
Key Reasons Behind Rising Indices
One of the primary drivers of climbing indices is economic growth. When GDP growth is strong, consumption rises, businesses expand, and corporate profits improve. This directly supports higher stock valuations. Alongside this, low interest rates encourage borrowing and investing. When returns from fixed-income instruments are relatively low, equities become more attractive, pushing indices upward.
Another important factor is corporate earnings growth. Markets are forward-looking, and indices often climb when companies report better-than-expected results or provide optimistic future guidance. Sectors like banking, IT, energy, and manufacturing can collectively lift indices when they perform well.
Liquidity and global capital flows also play a vital role. Foreign institutional investors (FIIs) and domestic institutional investors (DIIs) inject large sums into equity markets during stable or growth-oriented phases. Abundant liquidity reduces volatility and supports sustained upward trends.
The Role of Market Sentiment and Psychology
Market sentiment is a powerful force. When indices are climbing, it reinforces positive psychology among investors. This creates a feedback loop—rising prices attract more buyers, which in turn pushes prices even higher. Media coverage, social discussions, and analyst upgrades amplify this optimism.
Fear of missing out (FOMO) becomes common during strong rallies. Investors who stayed on the sidelines begin entering the market, further fueling the upward momentum. However, while sentiment-driven rallies can be strong, they may also become fragile if not supported by fundamentals.
Sectoral Contribution to Rising Indices
Indices do not climb uniformly; sectoral leadership matters. In many rallies, banking and financial stocks act as heavyweights, given their large index weightage. A rally in banks often reflects confidence in credit growth, asset quality, and economic stability.
Technology and export-oriented sectors benefit from global demand, currency movements, and digital transformation trends. Infrastructure, capital goods, and manufacturing stocks rise when governments increase spending and private investment picks up. When multiple sectors participate, the index climb becomes broader and healthier.
Impact on Retail and Long-Term Investors
For retail investors, climbing indices often boost confidence and portfolio values. Long-term investors benefit from wealth creation, as sustained index growth reflects compounding over time. Systematic Investment Plans (SIPs) perform particularly well during such phases, as regular investments capture both market highs and corrections.
However, rising indices can also tempt inexperienced investors to chase momentum without understanding valuations or risk. Disciplined investing, asset allocation, and diversification remain essential, even during bullish phases.
Valuations and Sustainability of the Rally
A critical question during any index rally is sustainability. Indices can climb even when valuations become stretched. Price-to-earnings (P/E) ratios, price-to-book values, and earnings yield are important metrics to assess whether markets are overheated.
If indices rise faster than earnings growth, it may signal speculative excess. On the other hand, if earnings growth supports price appreciation, the rally is considered fundamentally strong. Central bank policies, inflation trends, and global macroeconomic conditions also influence how long indices can continue climbing.
Risks Associated with Climbing Indices
While rising indices are positive, they are not without risks. Geopolitical tensions, unexpected policy changes, inflation spikes, or global economic slowdowns can quickly reverse sentiment. Overleveraging, excessive derivatives activity, and narrow market breadth can also increase vulnerability.
Corrections are a natural part of market cycles. Even in strong bull markets, temporary pullbacks help reset valuations and remove excess speculation. Investors should view corrections as opportunities rather than threats, provided fundamentals remain intact.
How Traders and Investors Can Approach a Rising Market
In a climbing index environment, trend-following strategies often work well. Traders look for higher highs and higher lows, using technical indicators like moving averages and relative strength. Investors, on the other hand, focus on quality businesses with strong balance sheets and long-term growth potential.
Risk management is crucial. Setting stop-losses, avoiding over-concentration, and not investing borrowed money helps protect capital. A rising market rewards patience and discipline more than impulsive decision-making.
Conclusion: What Climbing Indices Truly Signal
When indices are climbing, they signal confidence in economic prospects, corporate performance, and market stability. They reflect collective belief in future growth rather than just present conditions. For investors, this phase offers opportunities for wealth creation, but also demands caution and rational thinking.
Ultimately, climbing indices are a reminder that markets move in cycles. Those who understand the reasons behind the rise, respect risks, and stay aligned with long-term goals are best positioned to benefit. A rising index is not just a number going up—it is a story of growth, expectations, and the ever-evolving relationship between the economy and investor confidence.

Global Trade Assets: The Backbone of the International Economic Understanding Global Trade Assets
At their core, global trade assets refer to anything that adds value to or facilitates international trade. Traditionally, this concept was limited to tangible goods such as commodities, manufactured products, and raw materials. However, with globalization and digitalization, the definition has expanded to include intangible assets such as intellectual property, brand value, data, trade finance instruments, and digital platforms. Together, these assets form the foundation of global commerce.
Physical Assets in Global Trade
Physical assets remain the most visible component of global trade. These include natural resources like oil, gas, minerals, agricultural products, and water resources, which are traded extensively across borders. Manufactured goods such as machinery, electronics, automobiles, and pharmaceuticals also form a large share of global trade volumes.
Equally important are logistics and infrastructure assets. Ports, airports, highways, railways, warehouses, and shipping fleets are essential for transporting goods efficiently. Countries with advanced logistics infrastructure often enjoy a competitive advantage in global trade because they can move goods faster, cheaper, and more reliably. Strategic assets such as major ports, canals, and trade corridors significantly influence global supply chains.
Financial Assets and Trade Finance
Financial assets are critical enablers of global trade. International trade would be nearly impossible without mechanisms that manage risk, provide liquidity, and ensure trust between trading partners. Trade finance instruments such as letters of credit, bank guarantees, export credit insurance, and bills of exchange allow buyers and sellers from different countries to transact with confidence.
Currencies themselves are also global trade assets. Reserve currencies like the US dollar, euro, and increasingly the Chinese yuan play a central role in settling international trade transactions. Financial markets, including foreign exchange markets, commodity exchanges, and derivatives markets, allow businesses to hedge against currency, price, and interest rate risks associated with cross-border trade.
Human Capital as a Trade Asset
Human capital is one of the most valuable yet often underestimated global trade assets. Skilled labor, managerial expertise, technical knowledge, and entrepreneurial capabilities determine a country’s ability to produce competitive goods and services for the global market. Nations that invest in education, vocational training, and skill development tend to integrate more successfully into global value chains.
In services trade especially, human capital is the primary asset. Sectors such as information technology, finance, consulting, healthcare, education, and creative industries rely heavily on knowledge and expertise rather than physical goods. The global mobility of talent further enhances the importance of human capital in international trade.
Technology and Digital Trade Assets
Technology has transformed global trade assets dramatically. Digital platforms, e-commerce marketplaces, cloud computing, artificial intelligence, and blockchain systems have become essential tools for cross-border trade. These digital assets reduce transaction costs, increase transparency, and open global markets to small and medium-sized enterprises.
Intellectual property assets such as patents, trademarks, copyrights, and trade secrets are now central to global competitiveness. Companies and countries that control advanced technologies and strong brands often dominate global markets, even if they do not produce large volumes of physical goods. Data has also emerged as a strategic trade asset, influencing supply chain decisions, customer targeting, and market forecasting.
Institutional and Legal Assets
Institutional frameworks are crucial global trade assets that provide stability and predictability. Trade agreements, customs systems, regulatory standards, and dispute resolution mechanisms reduce uncertainty in international transactions. Organizations such as the World Trade Organization (WTO), regional trade blocs, and bilateral trade agreements establish rules that govern global trade.
Strong legal systems that protect property rights, enforce contracts, and ensure regulatory transparency attract foreign trade and investment. Trust in institutions enhances a country’s reputation as a reliable trading partner, which is itself an intangible but powerful trade asset.
Strategic and Geopolitical Trade Assets
In today’s world, trade assets are increasingly influenced by geopolitics. Strategic control over critical resources, shipping routes, technologies, and supply chains has become a major concern for nations. Assets such as rare earth minerals, semiconductor manufacturing capabilities, energy infrastructure, and food security resources are now viewed through both economic and strategic lenses.
Countries are actively seeking to diversify and secure their trade assets to reduce dependency on single markets or suppliers. This shift highlights the importance of resilience as a key attribute of global trade assets.
Role of Global Trade Assets in Economic Growth
Global trade assets drive economic growth by enabling specialization, efficiency, and scale. When countries leverage their comparative advantages—whether in natural resources, skilled labor, technology, or infrastructure—they can integrate more deeply into global markets. This integration leads to higher productivity, job creation, innovation, and improved living standards.
For developing economies, building and upgrading global trade assets is essential for moving up the value chain. Investments in infrastructure, education, digital technology, and institutional reforms can transform a country from a raw material exporter into a competitive participant in global manufacturing and services trade.
Challenges and Future Outlook
Despite their importance, global trade assets face numerous challenges. Supply chain disruptions, trade wars, protectionism, climate change, and technological divides threaten the stability of global trade systems. Maintaining and upgrading trade assets requires continuous investment, policy coordination, and international cooperation.
Looking ahead, sustainable trade assets will gain prominence. Green infrastructure, renewable energy systems, carbon-efficient logistics, and environmentally responsible production methods are becoming integral to global trade competitiveness. Digital and knowledge-based assets will continue to grow in importance, reshaping how global trade operates.
Conclusion
Global trade assets are the backbone of the international economic system. They encompass physical resources, financial instruments, human capital, technology, institutions, and strategic capabilities that collectively enable cross-border commerce. In a rapidly changing global environment, the effective development, management, and protection of these assets determine a nation’s ability to compete, grow, and prosper in global trade. Understanding and strengthening global trade assets is therefore not just an economic priority, but a strategic necessity for the future.

“Cut Your Losses, Let Your Profits Run.” Fine, But How Exactly?We’ve all heard it. It’s right up there with “buy low, sell high” in the Hall of Fame of obvious trading advice. Everyone agrees with it. Few people do it.
Why? Because cutting losses hurts. Letting profits run is scary (especially in the current macro ). And both go directly against how human brains are wired.
Still, that simple phrase sits at the core of nearly every profitable trading career ever built. So let’s talk about how traders actually do that in the real world.
🧠 Why Your Brain Hates This Rule
Your brain evolved to avoid the bad stuff and lock in the good stuff. Trading puts that wiring to the test.
When a trade is losing, your instinct is to wait — maybe it’ll bounce. So you avoid facing the bad consequences of your decision. It ain’t a loss unless you sell, right?
When a trade is winning, your instinct is to grab the money before it disappears. That’s called loss aversion, and it’s why so many traders end up with small wins and large losses. Revenge trading usually follows.
The goal here is simple: Make the average win bigger than the average loss. Or, even better, have one big winner that can take care of several small-size losses.
📉 Cutting Losses: Think in Probabilities
Cutting losses doesn’t mean being right less — it means being wrong cheaply. “It's not whether you're right or wrong, but how much money you make when you're right and how much you lose when you're wrong.”
Professional traders assume they will be wrong a lot. They build that expectation into their process and risk profile. When a trade moves against them beyond what they originally planned for, they step aside without drama.
“If you have a losing position that is making you uncomfortable, the solution is very simple: Get out, because you can always get back in.”
A small loss is just a data point. A big loss changes behavior.
The traders who make it treat exits like boring administrative work. Just a clean “this didn’t work, let’s see what’s next.”
📈 Letting Profits Run: The Harder Half
Cutting losses is uncomfortable — but letting profits run is even harder.
When a trade goes your way, your mind immediately starts calculating what you could buy with the gains or how much you’re up just for the day. The idea of losing those profits feels worse than the pain of an initial loss. So traders exit too early, again and again.
The result? They get paid for being right, but not enough to cover when they’re wrong.
Letting profits run means allowing the market to do the work. It means resisting the urge to micromanage every tick. It means giving strong trends time to show themselves.
🧮 The Math That Makes This Work
This rule isn’t philosophical — it’s mathematical (it’s fairly simple, though).
Imagine a trader wins half their trades. If their losses average 1 unit and their wins average 2 units, they’re profitable over time.
But flip it — small wins, large losses — and even being right 60% of the time won’t save you.
Cutting losses protects the downside. Letting profits run expands the upside. Together, they tilt probability in your favor, especially if you’re chasing asymmetrical bets .
That’s the whole game. One good trend pays for ten small losses and the equity curve starts to make some sense.
🧭 The Trader’s Secret Weapon: Risk Profile
The traders who follow this rule best don’t rely on willpower. They rely on a solid risk profile.
They decide in advance:
• How much they’re willing to lose
• Under what conditions they exit
• What signals a trade is still working
By making these decisions before emotions get involved, they remove most of the internal debate when it matters most, especially during high-impact economic data releases .
Trading becomes less about being brave and more about being prepared. In short, the whole thing about cutting your losses and letting your profits run is about embracing small losses without ego and allowing big wins without fear.
Off to you : How do you deal with your losses and wins? Share your approach in the comments!

Understanding How Your Orders Actually Get Filled
You Click "Buy." What Actually Happens Next?
Most traders see a chart and think that's the market.
But the chart is just the surface. Beneath it lies a complex ecosystem of orders, matching engines, market makers, and execution venues.
Understanding market microstructure won't make you a better chart reader. But it will make you a better trader.
What Is Market Microstructure?
Definition:
Market microstructure is the study of how markets operate at the mechanical level how orders are placed, matched, and executed.
Why It Matters:
Explains why prices move the way they do
Reveals hidden costs of trading
Helps optimize execution
Exposes market manipulation tactics
The Order Book
What It Is:
A real-time list of all pending buy and sell orders at different price levels.
Structure:
ASKS (Sellers)
$50.05 | 500 shares
$50.04 | 1,200 shares
$50.03 | 800 shares
$50.02 | 2,000 shares ← Best Ask (Lowest sell price)
$50.00 | 1,500 shares ← Best Bid (Highest buy price)
$49.99 | 3,000 shares
$49.98 | 1,000 shares
$49.97 | 2,500 shares
BIDS (Buyers)
Key Terms:
Bid: Highest price buyers are willing to pay
Ask: Lowest price sellers are willing to accept
Spread: Difference between bid and ask
Depth: Total orders at each price level
How Orders Get Matched
The Matching Engine:
When you place an order, it goes to a matching engine that pairs buyers with sellers.
Priority Rules:
Price Priority: Better prices get filled first
Time Priority: At same price, earlier orders fill first
Example:
You place market buy for 100 shares.
Best ask is $50.02 with 2,000 shares.
You get filled at $50.02 (takes liquidity from the ask).
Types of Market Participants
1. Retail Traders
Individual traders like you
Typically small order sizes
Often use market orders
Price takers (accept current prices)
2. Institutional Traders
Hedge funds, mutual funds, pension funds
Large order sizes
Use algorithms to minimize impact
Can be price makers or takers
3. Market Makers
Provide liquidity by quoting both bid and ask
Profit from the spread
Required to maintain orderly markets
Use sophisticated algorithms
4. High-Frequency Traders (HFT)
Trade in milliseconds
Exploit tiny price discrepancies
Provide liquidity (sometimes)
Can front-run slower orders
The Spread and Its Implications
What the Spread Represents:
Cost of immediate execution
Market maker's compensation
Liquidity indicator
Spread Dynamics:
Tight spread: High liquidity, low cost to trade
Wide spread: Low liquidity, high cost to trade
Example:
Bid: $50.00, Ask: $50.02
Spread: $0.02 (0.04%)
If you buy at ask and immediately sell at bid, you lose $0.02/share
Implication:
Every round-trip trade costs you at least the spread. This is why overtrading is expensive.
Price Discovery
How Prices Move:
Prices move when there's an imbalance between buying and selling pressure.
Scenario 1: More Buyers
Buyers consume ask liquidity
Price moves up to find more sellers
New equilibrium at higher price
Scenario 2: More Sellers
Sellers consume bid liquidity
Price moves down to find more buyers
New equilibrium at lower price
Key Insight:
Price doesn't move because of "sentiment." It moves because orders hit the book and consume liquidity.
How AI Uses Microstructure
1. Order Flow Analysis
AI tracks:
Aggressive buying vs selling
Large orders hitting the book
Imbalances in bid/ask depth
2. Spread Prediction
AI predicts:
When spreads will widen (reduce size)
When spreads will tighten (better execution)
3. Optimal Execution
AI determines:
Best time to execute
Optimal order size
Which venue to use
4. Market Making
AI market makers:
Quote bid and ask continuously
Adjust quotes based on inventory
Manage risk in real-time
Microstructure Concepts Every Trader Should Know
1. Slippage
The difference between expected price and actual fill price.
Causes:
Market orders in fast markets
Large orders relative to liquidity
Wide spreads
Mitigation:
Use limit orders
Trade liquid assets
Avoid trading during low liquidity periods
2. Market Impact
How your order affects the price.
Reality:
Large orders move prices against you.
Buying pushes price up
Selling pushes price down
Mitigation:
Break large orders into smaller pieces
Use algorithms (TWAP, VWAP)
Trade over time, not all at once
3. Hidden Liquidity
Orders that don't appear in the visible order book.
Types:
Iceberg orders (only show portion)
Dark pools (private exchanges)
Hidden orders
Implication:
The visible order book doesn't show all available liquidity.
4. Queue Position
Your place in line at a price level.
Why It Matters:
If you're 1,000th in queue at $50.00, you won't get filled until 999 orders ahead of you fill.
Implication:
Limit orders at popular prices may not fill even if price touches your level.
Practical Microstructure Applications
Application 1: Reading Order Flow
Watch for:
Large orders hitting bid/ask
Absorption (price holds despite volume)
Exhaustion (volume without price movement)
Application 2: Timing Entries
Enter when:
Spread is tight
Liquidity is high
Order flow supports your direction
Application 3: Avoiding Bad Fills
Avoid:
Market orders in illiquid assets
Trading during news (spreads widen)
Large orders relative to average volume
Application 4: Understanding Wicks
Wicks often represent:
Liquidity being taken
Stop hunts
Temporary imbalances
Microstructure Red Flags
Widening Spreads Indicates decreasing liquidity, higher trading costs.
Thinning Order Book Less depth = more volatile price moves.
Unusual Order Patterns Spoofing, layering, or manipulation attempts.
Delayed Fills Your orders taking longer to fill than usual.
Key Takeaways
The order book is where price discovery actually happens
Spread represents the cost of immediate execution
Your orders have market impact larger orders move prices against you
AI can analyze order flow and optimize execution
Understanding microstructure helps you get better fills and avoid hidden costs
Your Turn
Do you pay attention to the order book or just the chart?
Have you noticed how your order size affects your fills?
Share your microstructure observations below 👇

Institutional Levels: Whole, Half, Quarter Numbers - StrategyHi guys, today let's look to the level which can give your levels higher probability or can be just used by its own.
Under an “institutional” lens, those whole/half/quarter prices are not “psychology.” They are liquidity engineering points: standardized, widely-watched round-number grids where large participants can execute size with less slippage and better control of average fill.
📌 1) What “institutional levels” are in plain terms
Institutions (banks, macro funds, CTAs, options desks, corporates, systematic execution algos) care about one thing that retail rarely feels: How to transact large volume without moving price too much.
🧩The easiest places to do that are prices where orders naturally cluster:
• Whole numbers (…00)
• Half numbers (…50)
• Quarter numbers (…25 / …75)
🧩 Example (EURUSD):
• Whole: 1.2000, 1.2100
• Half: 1.2050, 1.2150
• Quarter: 1.2025 / 1.2075, etc.
Look how every significant price turn has happened around these levels 🧩 These are “institutional levels” because they attract:
• Resting liquidity (limits, stops, take-profits)
• Execution algos slicing orders around obvious references
• Options-related flows that often gravitate around strikes (frequently round numbers)
• Risk management anchoring (rebalance around clean reference points)
📌 2) Why “psychological levels” is a misleading story
Retail typically hears: “People feel 1.2000 is important.” But people doesn't move the market. Institutions does. The level is important because that’s where the liquidity is, and liquidity is where big money can do business.
🧠 I n the end if you call it psychological level or institutional really doesnt matter. Important is to know what to do around such levels.
📌 3) What banks and large desks are “doing” around these levels
Think in terms of inventory and filling, not prediction. Traders treats the level like a line that “should hold. ”Institutions treat the level like a zone of business:
• price may pierce it,
• hover around it,
• and only later reveal direction once the liquidity is processed. 🧩 A) Building a position requires liquidity
If a big players needs to accumulate longs, they need sellers. Where are sellers concentrated?
• Above obvious levels (breakout buyers, stops, momentum)
• Below obvious levels (stop-loss clusters, breakdown sellers)
🧩 B) The “run the level” behavior is usually about fills
Common institutional sequence:
1. Price approaches a round level.
2. Price briefly trades through it (to access the liquidity on the other side).
3. You see fast movement and a burst of participation.
4. Price either rotates back (if liquidity was used to fill) or continues (if genuine continuation demand remains).
‼️ TIp - These levels are where you can expect big players trade, but if you connect it with another market context it will make even more sense. For example if you have supply / Demand Level / Order block with confluence with these levels = Strong Zone.
💊 Here is the institutional playbook you can apply immediately:
It's always better if you have complete strategy which you trade. Level is just a level it's a part of the strategy. I you are looking to day trade this concept works well with these levels.
Click the picture below to learn more 🧪 Step 1: Mark the Key Levels
• Whole + half levels always
• Quarter levels near current price (optional) 🧪 Step 2: Trade Manipulation around key Level/b]
Is price being accepted above the level or rejected?
• Preferably during the London Session or NY session Opens
• In Confluence with Asia Session Liquidity it makes sense
• Rejection: price pops above, fails quickly, and returns below with urgency. 🧪 Step 3: Look for the liquidity event
Two high-probability events at institutional levels:
• Sweep: quick push through the level and immediate return
• Absorption: repeated tests into the level where progress stalls (someone is filling size). 🧪 Step 4: Only enter after change in order flow Close above the manipulation candles. Structure break with close / Engulfing I promised myself I’d become the person I once needed the most as a beginner. Below are links to a powerful lessons I shared on Tradingview. Hope it can help you avoid years of trial and error I went thru.
📊 Sharpen your trading Strategy
⚙️ 100% Mechanical System - Complete Strategy
🔁 Daily Bias – Continuation
🔄 Daily Bias – Reversal
🧱 Key Level – Order Block
📉 How to Buy Lows and Sell Highs
🎯 Dealing Range – Enter on pullbacks
💧 Liquidity – Basics to understand
🕒 Timeframe Alignments
🚫 Market Narratives – Avoid traps
🐢 Turtle Soup Master – High reward method
🧘 How to stop overcomplicating trading
🕰️ Day Trading Cheat Code – Sessions
🇬🇧 London Session Trading
🔍 SMT Divergence – Secret Smart Money signal
📐 Standard Deviations – Predict future targets
🎣 Stop Hunt Trading
💧 Liquidity Sweep Mastery
🔪 Asia Session Setups
📀 Gold Strategy
🧠 Level Up & Mindset
🛕 Monk Mode – Transition from 9–5 to full-time trading
⚠️ Trading Enemies – Habits that destroy success
🔄 Trader’s Routine – Build discipline daily
💪 Get Funded - $20 000 Monthly Plan
🧪 Winning Trading Plan
⭕ Backtesting vs Reality
🛡️ Risk Management
🏦 Risk Management for Prop Trading
📏 Risk in % or Fixed Position Size
🔐 Risk Per Trade – Keep consistency
🧪 Risk Reward vs Win Ratio
💎 Catch High Risk Reward Setups
☯️ Smart Money - Who control Markets
Adapt useful, Reject useless and add what is specifically yours.
David Perk

The XRP chart is like from a textbook! Wyckoff tutorialWelcome! When finance professionals are watching, you can expect solid analytics and real education.
Today we’re going to break down Wyckoff market cycles using the XRP chart in real time.
Wyckoff cycles are not just theory - they are an established concept that works in all markets. This is a model of price behavior based on the actions of large players ("smart money"). It shows how professionals accumulate positions, drive the market, and distribute assets, creating repeating phases of growth and decline.
Any market moves cyclically. Wyckoff identified two major cycles:
Bull market cycle (Accumulation → Markup → Distribution → Markdown)
Bear market cycle (the mirror reflection of the first)
Each cycle consists of four phases:
-Accumulation
-Markup (Growth)
-Distributio
-Markdown (Decline)
Phase 1. Accumulation
This is the phase when "smart money" buys the asset in large volumes while trying not to push the price too high. Conditions are created where regular market participants do not want to buy the asset, and may even sell it near market lows. Usually during this period there is bad news, lack of confidence, etc. Large players quietly buy up all this negativity.
Phase 2. Markup (Growth)
An impulsive upward movement begins - a trend that everyone notices when it is already too late. The crowd starts to wake up and enters the market at high prices.
Phase 3. Distribution
The price again enters a trading range, but now major participants sell their positions to retail traders who come in euphoric after the rise. Usually, the news is excellent here, everyone expects further growth, there is general euphoria, people load into the asset to the maximum while large players quietly unload their positions.
Phase 4. Markdown (Decline)
Professionals have sold everything they wanted, and now the market goes down almost without resistance. Retail - back to the factory.
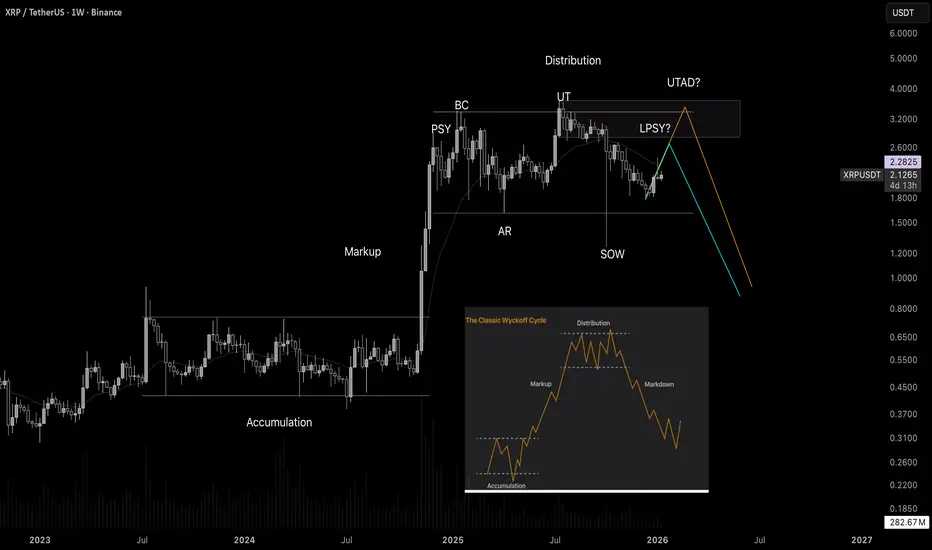
Global Recession and Its Impact on the Stock MarketUnderstanding the Nature of a Global Recession
A global recession typically arises from a combination of factors such as financial crises, sharp interest rate hikes, geopolitical conflicts, pandemics, commodity shocks, or systemic banking failures. Unlike regional recessions, a global recession spreads across borders through trade links, capital flows, currency markets, and investor sentiment. When major economies like the United States, Europe, or China slow down simultaneously, the ripple effects are felt across emerging and developed markets alike.
Stock markets act as economic barometers. As expectations of lower growth emerge, equity prices begin to factor in weaker corporate earnings, declining demand, and tighter financial conditions. This makes stock markets one of the first and most visible casualties of a global recession.
Immediate Stock Market Reactions
One of the most prominent impacts of a global recession on stock markets is heightened volatility. As recession fears intensify, investors often rush to reduce risk exposure, triggering sharp sell-offs. Equity indices may experience rapid declines as panic-driven selling dominates rational valuation. During such phases, even fundamentally strong companies can see steep price corrections due to broad-based market fear.
Liquidity also becomes a concern. In times of recession, institutional investors may face redemption pressures, forcing them to sell holdings. This can amplify market declines, widen bid-ask spreads, and reduce market depth. Sudden drops in stock prices can erode investor confidence, creating a self-reinforcing cycle of fear and selling.
Decline in Corporate Earnings
At the core of stock valuation lies corporate profitability. A global recession directly impacts company earnings through reduced consumer spending, weaker demand, supply chain disruptions, and rising costs of financing. As revenues fall and margins compress, companies often issue earnings downgrades. These revisions play a major role in pushing stock prices lower.
Cyclical sectors such as automobiles, metals, construction, real estate, and discretionary consumption tend to suffer the most. Businesses dependent on exports are particularly vulnerable during a global downturn, as international trade slows and currency volatility increases. Lower earnings expectations reduce price-to-earnings multiples, further dragging stock market valuations down.
Sectoral Impact and Market Rotation
A global recession does not affect all sectors equally. Defensive sectors such as healthcare, utilities, consumer staples, and pharmaceuticals usually outperform the broader market during recessionary periods. These sectors provide essential goods and services, which remain in demand even when economic conditions deteriorate.
On the other hand, high-growth and capital-intensive sectors like technology, infrastructure, banking, and luxury goods often experience sharper corrections. Financial stocks are especially sensitive to recessions due to rising loan defaults, lower credit growth, and tighter regulatory oversight. Investors typically rotate their portfolios away from riskier assets and into defensive or dividend-paying stocks, reshaping overall market dynamics.
Impact on Investor Sentiment and Behavior
Investor psychology plays a crucial role during a global recession. Fear, uncertainty, and pessimism dominate market sentiment, leading to risk aversion. Retail investors may exit equities altogether, preferring cash or fixed-income instruments perceived as safer. Foreign institutional investors often withdraw capital from emerging markets, causing additional pressure on local stock indices and currencies.
Long-term investors, however, may view recession-driven market corrections as opportunities to accumulate quality stocks at discounted valuations. This divergence in behavior creates sharp short-term fluctuations while laying the groundwork for eventual recovery.
Role of Central Banks and Governments
Policy responses significantly influence how stock markets react to a global recession. Central banks usually respond by cutting interest rates, injecting liquidity, and implementing accommodative monetary policies. Lower interest rates reduce borrowing costs, support corporate balance sheets, and make equities more attractive compared to bonds.
Governments often introduce fiscal stimulus measures such as tax cuts, infrastructure spending, and direct financial support to households and businesses. These interventions can stabilize markets and restore investor confidence. Stock markets often stage relief rallies when large stimulus packages are announced, even if economic conditions remain weak.
Long-Term Structural Changes
Global recessions can lead to long-lasting structural shifts in stock markets. Certain industries may permanently lose relevance, while others emerge stronger. For example, past recessions have accelerated digital transformation, automation, and shifts in consumer behavior. Companies that adapt quickly to new economic realities tend to outperform in the post-recession phase.
Valuation frameworks may also change. Investors become more cautious, emphasizing balance sheet strength, cash flows, and sustainable business models over aggressive growth projections. This can lead to a re-rating of markets and a more disciplined investment environment.
Recovery Phase and Market Rebound
Historically, stock markets begin to recover before the broader economy shows visible improvement. As soon as recessionary conditions start stabilizing and future growth expectations improve, equities often rally sharply. This recovery is usually led by sectors that were hit hardest during the downturn, followed by broader market participation.
However, the pace and sustainability of recovery depend on factors such as policy effectiveness, inflation trends, employment growth, and global economic coordination. Markets that fell the most during the recession often deliver strong returns during the rebound, rewarding patient and disciplined investors.
Conclusion
A global recession has a profound and multifaceted impact on stock markets. From sharp declines and heightened volatility to earnings compression and shifts in investor behavior, recessions reshape financial markets in significant ways. While the short-term effects are often painful, they also serve as periods of correction, revaluation, and transformation.
For investors, understanding the dynamics of a global recession is crucial for risk management and long-term wealth creation. Diversification, focus on fundamentals, and a disciplined investment approach can help navigate turbulent markets. Ultimately, while global recessions test the resilience of stock markets, history shows that markets adapt, recover, and often emerge stronger over time.

International Payment GatewaysThe Backbone of Global Digital Transactions:
In today’s interconnected world, businesses and individuals operate beyond geographical boundaries. Whether it is an e-commerce company selling products overseas, a freelancer receiving payments from international clients, or a multinational corporation managing cross-border transactions, international payment gateways play a critical role. These gateways act as secure bridges that enable money to move smoothly between buyers and sellers across different countries, currencies, and banking systems.
What Are International Payment Gateways?
An international payment gateway is a technology-driven financial service that authorizes, processes, and settles online payments across borders. It connects merchants, customers, banks, card networks, and financial institutions, ensuring that a transaction initiated in one country can be completed in another. These gateways support multiple payment methods such as credit cards, debit cards, bank transfers, digital wallets, and sometimes even local payment systems specific to a country or region.
At their core, international payment gateways ensure security, speed, and reliability in global transactions while complying with international financial regulations.
How International Payment Gateways Work
The process begins when a customer initiates a payment on a merchant’s website or app. The payment gateway encrypts sensitive data such as card details and transmits it to the acquiring bank. The acquiring bank then forwards the request to the relevant card network (Visa, Mastercard, etc.), which communicates with the issuing bank of the customer. The issuing bank verifies the details and either approves or declines the transaction. Once approved, the funds are settled and eventually credited to the merchant’s account after currency conversion and fee deductions.
Although this entire process happens in a matter of seconds, it involves multiple institutions and complex backend systems working in harmony.
Key Features of International Payment Gateways
One of the most important features of international payment gateways is multi-currency support. Customers can pay in their local currency, while merchants receive funds in their preferred settlement currency. This reduces friction and improves the customer experience.
Another essential feature is payment method diversity. Different countries prefer different payment modes—credit cards dominate in the US, bank transfers are common in Europe, and digital wallets are popular in Asia. International gateways integrate these methods to cater to a global audience.
Security and fraud prevention are also critical. Gateways use encryption, tokenization, two-factor authentication, and compliance standards such as PCI-DSS to protect transactions. Advanced gateways also employ AI-driven fraud detection to minimize chargebacks and unauthorized payments.
Importance of International Payment Gateways in Global Trade
International payment gateways have become the backbone of global e-commerce and digital trade. They enable small businesses and startups to access international markets without setting up foreign bank accounts or local entities. This democratization of global commerce has empowered entrepreneurs, freelancers, and service providers worldwide.
For multinational companies, these gateways streamline financial operations by centralizing payment processing, improving cash flow visibility, and reducing administrative complexity. In sectors such as travel, education, SaaS, and digital content, international payment gateways are indispensable.
Benefits for Businesses
For businesses, international payment gateways offer several advantages. They expand market reach by allowing merchants to accept payments from customers worldwide. Faster settlements improve liquidity and working capital management. Automated currency conversion reduces operational hassle, while detailed reporting and analytics help businesses track international sales performance.
Additionally, offering trusted global payment options builds customer confidence. When customers see familiar payment methods, they are more likely to complete transactions, reducing cart abandonment rates.
Challenges and Limitations
Despite their advantages, international payment gateways come with challenges. Transaction fees are often higher than domestic payments due to currency conversion costs, cross-border charges, and intermediary fees. Businesses must factor these costs into pricing strategies.
Regulatory compliance is another challenge. Different countries have varying financial laws, taxation rules, and data protection regulations. Payment gateways must continuously adapt to remain compliant, and merchants must also understand local requirements.
Currency fluctuations can impact profitability, especially for businesses operating on thin margins. Delays in settlement or chargeback disputes can also affect cash flow if not managed properly.
Role of Technology and Innovation
Technology has significantly transformed international payment gateways. Cloud computing, APIs, and fintech innovations have made integrations faster and more flexible. Modern gateways offer plug-and-play solutions that can be integrated into websites and mobile apps with minimal technical effort.
Blockchain and real-time payment networks are emerging as potential game changers, promising faster settlements, lower costs, and increased transparency. Artificial intelligence is enhancing fraud detection, risk assessment, and customer authentication, making cross-border payments safer than ever.
Use Cases Across Industries
International payment gateways are widely used across industries. In e-commerce, they enable global sales and subscription-based models. In freelancing and remote work, they allow professionals to receive payments from clients worldwide. Education platforms rely on them to collect international tuition fees, while travel and hospitality businesses use them to process bookings from international travelers.
Even financial markets and investment platforms depend on robust international payment systems to facilitate fund transfers, trading margins, and settlement processes.
Future of International Payment Gateways
The future of international payment gateways is closely tied to the growth of digital economies and global connectivity. As cross-border trade continues to expand, gateways will focus on reducing costs, improving speed, and enhancing user experience. Localization, regulatory adaptability, and seamless mobile payments will be key drivers.
The integration of digital currencies and central bank digital currencies (CBDCs) may further reshape international payments, offering new possibilities for instant and low-cost cross-border transactions.
Conclusion
International payment gateways are more than just transaction processors—they are enablers of global economic participation. By bridging currencies, countries, and financial systems, they make international trade accessible, efficient, and secure. For businesses aiming to grow beyond borders, choosing the right international payment gateway is a strategic decision that can influence customer trust, operational efficiency, and long-term success.
