How to Recognize an Upcoming Correction: the Bitcoin CaseHello, Traders! 😎
The cryptocurrency market is constantly in motion, and identifying the moment when upside momentum begins to fade is critical for traders. On the BTC and ETH charts, classic local top patterns are emerging: sharp bullish impulses are followed by downside acceleration and early signs of weakness. These signals help traders assess the likelihood of pullbacks and make informed decisions around profit-taking or position hedging.
Technical signals 🚨
Local tops: The market was printing a sequence of highs followed by shallow pullbacks, pointing to exhaustion of the bullish impulse rather than healthy continuation.
Downside acceleration: Fast sell-offs after highs were established indicate rising sell-side pressure and weakening follow-through.
Near-vertical advances: Extremely steep price moves often represent a terminal phase of the impulse and tend to resolve into consolidation or a corrective leg
Indicator confirmation
Momentum indicators support the structural weakness. RSI showed signs of overheating on lower timeframes, with momentum failing to expand alongside price. Volume behavior also suggested distribution, as upside moves were no longer accompanied by strong participation.
Altcoin comparison
ETH and SOL were displaying similar structures — sharp upside expansion followed by high-taking and early weakness. The synchronized behavior across majors points to a broader, market-wide corrective risk rather than an isolated Bitcoin move.
From a trading perspective, partial profit-taking and selective hedging helped reduce exposure to sharp pullbacks. BTC remained the primary market driver — its structure set the tone for ETH and the broader altcoin complex. Market behavior was often distorted by rumors, FUD/FOMO , and news-driven narratives, which frequently misled participants. For that reason, this analysis focused on clean price action rather than external noise, using highs, pullbacks, and weakness patterns as the primary reference.
This commentary reflected market observation and structural analysis only and was not intended as trading or investment advice.
Correction

Your Playbook for Deep Corrections: Top Seven Things to KnowEvery trader hopes that whatever is happening with any pullback is healthy. “Just a healthy retreat, it’ll go back, it always does. R-r-right?”
While that’s true (obviously, markets had always shot up to records after deep losses), your job is to survive that lower leg and ideally come out stronger than before.
Because sometimes the market doesn’t correct immediately. It drops, turns around, drops some more and doesn’t ask you how you’re doing.
Where are we in the valuation cycle now? In the “Is this AI thing a bubble” talks.
With stocks stretched, AI valuations orbiting Saturn, and Nvidia NASDAQ:NVDA dictating the market’s fate, investors are starting to ask: What happens if this thing unwinds… fast?
A deep correction shakes your portfolio like nothing else, ultimately putting your strategy (and sanity) to a test. That's why you must know how to deal with correction ( if when it comes).
Here’s your playbook. Seven things every trader should know when markets get serious.
⚡️ 1. Know What’s Driving the Tempo
Right now, the tempo-setter isn't in the economic calendar (but good to keep an eye on it). It's not gold, the US dollar, oil prices, or consumer sentiment.
It’s Nvidia NASDAQ:NVDA
The stock has shot to stratospheric levels, climbing with such force that the entire market now reacts to its every earnings forecast, capex comment, and Jensen Huang metaphor about the "virtuous cycle of AI.”
When a single company starts steering the market’s mood, you know the stakes are high. Nvidia’s rise has been spectacular. Its potential fall could also be spectacular.
If there’s a crash in the current market, undoubtedly tech goes first, and AI-tied shares are poised to lead the plunge. Not because the companies are bad, but because valuations are sky-high, crowded, and pumped by shady-looking multi-billion-dollar deals.
🧨 2. Sky-High Valuations Fall the Hardest
AI has been the market’s darling. And like any hot market corner, the exit door gets crowded when the music stops.
These stocks work great in a liquidity-rich, momentum-heavy environment. But in a deep correction, they can drop first and fastest.
Why?
They’re relatively expensive.
They’re owned by institutions (by boatloads).
They’re deeply intertwined with leverage.
When selling starts, it spreads: chips, software, cloud. Really anything with “AI initiative” mentioned in the last five earnings calls.
If the correction deepens, correlations go to 1 , and “diversification” starts to feel like a theoretical concept.
🧺 3. Staples Can Survive. But Aren’t Safe.
What tends to hold up in a downturn?
Companies that produce things people buy every day.
Coca-Cola NYSE:KO , Procter & Gamble NYSE:PG , Walmart NYSE:WMT , Costco NASDAQ:COST . These are the boring giants who don’t need AI hype to sell toothpaste, detergent, and caffeine.
But here’s the catch.
When tech crashes, fund managers don’t just sell tech.
They sell everything with liquidity to buy the tech names they've been waiting to own at a discount.
That includes consumer staples. Even the defensive darlings can get dumped to fund someone’s impulsive “NVDA is finally cheap!” moment.
🧭 4. Corrections Have Phases. Know Which One You’re In.
Corrections tend to move in waves:
Denial: “This is just a dip.”
Realization: “This is not a dip.”
Capitulation: “Sell everything.”
Bargain hunting: “Wait… everything is on sale.”
Recovery: “We survived. Buy up!”
Don’t confuse early weakness with late-stage panic.
Ideally, you want to buy when everyone else is emotionally unavailable, not when they’re still debating if it’s a pullback or an opportunity.
📊 5. Liquidity Matters More Than Fundamentals
In a deep correction, fundamentals usually take a backseat.
Everything becomes about liquidity.
Who needs cash?
Who has margin calls?
Who needs to rotate?
Which institutions need to de-risk?
This is why great companies drop alongside mediocre ones.
Liquidity can trump logic.
Market structure can trump valuation.
And algos don’t care that you really like that stock long-term.
🧘♂️ 6. Your Mindset Is a Position Too
Corrections can provoke every trading impulse, especially if they're steep and you expect a quick rebound:
Revenge trades
Over-leveraged dip buying
Premature bottom-calling
The hardest thing during a deep correction isn’t predicting the bottom, but not losing your head (and cash) before the bottom arrives.
Pro traders work with a few rules that help them avoid emotional decision making:
Pre-set drawdown limits
Scaling entries
Non-negotiable stop-losses
Portfolio hedges
Cash as an asset
If you don’t have a playbook before the drop, you’ll be writing one during the drop.
🛒 7. Buy the Best, Not the Loudest
When markets crack, everything goes on sale, everyone knows that.
Before you go bargain hunting and deep discount shopping, prioritize:
Cash-generating giants
Companies with pricing power (and moat)
Firms selling essentials in whatever industry
Businesses that don’t rely on hype to survive
🧾 The Takeaway
A deep correction may not be the end of the world, but it could be the market’s way of redistributing opportunity.
Nvidia and the AI titans have been running the show. And they’ll likely lead any sharp selloff.
And yes, even your safe, boring consumer staples can get dragged into the downside.
But corrections create clarity. They separate narrative from value, hype from durability, and momentum from substance.
If you stay disciplined, patient, and unemotional, a correction becomes less of a threat and more of a roadmap, pointing you toward assets worth owning when the next bull run begins.
Off to you : What’s your take on the current market situation? Do you see a bubble in the works, ready to go pop? Or it’s all looking fine and dandy, no reason for caution?

When Generals Run and Soldiers Nap — The Market’s Odd ParadeEver seen an army march where the generals sprint ahead, but the soldiers just yawn and stay behind?
That’s exactly what’s happening in the U.S. futures battlefield right now.
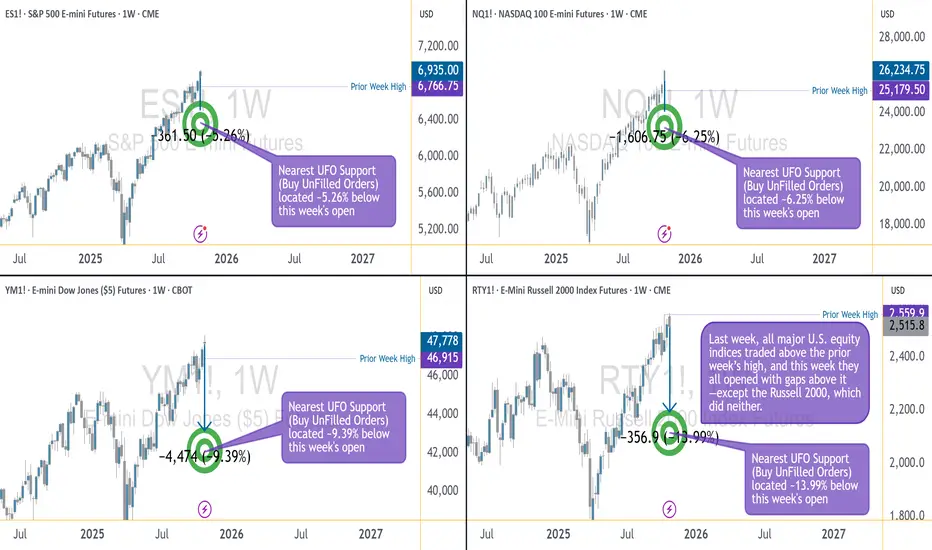
The ES, NQ, and YM — our large-cap “generals” — opened the week above their prior highs, looking ready for victory speeches. But the RTY, representing small caps, is still lagging like it hit the snooze button.
The Breadth Problem
Healthy rallies need everyone on board. When small caps don’t join the charge, it’s like running a marathon with only one leg — you might move forward, but not for long.
That’s why this gap between the big guys and the small ones is called bearish divergence — momentum without muscle.
How Deep Could It Go?
Under the surface, liquidity pockets (UFO supports) show the “landing zones” below price:
ES: ~5% lower
NQ: ~6% lower
YM: ~9% lower
RTY: ~14% lower (!)
Translation: if the market trips, the generals may bruise a knee — but the soldiers could roll down the hill.
Tick, Margin, and Scale
CME index futures come in two flavors — E-minis for the pros, Micro E-minis for precision control:
S&P 500 (ES/MES): tick 0.25 → $12.50 / $1.25; margin ≈ $21K / $2.1K
Nasdaq 100 (NQ/MNQ): tick 0.25 → $5 / $0.50; margin ≈ $30K / $3K
Dow Jones (YM/MYM): tick 1 → $5 / $0.50; margin ≈ $13K / $1.3K
Russell 2000 (RTY/M2K): tick 0.10 → $5 / $0.50; margin ≈ $9K / $0.9K
(Approximate numbers, educational only.)
The Lesson
Breadth divergences don’t “predict” the end of the rally — they just whisper: “Careful, this parade’s out of sync.”
So before chasing the next breakout, remember:
even the best generals can’t win a war if their soldiers stay in camp.
Want More Depth?
If you’d like to go deeper into the building blocks of trading, check out our From Mystery to Mastery trilogy, three cornerstone articles that complement this one:
🔗 From Mystery to Mastery: Trading Essentials
🔗 From Mystery to Mastery: Futures Explained
🔗 From Mystery to Mastery: Options Explained
When charting futures, the data provided could be delayed. Traders working with the ticker symbols discussed in this idea may prefer to use CME Group real-time data plan on TradingView: www.tradingview.com - This consideration is particularly important for shorter-term traders, whereas it may be less critical for those focused on longer-term trading strategies.
General Disclaimer:
The trade ideas presented herein are solely for illustrative purposes forming a part of a case study intended to demonstrate key principles in risk management within the context of the specific market scenarios discussed. These ideas are not to be interpreted as investment recommendations or financial advice. They do not endorse or promote any specific trading strategies, financial products, or services. The information provided is based on data believed to be reliable; however, its accuracy or completeness cannot be guaranteed. Trading in financial markets involves risks, including the potential loss of principal. Each individual should conduct their own research and consult with professional financial advisors before making any investment decisions. The author or publisher of this content bears no responsibility for any actions taken based on the information provided or for any resultant financial or other losses.
Generals Charge, Soldiers Stall: Reading Bearish Divergence1. Context: The Battle Line Between Large and Small Caps
This week’s futures landscape paints a striking contrast between leadership and hesitation. In the CME equity index universe, the large caps — ES (E-mini S&P 500), NQ (E-mini NASDAQ 100), and YM (E-mini Dow Jones) — advanced as a united front, all opening above their prior week’s highs. The market generals were charging confidently uphill.
Yet, on the same battlefield, the RTY (E-mini Russell 2000) lagged behind. The small caps failed to take out the prior week’s high and opened below the aggressive gaps that marked their larger counterparts. In trader terms, breadth was narrowing. In storyteller terms, the generals were calling “forward!” — but the soldiers weren’t following.
Such divergences in participation often mark transition zones in market psychology. When large caps push while small caps stall, it doesn’t necessarily mean the campaign is lost — but it does mean confidence among the broader troops is weakening.
2. Reading the Divergence: When Breadth Narrows
The relationship between large-cap and small-cap indices often reveals more than just price action — it exposes the structure of conviction. In sustained bullish environments, small caps tend to lead or at least confirm the move. Their participation signals that risk appetite is healthy across the field, not confined to the biggest names.
When that breadth fades, the advance becomes fragile. A rally driven only by mega-cap components (the generals) can stretch further, but with decreasing participation, it becomes increasingly vulnerable to shocks. Traders who watch intermarket behavior know this phenomenon as bearish divergence — higher highs in the generals, lower or flat highs in the soldiers.
From a practical standpoint, narrowing breadth implies that fewer sectors are carrying the index higher. In other words, the market’s engine is running on fewer cylinders. This is not a timing trigger on its own, but it is a powerful contextual clue suggesting that volatility could expand when the leadership stumbles.
3. Quantifying the Risk: Supports and Market Depth
Looking beneath price, Order Flow (UnFilled Orders) provides a sense of where liquidity may reside once the current rally pauses. Key UFO support zones, acting as potential demand clusters, reveal how far the market might travel before encountering fresh buy interest.
From this week’s open:
ES shows its next support roughly 5.26% below current levels.
NQ sits around 6.25% below.
YM’s cushion lies approximately 9.39% beneath.
RTY, however, faces a much deeper air pocket — the next notable UFO support sits nearly 13.99% lower.
This asymmetry is critical. If markets retreat, small caps have the most unprotected downside terrain before reaching meaningful support. In other words, the generals may fall back a few miles, but the soldiers could tumble down the hill.
These percentages don’t guarantee a move — they outline the potential amplitude of correction if risk-off flows accelerate. The deeper the distance to support, the larger the volatility zone beneath.
4. Strategic View: Large Caps Lead, but Are They Overextended?
The current setup puts traders in a classic tactical dilemma:
Are the generals inspiring a new advance, or are they overextended and exposed?
Two plausible scenarios emerge:
Continuation scenario: If the small caps (RTY) regain strength and take out their prior week’s high, the breadth gap could close. This would validate the generals’ move and reestablish a broad-based advance.
Correction scenario: If RTY continues to stall while ES, NQ, and YM fail to sustain their gaps, it would confirm a divergence-led weakening. A close back below prior week’s highs could trigger a retreat toward the support zones identified earlier.
The idea is not to predict a reversal, but to prepare a framework in case weakness unfolds.
5. Contract Overview: E-mini and Micro Versions
To analyze or engage these markets, traders can study both E-mini and Micro E-mini contracts listed on the CME. These contracts represent standardized ways to participate in U.S. equity index movements, but at different notional sizes.
E-mini contracts (ES, NQ, YM, RTY) are the long-standing institutional benchmark instruments that track major U.S. equity indices with efficient liquidity and tight spreads.
Micro E-mini contracts (MES, MNQ, MYM, M2K) provide the same exposure pattern at one-tenth the size, offering more granularity in risk management and flexibility for smaller accounts or precise hedging.
It’s important to understand that these futures allow directional and hedging applications without requiring ownership of the underlying equities. However, as with any leveraged product, margin requirements can amplify both gains and losses. Traders should familiarize themselves with margin-to-equity ratios and maintenance requirements before participation.
S&P 500 – ES / MES
Minimum tick: 0.25 points
Tick value: $12.50 (E-mini) | $1.25 (Micro)
Typical margin: ≈ $21K (E-mini) | ≈ $2.1K (Micro)
NASDAQ 100 – NQ / MNQ
Minimum tick: 0.25 points
Tick value: $5.00 (E-mini) | $0.50 (Micro)
Typical margin: ≈ $30K (E-mini) | ≈ $3.0K (Micro)
Dow Jones – YM / MYM
Minimum tick: 1 point
Tick value: $5.00 (E-mini) | $0.50 (Micro)
Typical margin: ≈ $13K (E-mini) | ≈ $1.3K (Micro)
Russell 2000 – RTY / M2K
Minimum tick: 0.10 points
Tick value: $5.00 (E-mini) | $0.50 (Micro)
Typical margin: ≈ $9K (E-mini) | ≈ $0.9K (Micro)
Please note that all margin requirements are approximate and may be adjusted.
6. Risk Management Spotlight
Breadth divergences can test patience and positioning discipline. Managing exposure becomes as important as analyzing the signal itself.
Here are three core reminders:
Position Sizing: Adjust to volatility. If the distance to the nearest support is wide, scale down accordingly to maintain a consistent risk percentage per trade.
Stop-Loss Discipline: Predetermine exit points based on technical invalidation, not emotion.
Capital Preservation: Capital is ammunition; running out of it limits participation when true opportunity returns.
In the end, risk management isn’t about avoiding loss; it’s about surviving long enough to thrive when clarity returns. When markets are divided between generals and soldiers, maintaining balance becomes a trader’s greatest edge.
7. Educational Takeaway
The “generals vs. soldiers” analogy reminds us that market structure is not just about price—it’s about participation. When large caps surge but small caps lag, it signals a potential exhaustion point in the broader advance. The healthiest rallies are those in which all troops move in sync.
For traders and investors, breadth divergences serve as an early-warning system, not a countdown clock. They encourage a review of exposure, tighter stop placement, and a shift toward risk-awareness rather than return-chasing.
At this stage, the technical setup across U.S. index futures reads like a fragile truce: ES, NQ, and YM maintain their gains above prior-week highs, while RTY still lingers below. Should the soldiers eventually follow, confidence could rebuild. But if the generals start retreating first, the path toward their UFO supports could unfold quickly.
The core takeaway: breadth divergences don’t predict timing—they illuminate imbalance. Recognizing that imbalance early allows traders to respond intelligently instead of react emotionally when volatility expands.
When charting futures, the data provided could be delayed. Traders working with the ticker symbols discussed in this idea may prefer to use CME Group real-time data plan on TradingView: www.tradingview.com - This consideration is particularly important for shorter-term traders, whereas it may be less critical for those focused on longer-term trading strategies.
General Disclaimer:
The trade ideas presented herein are solely for illustrative purposes forming a part of a case study intended to demonstrate key principles in risk management within the context of the specific market scenarios discussed. These ideas are not to be interpreted as investment recommendations or financial advice. They do not endorse or promote any specific trading strategies, financial products, or services. The information provided is based on data believed to be reliable; however, its accuracy or completeness cannot be guaranteed. Trading in financial markets involves risks, including the potential loss of principal. Each individual should conduct their own research and consult with professional financial advisors before making any investment decisions. The author or publisher of this content bears no responsibility for any actions taken based on the information provided or for any resultant financial or other losses.

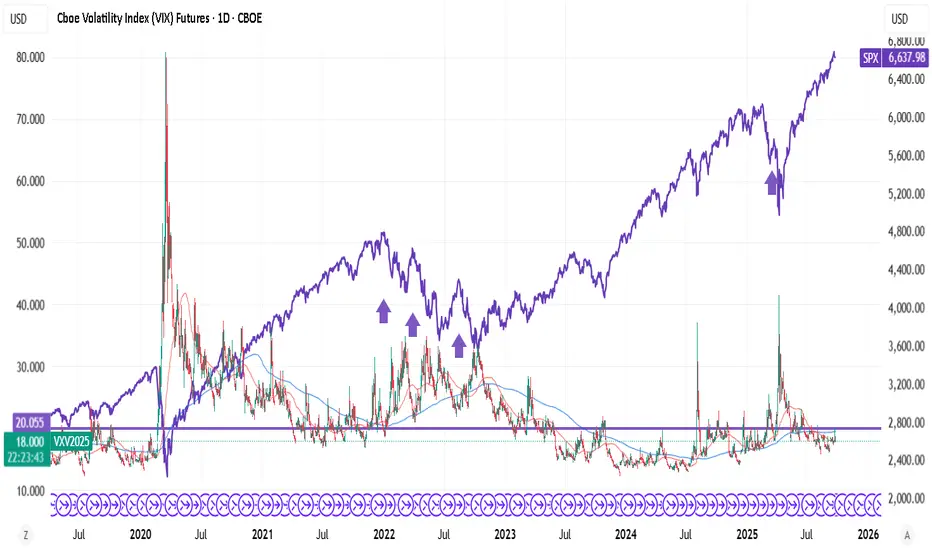
VIX FUT trending above 20 - high probability SPX crash indicatorVIX never trends above 20. You lose money buying VIX FUT above 20.
In nutshell, VIX FUT supporting at 20 is a guaranteed crash - for low risk positions.
Corrective Dip or New Downtrend on the S&P 500 Futures?🟣 1. Impulses vs. Corrections – The Classical View
When price trends, it doesn't move in a straight line. Instead, it alternates between directional movements called impulses and counter-directional pauses or retracements known as corrections. Most analysts define an impulse as a sharp, dominant move in the direction of the trend—typically accompanied by rising volume and momentum indicators. Corrections, on the other hand, tend to be slower, overlapping, and often occur with declining volume.
Common methods to identify impulses vs. corrections include:
Swing structure: Higher highs and higher lows suggest impulse; overlapping lows suggest correction.
Fibonacci retracements: Corrections often retrace up to 61.8% of a prior impulse.
Moving averages: Price above a rising MA is often viewed as impulse territory.
Volume analysis and oscillators such as RSI or MACD are used to confirm price behavior.
Despite the abundance of methods, the distinction between impulses and corrections often remains subjective. That’s where the Directional Movement Index (DMI) provides an objective lens—especially when paired with price action.
🟣 2. Rethinking Impulses with the DMI Indicator
The Directional Movement Index (DMI), developed by J. Welles Wilder, offers a quantitative way to assess the strength and direction of price movement. It breaks down market activity into three components:
+DMI (Positive Directional Movement Index): Measures the strength of upward movements.
−DMI (Negative Directional Movement Index): Measures the strength of downward movements.
ADX (Average Directional Index): Quantifies overall trend strength but is optional in this discussion.
The key to applying DMI lies in the crossover between +DMI and -DMI:
When +DMI > -DMI, upward price moves dominate—suggesting bullish impulses.
When −DMI > +DMI, downward moves dominate—suggesting bearish impulses.
Calculation is based on a comparison of successive highs and lows over a specific lookback period—commonly set to 14 or 20 periods.
While EMAs track trend direction and momentum, DMI helps dissect who’s in control. This makes it a powerful filter when evaluating whether a breakdown or breakout is likely to become an impulsive trend—or just another correction in disguise.
🟣 3. Case Study – Two Breakdowns, Two Outcomes
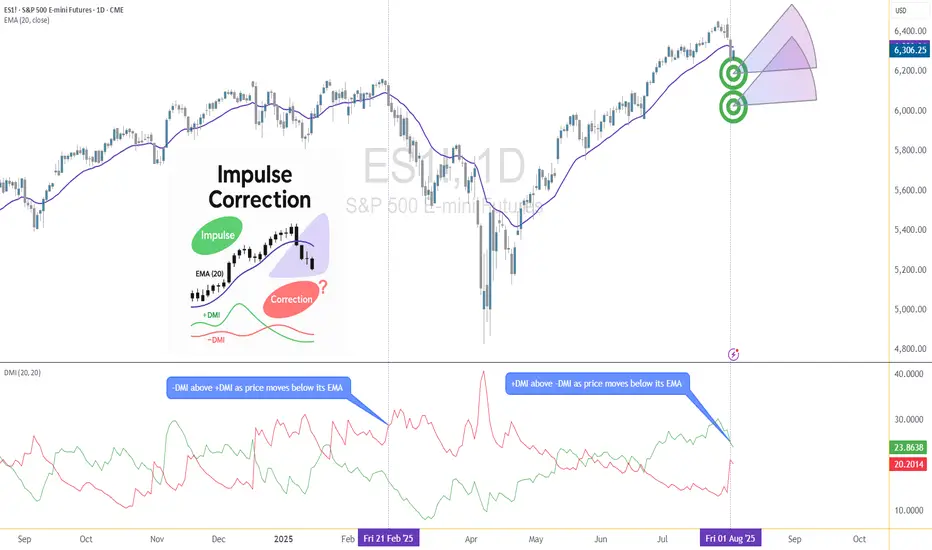
Let’s apply this logic to two recent moments on the E-mini S&P 500 Futures (ES) daily chart.
🔹 Feb 21, 2025 Breakdown
Price broke sharply below the 20-period EMA. At first glance, this looked like a potential trend reversal. The DMI confirmed this suspicion: −DMI surged above +DMI, signaling downside impulses were in control. The market followed through with a clear downtrend, confirming the move was not just a pullback—it was a shift in market structure.
🔹 Aug 1, 2025 Breakdown
A similar sharp break below the 20 EMA just occurred again. However, this time +DMI remains above −DMI, despite the bearish price action. This divergence tells a different story: the breakdown may not be impulsive in nature. Instead, it's likely a corrective dip within a broader uptrend, where buyers are still the dominant force.
This is a textbook example of how a moving average crossover without DMI confirmation can mislead traders. By combining these tools, we’re able to make more informed decisions about whether price action is signaling a true shift—or just a pause.
🟣 4. CME Product Specs – ES vs. MES
Traders can express directional views on the S&P 500 using two primary CME futures contracts: the E-mini S&P 500 Futures (ES) and the Micro E-mini S&P 500 Futures (MES). Both track the same underlying index but differ in size, capital requirement, and tick value.
✅ E-mini S&P 500 Futures (ES)
Symbol: ES
Contract Size: $50 x S&P 500 Index
Tick Size: 0.25 index points
Tick Value: $12.50
Initial Margin: Approximately $21,000 (varies by broker and through time)
Market Hours: Nearly 24/6
✅ Micro E-mini S&P 500 Futures (MES)
Symbol: MES
Contract Size: $5 x S&P 500 Index
Tick Size: 0.25 index points
Tick Value: $1.25
Initial Margin: Approximately $2,100 (varies by broker and through time)
The Micro contract provides access to the same market structure, liquidity, and price movement as the E-mini, but with a fraction of the exposure—making it ideal for smaller accounts or more precise position sizing.
🟣 5. Risk Management Matters
Understanding whether a market move is impulsive or corrective isn’t just academic—it’s the difference between positioning with the dominant flow or fighting it. Traders often get trapped by sharp moves that appear trend-defining but are simply noise or temporary pullbacks.
Using tools like DMI to confirm whether directional strength supports price action provides a layer of risk filtration. It prevents overreaction to every EMA crossover or sudden price drop.
Stop-loss orders become vital in both impulsive and corrective conditions. In impulsive environments, stops help lock in profits while protecting from reversals. In corrective phases, they act as circuit breakers against breakouts that fail.
Moreover, knowing the product you're trading is critical:
A single ES contract controls ~$320,000 of notional value.
An MES contract controls ~$32,000.
This disparity means poor sizing on ES can magnify errors, while proper sizing on MES can offer flexibility to test, scale, and hedge with tighter capital control.
Whether you're reacting to price or preparing for continuation, risk management is the only constant. It’s what turns analysis into disciplined execution.
When charting futures, the data provided could be delayed. Traders working with the ticker symbols discussed in this idea may prefer to use CME Group real-time data plan on TradingView: www.tradingview.com - This consideration is particularly important for shorter-term traders, whereas it may be less critical for those focused on longer-term trading strategies.
General Disclaimer:
The trade ideas presented herein are solely for illustrative purposes forming a part of a case study intended to demonstrate key principles in risk management within the context of the specific market scenarios discussed. These ideas are not to be interpreted as investment recommendations or financial advice. They do not endorse or promote any specific trading strategies, financial products, or services. The information provided is based on data believed to be reliable; however, its accuracy or completeness cannot be guaranteed. Trading in financial markets involves risks, including the potential loss of principal. Each individual should conduct their own research and consult with professional financial advisors before making any investment decisions. The author or publisher of this content bears no responsibility for any actions taken based on the information provided or for any resultant financial or other losses.
18 Times, +2000%, 5800 Days - All About NASDAQ100 Corrections!Hi, all!
I need to repost some of my recent ideas on TradingView due to issues with the platform's moderation. Let's start! The most up-to-date post is coming right away - one that serves as a timely reminder during these interesting times: never forget history.
From November 2008 to February 2025, the Nasdaq 100 (NDX) index has grown by over 2000%! Yes, that’s a 20x increase! This tech giant, made up of the 100 leading technology stocks, has shown impressive strength.
For comparison, the S&P 500 has risen about 820% in the same period. A great performance but Nasdaq 100 leaves it far behind.
Has this been a straight-line rise? Not really. Looking back, it may seem like the perfect investment. But the road was not smooth. Nasdaq 100’s success came with painful drops, investor panic, and moments when it felt like the market would never recover.
From the outside, everything looks great. But would you sit through a 30% drop, while the news is screaming about the "end of the world"?
So, I decided to analyze every correction of 10% or more since the market bottom in 2008.
- How long do corrections and recoveries last?
- How often do they happen?
- What should investors know?
- Can this help you in any way?
DATA ANALYSIS - 18 corrections in Nasdaq 100 (2008–2025), -10% or more.
Retracement Stats:
- Average drop: -15%
- Median drop: -13%
- Biggest drop: -37.72%
- Smallest drop: -10%
Correction Length (17 completed corrections): How many days does a correction last from the peak to the bottom?
- Average: 60 days
- Median: 35 days
- Longest: 325 days
- Shortest: 14 days
Recovery Time: From bottom back to new highs.
- Average: 165 days (~5.5 months)
- Median: 119 days (~4 months)
- Longest: 752 days (over 2 years)
- Shortest: 42 days (~1.5 months)
Correction Frequency
If we take a rough estimate, in 5800 days, there were 18 corrections, which means a correction happens every 322 days (~10.5 months) on average.
Total Time Spent in Corrections vs. Rising Markets
- Corrections lasted 1016 days
- Recoveries lasted 2801 days
- Total time spent in "work mode": 3817 days
- Total "smooth uptrend" days: 1983 days (~5.4 years)
Basically, like a hardworking employee – the market spends more time struggling than rising!
What Can Investors Learn from This?
1. Accept Volatility
Knowing that market swings are normal, investors can keep a long-term perspective and avoid panic-selling during downturns.
2. Nasdaq 100 Has Always Recovered
In the long run, Nasdaq 100 has always bounced back to new highs. Each recovery has been different, but so far, making new all-time highs has never been a problem.
3. Make Better Decisions
Understanding psychological biases helps investors make rational choices and manage risks better.
4. Market Drops = Opportunities, Not Threats
Most big market rallies started when most investors were too scared to buy.
"A simple rule dictates my buying: Be fearful when others are greedy, and be greedy when others are fearful." – Warren Buffett
Market drops always feel unique and scary but history shows they follow repeating patterns. And those who keep their emotions in check have the best opportunities.
"The time to buy is when there's blood in the streets." – Baron Rothschild
Final Thoughts: Is the current retracement a buying opportunity? No one knows for sure but history suggests - stay calm!
So, that's all. Like & Boost if you find this useful! 🚀
Have great day,
Vaido
💬 Before you leave... What’s your take on the current Nasdaq 100 correction? Drop your thoughts in the comments 👇
UNI wave reversal case studyCase study for UNI/USDT chart.
see how the MTF Wave down started at the correction. up to the entry there were no fakedowns. The first Fakedown have a clear long entry similar to the ideal MTF Wave illustrated on the right...

The VIX: A Measure of Market FearThe VIX, or Volatility Index, is a measure of the expected volatility of the S&P 500 index over the next 30 days. It is calculated using the prices of options on the S&P 500 index. A higher VIX indicates that market participants are expecting more volatility in the future, while a lower VIX indicates that they are expecting less volatility.
The VIX is an important tool for investors because it can help them understand how risky the stock market is. A high VIX indicates that the market is expected to be volatile, which means that there is a greater chance of large price swings. This can make investing more risky, but it can also create opportunities for profit.
The VIX is also correlated with the S&P 500 index. This means that the VIX tends to move in the opposite direction of the S&P 500. When the S&P 500 falls, the VIX tends to rise, and when the S&P 500 rises, the VIX tends to fall. This correlation is not perfect, but it is strong enough to be useful for investors.
The VIX can be used in a variety of ways by investors. Some investors use the VIX to assess the risk of their portfolios. Others use the VIX to trade volatility, either by buying or selling VIX futures contracts. Still others use the VIX to hedge against risk in other assets.
The VIX is a complex and volatile asset, but it can be a valuable tool for investors who understand how to use it.
Here are some additional things to keep in mind about the VIX:
The VIX is not a direct measure of the volatility of the stock market. It is a measure of the expected volatility, which means that it is based on the opinions of market participants.
The VIX can be affected by a variety of factors, including economic news, political events, and natural disasters.
The VIX is not always accurate. It can sometimes overshoot or undershoot the actual volatility of the stock market.
Despite its limitations, the VIX is a valuable tool for investors. It can help investors understand the risk of the stock market and make informed investment decisions.
I hope this post is helpful.
This analysis represents my thoughts at the date it is posted.
This analysis does not represent professional and/or financial advice.
You alone assume the sole responsibility of evaluating the merits and risks associated with the use of any information or other content found on this profile before making any decisions based on such information.

MOMENTUMB and MARKET CORRECTIONHello everyone!
Today I want to draw your attention to the momentum and price correction.
In fact, any price movement consists of an impulse and a correction.
You can earn money on each of these phases.
Impulse
An impulse movement is a strong price movement towards the main trend.
As a trader, it is right that you should open positions in this direction.
This movement is quite easy to identify.
How correctly an impulse movement will spend less time covering a longer distance than a corrective movement.
The impulse has a large force that pushes the price in the right direction, so the movement is strong and fast.
Correction
The corrective movement is characterized by a smaller force of movement.
Very often, the correction will move in one corridor without much updating of the highs or lows.
The fact is that with a corrective movement in the price, there is not enough force to update the maximum or minimum.
The movement will be weak, resembling trampling on the spot.
Of course, you can earn money in such a period, but it will be more difficult to do this than when trading on impulse movement.
In addition , there is always a risk that the trend will pick up again and push the price against you and very quickly .
You simply won't have time to close a position if you haven't set a stop loss.
Support and resistance
It is important to note how the level from which the price makes a reaction is first support, then resistance when breaking through.
This is a frequent occurrence in all markets.
The impulse conceals a force that cannot break through the level immediately, so the correction begins and the accumulation of new energy to overcome the level.
After that, a breakdown occurs.
At this point, support becomes resistance.
The price during the correction, as we remember, does not have sufficient strength to update the maximum and the level becomes a resistance that the price cannot pass.
The correction rests on the level and failed to overcome it.
And this structure is quite common.
Conclusions
The main conclusion is simple - trade according to the trend.
Learn to identify impulse movement and corrective movement, so it will be easier for you to determine the trend.
Watch how the price reacts to the levels.
Traders, if you liked this idea or if you have your own opinion about it, write in the comments. I will be glad 👩💻

Wave Analysis Summaryhello traders
Some traders don't understand my analysis so I prepared this as a summary of what I learned in wave analysis

How the higher time frames help you to avoid unnecessary losses Hello everyone:
Today I want to discuss the importance of higher time frame analysis.
Doesn't matter what type of trading strategy, method or style you use,
the higher time frame often will help us to strengthen our bias overall and give us a good perspective of the possible direction for the price to go.
In addition, it helps traders to avoid unnecessary losses and mediocre entries that will eat up your profits.
More often I hear traders will execute trades on the lower time frames, and not factor the overall higher time frame bias and perspective.
Although entering on the smaller time frame can potentially give you more Risk:Reward, it's often more risky and trades can easily reverse, then hit the stop loss.
This often creates stress, negativity, and revenge trading psychology for traders which ended up blowing accounts.
I want to give a few examples of higher time frame analysis, how they can help traders to avoid “traps” on the lower time frames, avoid unnecessary losses, and keep the emotion at bay to trade another day.
When having a bullish bias on the HTFs, its good risk management to not consider any short term, bearish sell setups.
These sell setups may form on the LTFs, but they can easily not continue to your desired target, and reverse up before you have time to react.
In addition, traders hate to see profit come and go.
So if a trader has a short position running in some profit, but decides to hold onto the trade, and once the position reverses, traders don't want to exit, and then end up holding a losing position to its SL.
Examples:
AUDUSD:
HTF: Overall bias and perspective in bullish
LTF: Many LTF bearish setups/development, but due to going against the HTF, they ended up with losses
NZDUSD:
HTF: Overall bias and perspective in bullish
LTF: Many LTF bearish setups/development, but due to going against the HTF, they ended up with losses
AUDCHF:
HTF: Overall bias and perspective in bullish
LTF: LTF bearish setups/development, but due to going against the HTF, ended up with loss
NZDCHF:
HTF: Overall bias and perspective in bullish
LTF: LTF bearish setups/development, but due to going against the HTF, ended up with loss
NZDCAD:
HTF: Overall bias and perspective in bullish
LTF: LTF bearish setups/development, but due to going against the HTF, ended up with loss
SILVER:
HTF: Overall bias and perspective in bullish
LTF: LTF bearish setups/development, but due to going against the HTF, ended up with loss

How to analyze any market from scratch #3Hello everyone:
Many of you have asked me to continue making more of these analysing from scratch video, so I have prepared another one here for you today.
Not only will we refresh the previous 2 educational videos on this topic, I will go into a bit more details on the confirmation on the lower time frames with multiple examples in the chart.
Recall from the previous videos I made, when we want to analyze the chart from scratch, we always start:
1. From the higher time frames (HTF) to identify the impulse/correction phases of the market conditions so we can come up with a possible bias and direction of the current price.
2. Once we have a possible direction and bias, then we go down to the lower time frames (LTF) to also identify the impulse/correction phases which will lead to your confirmation and entry.
These are simple steps to follow, based on multi-time frame analysis, top down approach.
Many have told me it's not hard to identify the HTF’s impulse and correction, but what can be classified as a LTF confirmation before entry?
Let's take a detail look into a few examples:
A LTF confirmation is when the price is developing a few more price action structures/patterns that align with your HTF direction and bias.
These can be continuation/reversal corrections on the LTF; impulse phases on the LTF that go with your bias on the HTF; multiple corrections within the larger corrections (patterns within patterns)...etc.
The more of these LTF price actions you can identify, the more it strengthens your analysis and forecast on the HTF.
Thank you
Do check out my previous educational contents on this same topic to better learn my approach to analyse any market from scratch.
How to analyze any market from scratch #1
How to analyze any market from scratch #2

The Anatomy of a Bear MarketRecently, a lot of people have been talking about the possibility of a multi-year recession. I don't think that is a clear depiction of the current situation, but I am aware that the idea stems from a lack of understanding of bear market structures, and influence of market sentiment. So in this post, I'll be going over Ken Fishers' rules and conditions that must be met in order for a market to be clarified as a bear market, and how you can best position yourself to minimize downside risk.
This is not financial advice. This is for educational purposes only.
The Four Rules of a Bear Market
- The first rule is the two percent rule: a bear market typically declines by about 2% per month.
- Sometimes it declines by more than 2%, sometimes it’s less—but overall and on average, bear markets don’t often begin with the sharp, sudden drop some anticipate.
- If a bear does drop by more than 2% per month, there’s often a market counter-rally that can provide better opportunities for investors to sell.
- The three month rule: This rule advocates waiting three months after you suspect a peak has happened before calling a bear market.
- Rather than trying to guess when a market top might come, this rule ensures one has passed before taking defensive investment action.
- It provides a window of time to assess fundamental investment data, market action and possible bear market drivers.
- I often see lots of people call market tops and bottoms, and time the market perfectly, but it needs to be clearly understood that this isn't the right approach to understanding the market.
- Next, we have the the two-thirds / one-third rule.
- About one-third of the stock market’s decline occurs in the first two-thirds of a bear’s duration, and about two-thirds of the decline occurs in the final one-third.
- This was the case in the bear market caused by the financial crisis, as well as many other bear markets including that of 1973.
- Combining this with the three month rule, it also implies that if you have identified that a market has indeed begun its bear run, you might be better off taking profits/losses on your position, managing risk by increasing your cash holdings, and buying back when capitulation has happened.
- And finally, we have the 18-month rule.
- While bull market durations vary considerably, statistics demonstrate that the average bear market duration, since 1946, has only been 16 months.
- Very few in modern history last fully two years or longer.
- If you’re engaging a defensive investment strategy, you probably shouldn’t bet on one lasting so long.
- The longer a bear market runs, the more likely you’re waiting too long to re-invest.
- If you remain bearish for longer than 18 months, you may miss out on the rocket-like market ride that is almost always the beginning of the next bull run.
- Missing that can be very costly for investors.
So are we currently in a bear market?
- Based on the four rules above, there's a high probability that we are not in a bear market.
- Since I've uploaded this post, the market has bounced swiftly off the 100 moving average on the weekly.
- Just as the covid-induced drop of March 2020 turned out to be a 'buy the dip' opportunity, as opposed to the beginning of a bear market, the sharp correction we have seen since the beginning of this year goes against the first rule of the bear market.
- It’s critical not to call a bear market falsely, and this is a huge mistake that a lot of people make.
- If the market is just going through a correction (a short, sentiment-driven downturn of -10% to -20%), you’re better off riding through it and maintaining your portfolio.
- It is impossible to accurately and consistently time market corrections because of the way they behave.
- A correction can start for any reason or no reason. So if you believe that the economy is strong, and the fundamentals of the company you invest in remain solid, there's no need to sell off your holdings, especially when your actions are motivated by fear.
Conclusion
Bull market corrections are not fun, but it's important as an investor for you to be able to distinguish bear markets/recessions from bull market corrections. Choosing to undertake a bear market investment strategy and go defensive should be rare and shouldn’t be done by gut feel or by your neighbor’s opinion. Exiting the market is among the biggest investment risks you can take—if you’re wrong and you have a need for portfolio growth, missing bull market returns can be extremely costly.
If you like this educational post, please make sure to like, and follow for more quality content!
If you have any questions or comments, feel free to comment below! :)

Safe Haven Currency, How are they affected by global eventsHello everyone:
Want to talk a bit more about safe haven currency in the market.
Since the recent tension between Russia and Ukraine,
the safe haven currency could strengthen as a result of such uncertainty in the world.
We will take a look at some past history of these currency pairs,
how they react to the market at the time, and what could we reasonably expect in the current market conditions.
Safe Haven Currency
USD
JPY
CHF
It's in our interest to look for opportunities when a strong currency is paired with a weaker one.
This generally will move the price very impulsively with strong momentum.
Pair such as these below will potentially develop the best price action for good R:R trades.
AUDUSD
NZDUSD
USDCAD
GBPUSD
AUDJPY
NZDJPY
CADJPY
GBPJPY
AUDCHF
NZDCHF
GBPCHF
CADCHF
Always have good risk management when it comes to entering. Don't enter all the pairs, don't open too many positions,
and understand correlation between the currency pairs.
Thank you
DISCLAIMER:
-My forecast and analysis are NOT trading signals nor financial advice, you should not enter trades and invest solely on this information.
Jojo

Two Types of Elliot Wave CorrectionsWhen it comes to Elliot Wave Theory, we know of two different correction patterns .
On the left you can see the classic correction, which is less common in real market situations. On the other hand, the flat correction (right) occurs more frequently in the market, since modern price action is often characterized by fakeouts . In this case, a fakeout looks like a wave B making a new high above wave A. In most cases, traders would open a trade here due to a structural break, which then runs against them (bull or bear trap).
In the following table you can see how the respective correction patterns differ from each other and what you need to pay attention to.
It is very important that you learn how to use Fibonacci tools correctly so that you can calculate the wavelength properly. Maybe I'll do a separate educational post on the proper use of those tools in future.
Thank you very much for your attention,
Your RT

How to analyze any market from scratch (Impulse & Correction) #2Hello everyone:
I received positive feedback on the last video on how to analyze the market from scratch,
and many have told me to make more of these similar contents. So here we go :)
I will go through multiple examples of how I would analyze the market by following these simple steps:
Multi-time frame analysis (Top Down Approach) Start from HTF to LTF
Identify the Impulse Phase and Correction Phase
Identify whether the Corrections is Continuation or Reversal
HTF Bias > LTF Confirmation > LTF Entry
Any questions, comments or feedback welcome to let me know :)
Thank you
How to analyze any market from scratch #1
DISCLAIMER:
-My forecast and analysis are NOT financial Advice, you should not trade and invest solely on this information.
-There are many scammers & fakers impersonating me, my channels/platforms to scam people. Be very careful as I will NEVER private/direct message you first no matter what.

supports and resistances and how they convert ✔First of all lets start with the brief technical explanation and after that go through the analyse DOGE ✔
1 support( an imaginary line, level or area )
👍one of the most simplest technical tool that use for indicating the proper point for buyers to enter or purchase one stock
for using support line
we need more than tow price points that an asset doesn't fall below more than those points and using line to connect them
2 resistance ( an imaginary line, level or area )
👍unlike support line investors use it to figure out the place for exit or selling one stock
and for using resistance
exactly like support line we need more than tow price points and one line to connect them but we should pay attention to this point that asset doesn't ascend above those points
⏲how support and resistance line convert to each other ⏲
👍support and resistance can easily change to each others in simple word when acceptable penetration of the price happen in one line for next price hit (be touched by the price ) this line act as an opposite function
for example we have strong support area if the price stand below this line and stay away for awhile for next time when the price become close to this area it will works as a resistance for the price
3 breakout
👍usually indicates new trend
when the acceptable penetration happens by the price to one support or resistance in indirect way
for example we have strong support line and the price start to stands below the line and continue its movement here we have breakout
you can use horizontal line at the left corner of your charts at trading view for indicating your supports and resistances.
or using other tools like Rectangle or Ellipse and indicate support or resistance zone instead of simple line.
🚀🚀analyse of idea🚀🚀
here we have important daily trend line and strong support area 💣
so
If the price breaks this trend line and price stay above this line we expect gain for the price
and
our noticeable resistance line and our next target are located on the chart.
This is not financial advice, always do your own research.
🐳MAD WHALE🐋


CHFJPY - Identify These Moves - FULL Breakdown 📚A key part of technical analysis is to identify the different phases and patterns in the market.
So, what can we see?
- We can see that we're within a major ascending parallel channel and price has been respecting it. When price approaches either extremes of the channel, it rejects aggressively.
- There are 2 key phases at play here. The blue phase is the impulse and the red phase is the correction.
- The impulse phase is an upward movement and the corrective phase is a downward move
After identifying these phases, what next?
- So now that we know that the impulse phase ends at the upper limit of the channel, we know there's a corrective move coming back down to the channel support.
- If there's enough momentum, we can break the channel support and keep falling. As we're in an ascending channel, it is often a reversal pattern = there's a high chance that CHFJPY can come back down all the way to 109
- Now we need a trading plan to enter this trade
How do we trade it?
- The risk entry would have been at the rejection of the channel resistance
- The safe entry would be to identify when the impulse has ended. One way we can do this is by identifying when the uptrend has ended. This can be done by using a trendline (like the one we have) and watching for a break to indicate that the uptrend has ended and the next phase has begun.
Trade Idea:
Watch for the ascending red trendline to break and enter with stops above the channel.
First Target: Target the channel support for first targets (500pips)
Second Target: The bottom of the channel (1,600pips)
Hope this breakdown was helpful. If so, do leave a like and comment what you think!

5 Key Advices To Share With Trader Who Is Struggling In TradingHello everyone:
Lately many of you have messaged me about getting FOMO and entering trades without confirmations.
In addition you can't seem to “not” enter trades when the market hasn't shaped up to your strategy and entry criteria.
I am hoping in today’s educational video it can help some of you guys to get back on track.
I want to share 5 main pieces of advice that can help out traders who are currently struggling.
These are experiences and lessons that I accumulate throughout the 8 years of trading and in hope to help some of you who are struggling in your current journey of trading.
1. Do “NOT” think about get rich quick in trading
-Trading is a marathon, not a sprint
-90-95% traders fail due to a combination of: Greed, FOMO, mindset/emotion, risk management, trading psychology.
-Trading is not a get rich quick scheme, but it can produce consistent, sustainable passive income if you can put in the time and effort
-Most try to jump to the result right away, without going through the journey, that is not how life works.
2. No trading strategies, style, method can give you 100% strike rate
-Trading is probability, not right or wrong.
-Understand you can have the best strategy in the world, and still not be profitable.
- Technical, Fundamental, Algo, EA...etc can all not work. This is why risk management is important to not over risk, over trade, over leverage your trading account
3. Backtest and journal
-Backtest your strategy so your brain acknowledges and recognizes it over and over again.
-Slowly build up confidence in your strategy and method. IT will come to you like second nature
-Journal all your wins and losses so you can review them. Work on them, accept your mistakes to grow and improve.
4. Control your EGO
-Human beings have ego to prove others are wrong and they are right
-We refuse to admit we made the error/mistakes, and blame others/external as the cause.
-Acknowledge that in trading, stop blaming the market, the broker, the mentor, the strategy...etc.
-Don't take things personally and be offended by it.
5. Never Give Up
-I blew several accounts in the beginning of trading career, gave up and quit trading multiple times
-I always ended up coming back to trading. After taking time off. Whether that is weeks or months in the beginning journey.
-No one is born into a trader, just like no one is born into a doctor, lawyer.
-If trading was that easy, then everyone would be rich.
-Success is measure by how many times you get back up when you failed
I hope these pointers can help you guys to get more focus and get back on track in trading.
Any questions, comments or feedback welcome to let me know, thank you
Jojo
Below I will share others educational videos that have direct relations to the topics above:
Trading Psychology: How to deal & manage losses/consecutive losses in trading ?
Trading Psychology: Revenge Trading
Trading Psychology: Fear Of Missing Out
Trading Psychology: Over Leveraged Trading
Trading Psychology: Is there Stop Loss Hunting in Trading ? How to deal with it ?
Prevent Blowing an account by backtesting:
Risk Management 101

How to analyze the market from scratch (Impulse & Correction)Hello everyone:
Many have asked me about demonstrating how to analyze the chart from complete scratch.
When looking at my chart and educational video, it all seems very simple, but many are telling me they are struggling to identify the market.
Today I will go over how I analyze the chart, from the Higher time frame down to lower time frame by using multi-time frame analysis, top down approach.
Specifically by identifying price action, impulse and correction phases of the market.
1. Start from the Higher Time Frame (HTF): HTF can be any time frame higher than the daily chart, such as monthly, weekly, daily.
Personally I like to use daily as a go to time frame as it is widely used by traders.
2. Identify the impulse phase of the market. Understand the impulse phase is a period of fast momentum,
price is either pushing up or down very aggressively, and not much consolidation visible on the HTF.
3. Identify a period of consolidations. Using trendlines, connect the swing highs and lows of the price.
This is to identify the correction/consolidation phase of the market.
Which is the most important aspect in price action analysis.
You will need to be very knowledgeable on the type of continuation, reversal correction patterns/structures the market usually will form.
(I will share many price action patterns/structures that I identify and use in the market below)
4. Once you identify the HTF phase of the market, you will then go down to the Lower time frames (LTF).
LTF can be anything under 2/1 HR, 30/15 Min charts. It's not a specific time frame, rather “Multi time frame analysis”.
You will also identify the impulse phases & Correction phases on the LTF and use trendlines to connect the swing highs and lows of the correction/consolidation phase, just like what we did on the HTF.
5. Now that you have both the HTF and LTF charts drawn out, the key here is to have both the HTF and LTF tell you the same direction/bias.
They should align up and have the same bullish/bearish bias. This will strengthen your probability of success.
I always make sure when I am about to enter any trades, I want the multi-time frames all telling me the same story. Same bias, same direction.
6. Now all that comes down to is forecasting the possible entries, which I have made many videos on this topic and I will share some below.
Understand you would always want to make sure you are either entering during the impulse phase on the LTF,
or the price is about to start the impulse phase to gain the upper hands in the market.
You do not want to enter when the price is in a consolidation which is why many traders end up losing money, stuck in the correction and price isn't moving too much, rather just sideways.
7. Continue to work on analyzing the chart from scratch, get comfortable at identifying the impulse phase in the market,
and do backtesting continuously so you identify the corrections in the market.
This will make you see the chart and the market completely different than before, and you will have a much better probability of entering trades that work out in your favour.
Any questions, comments or feedback welcome to let me know.
Jojo
Below I will share many educational videos that will help you to understand more on price action analysis, impulse/correction phase, entry, forecasting, backtesting and more.
Continuation and Reversal Correction
Identify a correction for the next impulse move in price action analysis
Multi-time frame analysis
Continuation Bull/Bear Flag
Parallel Channel (Horizontal, Ascending, Descending)
Reversal Ascending/Descending Channel
Reversal Rising/Falling Wedge
Reversal Double Top/Bottom
Reversal Head & Shoulder Pattern
Reversal “M” and “W” style pattern
Reversal Impulse Price Action
Continuation/Reversal Expanding Structure/Pattern
Risk Management: 3 different entries on how to enter the impulsive phrase of price action
Risk Management: How to Enter and set SL and TP for an impulse move in the market
Risk Management: When/How to move SL to BE and to profit in a running trade ?
How forecasting can benefit your trading journey
Backtesting & Chartwork on Forex Market
Backtesting & Chartwork on Indices Market
Backtesting & Chartwork on Crypto Market
How & Why I backtest:

When/How to move SL to BE and to profit in a running trade ?Hello everyone:
Today I want to discuss a topic in Risk Management, specifically on when and how to move your STOP LOSS to BREAKEVEN or in PROFIT when you have a running profit trade/position.
In an impulsive phase of the market, we want to make sure to protect our entry as well as secure profits.
In this example of EURUSD, I managed to get 2 entries in, and manage it to my best ability and secure profits
Trade close down for +7.9% profit
Original Trade Forecast and Analysis:
This is a topic that will have various answers across traders, as this is certainly up to each individual trader’s strategy, style, and management approach.
So understand there is no right or wrong, “holy grail” kind of decision.
It's up to you individually as a trader. I will share my management, and why I choose to go with these types of approaches, and you can certainly use them to your advantage to tweak/modify them to fit your strategy.
Few things to keep in minds are:
1. Moving the SL to BE or/and in profit is a way to protect your entry, as well as secure profit.
2. Sometimes moving the SL too early may “choke” the price, and you can get stopped out for BE or small profit. Then watch the price take off in your desired direction, which can create negative emotion.
3. Whereas sometimes if you don't move SL to BE or in profit, you can watch a trade that hits 3:1 RR or more, end up reversing down, passing your entry point and to your actual SL of -1%, which can also create negative emotion.
4. No perfect scenario or management when it comes to the aspect of trading, as every trade is unique, and different outcomes may happen, since the market itself is not perfect, and can do whatever it wants to do.
Now, I will explain my own management when it comes to moving SL to BE or/and in profit.
Certainly this is NOT the only way, nor it will be the best way, but over the years of backtesting & chartwork have given me reassurance on these types of management ways.
I will then show some real live examples on the trades that I closed down, and how I manage them as well.
CADJPY -
Original Trade Forecast and Analysis:
GBPJPY -
Original Trade Forecast and Analysis:
CHFJPY -
Original Trade Forecast and Analysis:
NASDAQ -
AUDNZD -
Original Trade Forecast and Analysis:
First, a general rule of thumb for me. IF the price has hit about 1:1 RR or so, and has broken past the previous recent lows,
I will move my SL to BE. There is no exception in this rule.
Again, I explained earlier that sometimes this will help you to protect your entry when price reverses, and sometimes it will choke the price.
In this case, I would rather take a BE first, and re-look for entry again in the same position, as long as the bias and the price action is still valid on both the higher time frame and lower time frame.
Second, once the entry is in some profit, say 2:1 or higher, I generally will move the SL up to about +0.5% profit or so.
Just want to secure a little profit while not choking the price entirely.
Third, once the entry is in 3:1 profit, then I will move my SL to +1% profit.
This is where I generally will decide whether I should take full profit here, or hold the trade for a mid-long term if the higher time frame has given me the bias.
Fourth, since the trade has already been in 3:1 profit or higher, generally we can expect a continuation correction to form now after the impulse phase.
If it's a smaller correction and price isn't reversing up sharply right away, I will move my SL to about +1.5% profit, set my alert above the continuation correction and observe the development of the correction.
This is generally a point where I can decide to hold the trade longer, or if it reverses up from the continuation correction, then exit the trade for profit.
Fifth, if we start to see a possible reversal development, then I will move down my SL to the recent swing highs/lows,
or just above the reversal correctional structure, and will let the trade tag me out for profit if it reverses.
Any questions, comments or feedback welcome to let me know :)
If you enjoy these contents, and the educational lessons are helpful, please press like, subscribe and follow for more.
Jojo
