The Dollar as a Liquidity Gauge: Why the 20 EMA on DXY Matters Most people frame markets as “risk on / risk off.”
I prefer to think in liquidity conditions.
The U.S. Dollar Index (DXY) sits at the center of global markets.
Equities, crypto, commodities, and FX all respond — directly or indirectly — to how tight or loose dollar liquidity is.
This chart shows why a simple 20 EMA often explains more than narratives.
How I read DXY (simple framework)
• Above a rising 20 EMA
→ Dollar strength pressures global liquidity
→ Risk assets often struggle to expand
• Below a falling 20 EMA
→ Dollar pressure eases
→ Liquidity conditions improve across markets
• Sharp extensions away from the 20 EMA
→ Frequently followed by mean reversion — not due to opinion, but because momentum stretched too far, too fast
This isn’t about calling tops or bottoms.
It’s about understanding when the dollar acts as a headwind vs a tailwind.
What the recent move tells us
Notice how DXY:
• Broke down through short-term structure
• Accelerated away from the 20 EMA
• Is now reacting back toward that mean
That sequence alone helps explain why you often see:
• Equities turn green during dollar weakness
• Risk assets stall or pull back as DXY regains footing
No prediction required — the mechanics are visible.
Why this matters
The dollar doesn’t trade in isolation.
It quietly sets the environment other assets must operate within.
Tracking where DXY sits relative to its short-term trend helps you:
• Avoid emotional reactions to headlines
• Distinguish structural moves from reflexive ones
• Stay aligned with liquidity, not noise
I’ll continue using simple tools like EMAs and structure to explain how markets behave, not what they “should” do.
Markets evolve.
Liquidity leaves footprints.
DXY

The Yield Curve: A Forex Trader’s Early Warning SystemTradingView added the Yield Curves tab (found at the bottom right of your chart) to their UI last Year and constantly improved upon it. At first glance, it looks like a tool just for bond traders. But even though I am not a bond trader (yet), I started wondering: Can we use this as an early indicator for Forex trading?
The short answer is YES . While Forex traders usually watch price action and news, bond yields often move before the news hits the screen. In this write-up, I will show you how to use this "hidden" signal to stay one step ahead of the market.
First things first: How to Recreate My Charts
If you want to track this yourself on TradingView, search for these two symbols:
- US10Y - US02Y: This shows the "Spread" the gap between long and short rates.
- FRED:DFF: This shows the actual daily interest rate set by the Federal Reserve.
By overlaying these, you can see exactly when the bond market (the Spread) moved before the Fed (the Rate).
The Basics: What is a Bond Yield? (The Seesaw Rule)
To understand the chart, you only need to know Bond prices and yields move like a seesaw.
- When traders buy bonds: The price goes up, and the yield goes down.
- When traders sell bonds: The price goes down, and the yield goes up.
Why do we care? Yields represent the "market's opinion" on interest rates. If yields are falling, the market is betting that the Fed will cut interest rates soon. If yields are rising, the market expects rates to stay high. Because interest rates drive currency value, the yield curve is the ultimate indicator of what "Smart Money" is doing before the news goes public.
The Simple Math (The "Seesaw")
Bond yields and bond prices move on a seesaw. When one goes up, the other must go down because the interest payment (the "coupon") is fixed.
Think of a bond as a fixed contract that never changes. If you own a bond that pays exactly $50 a year, that $50 is locked in.
- Scenario A: You buy a bond for $1,000 that pays $50 interest. Your yield is 5% ($50 / 1,000).
- Scenario B: (Low CPI): Suddenly, a low inflation (CPI) report comes out. Investors get excited because they think the Fed will cut interest rates soon. They rush to buy your bond. Because everyone wants it, the price of your bond rises to $1,100.
The Result: The bond still only pays that fixed $50. But because the new buyer paid $1,100 for it, their yield is now only 4.5% ($50 / 1,100).
Simple English: You are paying more money (higher price) to get the same fixed reward. Therefore, your percentage of profit (yield) goes down.
Summary so far:
Low CPI: The market anticipates lower interest rates in the future.
The Action: Traders rush to lock in today's higher rates by buying bonds.
The Result: Bond prices go up.
The Math: Higher price for the same interest = Lower Yield.
This is why you will see the US10Y yield drop on your TradingView chart the second a "cool" inflation report hits the news.
Setting the Scene: The "Early Indicator" Theory
In a healthy economy, a 10-year bond should pay more than a 2-year bond. Why? Because lending money for 10 years is riskier than lending it for 2 years. This is a "Normal" curve.
An Inverted Curve happens when the 2-year yield is higher than the 10-year yield. This is the market’s way of saying: "We think the Fed has pushed rates too high for the 'Now,' and they will be forced to cut them in the 'Future' to save the economy."
The Timeline: 2019 to Today (Context to the Chart Above)
1. Aug. 2019: Pre-Covid Jitters The spread touches 0. The US-China trade war was slowing global growth. The bond market warned of a slowdown months before the pandemic.
2. Mar. 2020: Pandemic Shock The Fed cuts rates to 0.1%. The spread spikes as the market expects a massive recovery.
3. Mar. 2021: The "Transitory" Trap Inflation starts rising. The Fed says it’s temporary and keeps rates at 0.1%, but the spread starts falling. The bond market knew the Fed was wrong and that rate hikes were coming.
4. Mar. 2022: The Pivot The Fed finally hikes rates. The "Cheap Money" era ends. The 2-year yield spikes to keep up with the Fed.
5. Jun. 2022: Inflation Spike (KEY EVENT) (9.1%) Inflation hits a 40-year high. This is the "Panic Point." Investors realize the Fed must hike aggressively to break inflation.
6. Jul. 2022: The Great Inversion The spread falls below 0. The market signals a recession is coming. For the first time since 2008, the market decided that the "Now" was more risky than the "Future.”
7. Jul. 2023: The Bottom (KEY EVENT) (Soft Landing Bet) The spread hits its lowest point (-1.08%). Inflation drops to 3%, but jobs stay strong. The market starts betting that we might avoid a crash. The spread begins to rise.
8. 2022–2024: The Long Wait The longest inversion in history (26 months). The economy was "immune" to high rates because of 3% mortgages and corporate cash.
9. Sep. 6, 2024: The Un-Inversion (KEY EVENT) (Soft Landing Confirmed) The Golden Signal. The curve turns positive. This wasn't because of a crash, but because inflation was defeated. The bond market confirmed the Soft Landing 12 days before the Fed’s first 0.50% cut.
10. Jan. 2026: Normalization We are here today. The spread is stable at +0.68%. The Fed rate is 3.50%. The curve is healthy again.
The Takeaway
The Rule: The bond market represents "Smart Money."
The Signal: A rising spread usually means the market expects rate cuts or economic strength.
For Forex: If the spread rises before the Fed cuts, it’s an early signal to look for Dollar weakness.
The next time you see the US10Y - US02Y line making a big move on your chart, don't wait for the Fed meeting. The bond market has already made its decision. If the spread is rising, the market is "pricing in" a weaker dollar or a rate cut. As Forex traders, that is our cue to look for setups.
Think of it this way: The spread is a "Confidence Meter."
Falling Spread: "We are worried the Fed is hiking too much."
Rising Spread: "We are excited the Fed is finally cutting rates to help the economy."
*** Congratulations for making it this far! Let me know in the comments if you use or plan to use these early indicators.

How Intermarket Signals Could Help to Avoid Major CrashesThree Crashes, One Pattern
I've been testing whether intermarket analysis can help avoid major drawdowns when selling weekly puts. Here's what the data shows across three very different market crashes:
COVID Crash (Feb-Mar 2020)
Drop: -914.75 points (-22.87%)
Duration: 29 bars, 41 days
Signal: BEAR fired in mid-February, BEFORE the crash
The macro composite dropped sharply as bonds rallied (flight to safety), credit weakened, and VIX exploded. The signal went red weeks before the worst of the selling.
2022 Bear Market (Jan-Jul 2022)
Drop: -837.25 points (-15.25%)
Duration: 137 bars, 199 days
Signal: BEAR fired in early January, stayed red through most of the decline
This was a slow grind lower as the Fed tightened. The indicator stayed in BEAR mode for most of the year, keeping me flat during the worst of it. Notice how the red background covers almost the entire decline.
April 2025 Tariff Crash
Drop: -770.25 points (-13.35%)
Duration: 6 bars, 10 days
Signal: BEAR fired in late March, BEFORE the drop
The fastest of the three crashes - just 10 days. But the macro signals still deteriorated first. Credit (JNK) weakened, volatility spiked, and the composite crossed below its signal line before price collapsed.
The Pattern
Three different causes (pandemic, Fed tightening, tariffs). Three different timeframes (41 days, 199 days, 10 days). But in each case, the macro signals deteriorated BEFORE equities fell hard.
The Core Idea
Markets don't move in isolation. Before major equity drawdowns, stress often appears first in:
TLT (Bonds) - Flight to safety begins
JNK (Credit) - High-yield weakens as credit risk gets priced
DXY (Dollar) - Strengthens as risk-off flows accelerate
VIX (Volatility) - Fear builds in the options market
The indicator normalizes each market using z-scores (standard deviations from 1-year average), then combines them:
Macro Score = (TLT + JNK) - (DXY + VIX)
When this composite trends down and crosses its signal line, conditions favor caution. When it trends up and crosses above, conditions favor risk.
Why This Matters for Put Sellers
Selling weekly puts has attractive math: 90%+ win rate, consistent premium. But the losses when they come are brutal (600% stop loss). One bad week can erase months of gains.
The question isn't IF a crash will happen. It's whether you're holding short puts when it does.
My 5-year backtest on ES 7DTE puts - using TastyTrades backtester:
Without Macro Filter:
357 trades | 96.1% win rate
Total P/L: +$63,492
Max Drawdown: 10.30%
Profit Factor: 2.90
With Macro Filter:
200 trades | 96.0% win rate
Total P/L: +$33,636
Max Drawdown: 2.91%
Profit Factor: 3.51
Key finding: 72% reduction in maximum drawdown.
Yes, fewer trades means less total profit. But avoiding the tail risk changes everything about position sizing and sleep quality.
Current Status: A Challenging Environment
Right now (January 2026), we're in a consolidation range. The macro score is hovering near flat, and with the 7-day EMA setting, signals are flipping almost weekly.
This is exactly the environment where the indicator struggles:
Range-bound price action
No clear macro trend
Frequent signal changes (whipsaws)
Difficult to follow systematically
I'm being transparent about this because it's real. The indicator seems to work well for catching major regime shifts but generates noise during consolidation phases.
Work in Progress
This is not a finished system. It's a research framework I'm actively developing. Areas I'm exploring:
Signal method variations - The indicator offers 7 different methods (EMA Cross, Slope, Momentum, Multi-Confirm, etc.). Some may handle consolidation better.
Longer smoothing periods - The current 7-day EMA is responsive but whipsaw-prone. Testing longer periods for range markets.
Regime detection - Adding logic to identify trending vs ranging environments and adjust sensitivity.
Combining with price filters - Using EMA20 or other price-based filters as secondary confirmation.
The goal is to reduce false signals during consolidation while maintaining the ability to catch major turns.
What It Catches vs. What It Doesn't
Works well for:
Major regime shifts with clear macro deterioration
Gradual credit/bond stress building over days or weeks
Events like COVID, 2022 bear market, April 2025 tariff crash
Struggles with:
Range-bound, choppy markets (like now)
Overnight gaps from surprise news
Idiosyncratic moves unrelated to macro
Short-term whipsaws in flat macro environments
How I'm Using It (Current Approach)
1. Check the indicator before opening new put positions
2. Clear RISK-ON (green, rising): Full position size
3. Clear RISK-OFF (red, falling): No new positions or reduce exposition
The "flat/choppy" category is new - I'm adding nuance rather than treating it as binary. When macro is unclear, I'd rather miss premium than get caught in a whipsaw.
The Honest Tradeoff
What you give up:
Fewer trades = less total premium
False signals in consolidation
Missed rallies when flat
Requires discipline to follow
What you gain:
Avoided COVID crash: -22.87%
Avoided 2022 bear: -15.25%
Avoided April 2025: -13.35%
Significantly better risk-adjusted returns
Ability to size up when conditions are clearly favorable
For me, avoiding those three crashes was worth the whipsaws in between. Your risk tolerance may differ.
Try It Yourself
I've published the indicator with multiple signal methods so you can test what works for your approach:
EMA Cross (what I use) - Classic crossover
Slope - Simple trend direction
Momentum - Rate of change threshold
Multi-Confirm - Requires 4+ methods to agree (more conservative)
Indicator in related ideas below.
What's Next
I'll continue refining this approach and will share updates as I find improvements. Specific things I'm testing:
Longer EMA periods for the signal line
Adding a "flat zone" where macro is inconclusive
Combining macro with price structure (above/below key MAs)
Different parameter sets for trending vs ranging markets
If you have ideas or are working on something similar, drop a comment. This is open research, not a black box.
Final Thought
Three crashes. Three different causes. Three times the macro signals warned before price collapsed.
Is it perfect? No - the current consolidation proves that. But when the big moves come, they tend to show up in credit, bonds, and volatility first.
I'd rather deal with some whipsaws during flat markets than be holding short puts when the next -15% hits.
---
What macro signals do you watch? How do you handle range-bound environments? Let me know in the comments.

FOMC and Market Reactions – Simple Logic Explained💎MJTrading:
The Federal Open Market Committee (FOMC) guides U.S. interest rates. Their decisions ripple through all major markets, not just the dollar.
🔑 How It Works (Simple View):
- When the Fed signals higher rates, the USD demand rises (investors seek higher returns), while gold, stocks, and crypto often fall because money becomes “more expensive.”
- When the Fed signals lower rates or slows tightening, the USD loses demand, and money flows into assets like gold, stocks, and crypto.
🔍 Why a Rate Cut Weakens the Dollar:
* Cutting rates means borrowing money becomes cheaper.
* Investors earn less return by holding USD in banks or bonds.
* This lowers demand for the dollar, making it cheaper in global markets.
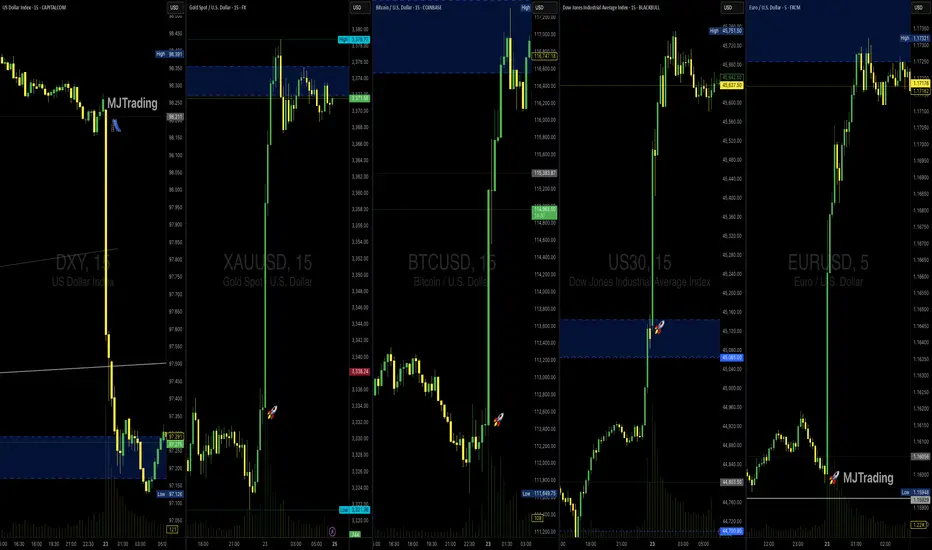
📊 What the Current Charts Show:
CAPITALCOM:DXY (Dollar Index): Sharp drop → less demand for USD.
FX:XAUUSD (Gold): Demand rises as an alternative store of value.
FX:EURUSD : Euro strengthens against weaker dollar.
BINANCE:BTCUSD : Risk appetite returns, lifting crypto.
BLACKBULL:US30 (Dow Jones): Stocks benefit as liquidity shifts from USD into equities.
⚡ The Core Reason – Demand & Supply
Weaker dollar = reduced demand for USD, so supply flows into gold, stocks, euro, and crypto.
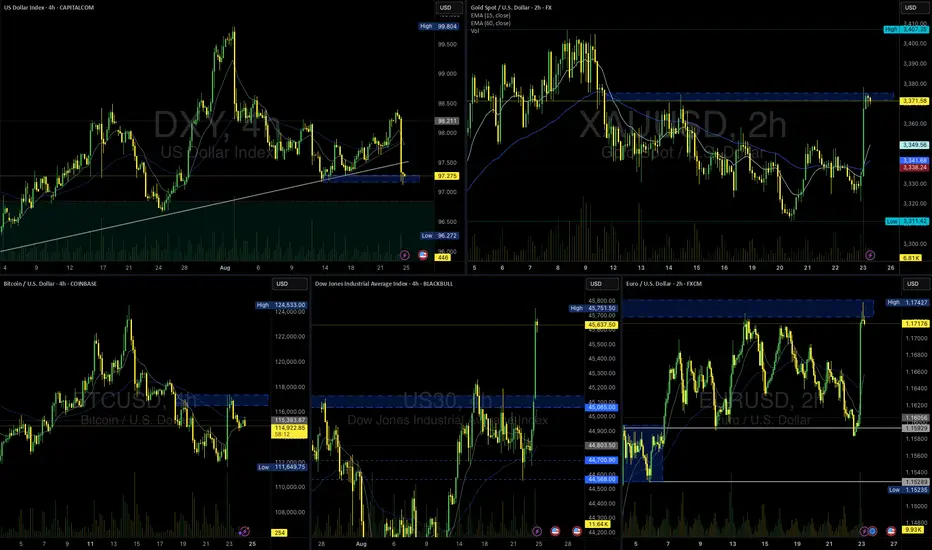
🔮 Looking Ahead – Will the Rally Continue?
The rally may extend if the dollar remains under pressure and the Fed stays dovish.
But caution: after the first strong impulse, markets often retrace to test demand zones before continuing.
Next week’s momentum will depend on whether buyers can sustain demand beyond the initial FOMC reaction.
👉 Takeaway for Traders:
FOMC moves aren’t random. They’re driven by where capital finds the best return. Understanding this demand–supply flow helps explain why all charts move together in these moments.
#MJTrading
#FOMC #DXY #XAUUSD #EURUSD #BTCUSD #US30 #Forex #Gold #TradingEducation #Rally
Psychology Always Matters:
FOMC and Market Reactions – Simple Logic Explained💎 MJTrading:
The Federal Open Market Committee (FOMC) guides U.S. interest rates. Their decisions ripple through all major markets, not just the dollar.
🔑 How It Works (Simple View):
- When the Fed signals higher rates, the USD demand rises (investors seek higher returns), while gold, stocks, and crypto often fall because money becomes “more expensive.”
- When the Fed signals lower rates or slows tightening, the USD loses demand, and money flows into assets like gold, stocks, and crypto.
🔍 Why a Rate Cut Weakens the Dollar:
* Cutting rates means borrowing money becomes cheaper.
* Investors earn less return by holding USD in banks or bonds.
* This lowers demand for the dollar, making it cheaper in global markets.
📊 What the Current Charts Show:
DXY (Dollar Index): Sharp drop → less demand for USD.
XAUUSD (Gold): Demand rises as an alternative store of value.
EURUSD: Euro strengthens against weaker dollar.
BTCUSD: Risk appetite returns, lifting crypto.
US30 (Dow Jones): Stocks benefit as liquidity shifts from USD into equities.
⚡ The Core Reason – Demand & Supply
Weaker dollar = reduced demand for USD, so supply flows into gold, stocks, euro, and crypto.
🔮 Looking Ahead – Will the Rally Continue?
The rally may extend if the dollar remains under pressure and the Fed stays dovish.
But caution: after the first strong impulse, markets often retrace to test demand zones before continuing.
Next week’s momentum will depend on whether buyers can sustain demand beyond the initial FOMC reaction.
👉 Takeaway for Traders:
FOMC moves aren’t random. They’re driven by where capital finds the best return. Understanding this demand–supply flow helps explain why all charts move together in these moments.
#MJTrading
#FOMC #DXY #XAUUSD #EURUSD #BTCUSD #US30 #Forex #Gold #TradingEducation #Rally
Psychology Always Matters:
Click on the image to read the caption.
Why Gold Is Pulling Back Now – May 2025 Update⚡️After surging above $3,500/oz in late April, gold has since declined over 8%, recently breaking below key levels and now trading near $3,210. The retracement reflects fading panic buying and growing attention to fundamental drivers: U.S. monetary policy, the strong dollar, easing geopolitical risks, and completed trade agreements. Here’s a breakdown of the leading catalysts and their current impact (ranked 0–10).
1. Fed “Higher for Longer” Bias Strength: 9/10 The Fed kept interest rates at 4.25–4.50% at its June policy meeting and reiterated its cautious stance. The absence of cuts combined with persistent inflation pressure is lifting real yields and undercutting gold’s appeal as a non-yielding asset.
2. U.S. Dollar Resurgence Strength: 8/10The U.S. Dollar Index (DXY) has climbed above 101 as investors digest the Fed’s hawkish tone. A stronger dollar reduces global gold demand, especially from non-USD buyers.
3. U.S.–China Trade Agreement Reached in Switzerland Strength: 7.5/10 A formal trade deal was announced in Geneva in May, easing longstanding tariff tensions. While specific tariff rollback details are pending, markets welcomed the de-escalation, pushing investors away from gold and into risk assets.
4. U.S.–U.K. Trade Deal Signed Strength: 7/10 The U.S. and U.K. finalized a bilateral trade agreement in early May, boosting global sentiment and further reducing the geopolitical premium priced into gold.
5. India–Pakistan Border De-escalation Strength: 6.5/10 After brief clashes in Kashmir in mid-May, both sides have since released statements of restraint. The calm has helped cap gold’s safe-haven bids.
6. Iran–U.S. Nuclear Talks Update Strength: 6/10 Talks resumed in Vienna in May with cautious optimism. While no concrete deal has been signed, progress and diplomatic language from both sides have eased fears of escalation.
7. Russia–Ukraine Ceasefire Developments Strength: 5.5/10 Localized ceasefires in eastern Ukraine, brokered by Turkey and the UN, have lowered near-term geopolitical risk. However, skepticism remains around long-term stability.
8. ETF Inflows & Institutional Demand Strength: 5/10 ETF inflows slowed in May (up just 48.2 tonnes), reflecting waning retail momentum. Still, central bank buying—especially from China—offers a medium-term cushion.
Catalyst Strength Rankings (May 2025)
🔸Fed “higher for longer” bias 9
🔸U.S. dollar rebound 8
🔸U.S.–China trade agreement 5.5
🔸U.S.–U.K. trade deal signed 5
🔸India–Pakistan border easing 6.5
🔸Iran–U.S. nuclear diplomacy 6
🔸Russia–Ukraine ceasefire 5.5
🔸Global gold ETF & central-bank inflows 5
Where Next for Gold?
⚡️Current price: ~$3,210/oz
📉Recent support levels broken: $3,300 and $3,250
🎯Next technical floor: $3,150/oz
✨Upside triggers: Renewed dollar weakness, inflation surprise, or geopolitical flare-up
Gold’s recent drop reflects the market's rotation out of fear-driven trades into yield-bearing and risk assets. While the Fed and the dollar remain dominant forces, any shock—whether geopolitical or inflationary—could quickly reignite interest in gold as a hedge.

Forex Grid Trading Overview: Practical Guide for 2025Forex Grid Trading Strategy: Detailed Overview & Low-Risk EUR/USD Application
1️⃣ What Is Grid Trading?
A grid trading strategy places a series of **buy** and **sell** orders at fixed intervals (“grid levels”) above and below a base price, without forecasting market direction. As price oscillates, it triggers orders across the grid, locking in small profits on each swing.
- **No Directional Bias** – Profits on both up- and down-moves
- **Automated Entry/Exit** – Ideal for Expert Advisors (EAs) on MT4/MT5
- **Scalable** – Grid size and lot sizing can be tailored to account size and volatility
2️⃣ How It Works – Core Components
1. **Grid Levels**
- Define a **base price** (e.g. current EUR/USD mid)
- Set **intervals** (e.g. every 20 pips) above/below the base
2. **Orders**
- **Buy Limit** orders at 20, 40, 60 pips below base
- **Sell Limit** orders at 20, 40, 60 pips above base
3. **Take Profit (TP) for Each Order**
- TP typically equals the grid interval (e.g. 20 pips) so each triggered order nets a small profit
- No hard Stop Loss per order—risk is managed via overall exposure
4. **Cumulative P&L**
- Winning trades roll profits into the floating drawdown of unfilled orders
- As price oscillates, the grid “locks in” incremental gains
3️⃣ Pros & Cons
| Pros | Cons |
|---------------------------------------|------------------------------------------|
| ✅ Profits in ranging markets | ❌ Can incur large drawdowns in strong trends |
| ✅ Automated, systematic execution | ❌ Requires significant margin for multiple open trades |
| ✅ Scalable to any time-frame | ❌ Floating negative exposure if grid one-sided |
---
✅Low-Risk Best Practices
1. **Grid Spacing & Width**
- Wider grid intervals (e.g. 30–50 pips) reduce order density and margin use
- Use **ATR** (Average True Range) to adapt spacing to EUR/USD volatility
2. **Lot Sizing & Equity Risk**
- Risk ≤ 1–2% equity per full grid cycle
- Use **fixed fractional** sizing: each order size = (Equity × 1%) / (max number of open grid orders)
3. **Drawdown Control**
- **Maximum Open Orders** cap (e.g. 5 orders per side)
- **Equity Stop-Out**: if floating drawdown exceeds e.g. 10% of equity, close all orders
4. **Trend Filters**
- Use a **200-period SMA** or **ADX** filter: only enable sell grid if price < SMA (downtrend) or ADX < 25 (low momentum)
- Disables grid in strong one-way trends
5. **Grid Shifting / Re-Base**
- After a net grid profit, **shift** the base price to current mid to reset exposure
- Prevents runaway open trades far from current price
5️⃣ Step-by-Step: Applying to EUR/USD
1. **Choose Time-Frame**
- **H4 or H1** recommended: balances signal frequency and margin needs
2. **Define Grid Parameters**
- **Base Price:** current EUR/USD mid (e.g. 1.0980)
- **Interval:** 30 pips (≈ recent ATR on H4)
- **Levels:** 3 buys at 1.0950 / 1.0920 / 1.0890; 3 sells at 1.1010 / 1.1040 / 1.1070
3. **Set Order Size**
- Account equity $10 000, risk 1% = $100 per full grid
- Max open orders 6 → each order $100/6 ≈ $16.7 → ≈ 0.02 lots
4. **Configure TP & No SL**
- Each order TP = 30 pips (equals interval)
- No per-order SL; overall drawdown managed by equity stop
5. **Implement Filters**
- Only open **sell** grid if H4 close < 200-SMA; only open **buy** grid if H4 close > 200-SMA
- Pause grid if ADX > 30 (strong trend) or market events (e.g. NFP, ECB rate decision)
6. **Deploy & Monitor**
- Run on MT4 with an EA or semi-automated Expert Advisor
- Monitor margin usage; adjust grid or disable before major news
6️⃣ Example P&L Mechanics
| Trigger Price | Order Type | Entry | TP Target | Profit (pips) |
|---------------|------------|---------|-----------|---------------|
| 1.0950 | Buy Limit | 1.0950 | 1.0980 | 30 |
| 1.0980 | Sell Limit | 1.0980 | 1.1010 | 30 |
- If price moves down to 1.0950: buy executes, TP at 1.0980 nets +30 pips
- If price then climbs above base, sells trigger at 1.1010 nets +30 pips
2️⃣ Introducing Progressive & Regressive Scaling
🔼 2.1 Progressive Scaling
“Let winners run”—increase exposure after success
Concept: After each profitable grid cycle, step up your lot size by a fixed increment.
Why: Capitalizes on momentum and winning streaks.
How to apply:
Base Lot: 0.02 lots per order (1% equity risk).
After grid closes net-positive, next cycle = 0.03 lots.
Continue stepping up (0.04, 0.05 …) until a drawdown or equity-stop is hit.
Reset back to base lot after a losing cycle or whenever floating drawdown > 5%.
Caps & Safeguards:
Max Lot Cap: Never exceed 0.10 lots (or 2% equity risk).
Equity Stop: If floating drawdown > 10%, close cycle & reset.
🔽 2.2 Regressive Scaling
“Protect the downside”—reduce exposure after losses
Concept: After a losing grid cycle, step down your lot size to conserve capital.
Why: Limits damage during rough periods and preserves margin.
How to apply:
Base Lot: 0.02 lots per order.
If grid hits equity-stop or nets negative, next cycle = 0.015 lots.
Continue stepping down (0.01, 0.005) until you record a net-positive cycle.
Reset to base lot after recovery (e.g. two consecutive winning cycles).
Thresholds:
Don’t drop below 0.005 lots (to avoid over-shrinking).
After two winning cycles at reduced lot, return to base.
✅ Bottom Line
Forex grid trading on EUR/USD can generate steady gains in choppy markets—but demands **strict risk controls** (grid spacing, lot sizing, drawdown limits) and **trend filters** to avoid large losses in trending conditions. When properly applied, a low-risk grid on EUR/USD offers a robust, mostly hands-off strategy for capturing repetitive market swings.
4️⃣ Key Takeaways
Progressive Scaling lifts lot sizes on winning streaks, amplifying gains—but must be capped and reset on losses.
Regressive Scaling shrinks exposure after drawdowns, preserving capital until the strategy recovers.
Combine both with your grid’s risk parameters, trend filter, and a solid equity-stop to maintain a balanced, low-risk EUR/USD grid.
By layering scaling rules atop your grid, you adapt dynamically to market performance—maximizing winners and protecting against prolonged losing runs. Good luck! 🚀

Elliott Wave Principles: A Study on US Dollar IndexHello friends, today we'll attempt to analyze the (DXY) US Dollar Index chart using Elliott Wave theory. Let's explore the possible Elliott Wave counts with wave Principles (Rules).
We've used the daily time frame chart here, which suggests that the primary cycle degree in Black weekly wave ((A)) and ((B)) waves have already occurred. Currently, wave ((C)) is in progress.
Within wave ((C)) in Black which are Weekly counts, Subdivisions are on daily time frame, showing Intermediate degree in blue wave (1) & (2) are finished and (3) is near to completion. Post wave (3), we can expect wave (4) up in Blue and then wave (5) down in Blue, marking the end of wave ((C)) in Black.
Additionally, within blue wave (3) Intermediate degree, we should see 5 subdivisions in red of Minor degree, which is clearly showing that waves 1 & 2 are done and now we are near to completion of wave 3 in Red. followed by waves 4 and 5, which will complete blue wave (3).
Key Points to Learn:
When applying Elliott Wave theory, it's essential to follow specific rules and principles. Here are three crucial ones:
1. Wave 2 Retracement Rule: Wave two will never retrace more than 100% of wave one.
2. Wave 3 Length Rule: Wave three will never be the shortest among waves 1, 3, and 5. It may be the largest most of the time, but never the shortest.
3. Wave 4 Overlap Rule: Wave four will never enter into the territory of wave one, meaning wave four will not overlap wave one, except in cases of diagonals or triangles.
Invalidation level is a level which is decided based on these Elliott wave Principles only, Once its triggered, then counts are Invalidated so we have to reassess the chart study and other possible counts are to be plotted
The entire wave count is clearly visible on the chart, and this is just one possible scenario. Please note that Elliott Wave theory involves multiple possibilities and uncertainties.
The analysis we've presented focuses on one particular scenario that seems potentially possible. However, it's essential to keep in mind that Elliott Wave counts can have multiple possibilities.
I am not Sebi registered analyst.
My studies are for educational purpose only.
Please Consult your financial advisor before trading or investing.
I am not responsible for any kinds of your profits and your losses.
Most investors treat trading as a hobby because they have a full-time job doing something else.
However, If you treat trading like a business, it will pay you like a business.
If you treat like a hobby, hobbies don't pay, they cost you...!
Hope this post is helpful to community
Thanks
RK💕
Disclaimer and Risk Warning.
The analysis and discussion provided on in.tradingview.com is intended for educational purposes only and should not be relied upon for trading decisions. RK_Charts is not an investment adviser and the information provided here should not be taken as professional investment advice. Before buying or selling any investments, securities, or precious metals, it is recommended that you conduct your own due diligence. RK_Charts does not share in your profits and will not take responsibility for any losses you may incur. So Please Consult your financial advisor before trading or investing.

Blueprint for Becoming a Successful Forex Trader in 2025🚀 Blueprint to Becoming a Successful Forex Trader in 2025: Leveraging ICT, Automation, and Prop Funding
Here’s a detailed, actionable blueprint designed to position you for success by carefully navigating broker selection, adopting advanced trading strategies, obtaining prop funding, and integrating automation and AI technologies into your trading.
🏦 Broker Selection (Actionable Steps)
🔍 Choose brokers with true ECN/STP execution
⚡ Ensure brokers offer low spreads (0.0-0.2 pip average) and fast execution to maximize ICT precision entries.
🛡️ Prioritize brokers regulated by ASIC, FCA, or FSCA with verified Myfxbook execution reports.
📊 Confirm broker compatibility with MetaTrader 4 (MT4) to seamlessly integrate Expert Advisors (EAs).
💳 Check for flexible withdrawal/deposit methods and swift payouts (Crypto, Wise, Revolut).
🎯 Trading Strategy (ICT Concepts & Supply-Demand Zones)
🧠 Master ICT Concepts: Liquidity sweeps, Order Blocks (OB), Fair Value Gaps (FVG), Market Structure Breaks (MSB).
📍 Combine ICT with Supply-Demand: Identify institutional supply-demand zones aligning with ICT Order Blocks & liquidity areas.
📐 Execute High-Probability Setups: Trade only after liquidity grabs at key daily/weekly ICT points, avoiding retail traps.
📈 Time & Price Theory: Trade London Kill Zones and New York Open exclusively, exploiting predictable ICT volatility.
📆 Weekly Preparation: Annotate D1/H4 charts on weekends marking liquidity points, order blocks, and premium/discount zones clearly.
💰 Getting Prop Funding (Actionable Approach)
🥇 Target reputable prop firms (FTMO, MyForexFunds, The Funded Trader, 8cap, etc) with clear and attainable evaluation objectives.
📑 Use ICT trading style for evaluation: lower-frequency, high-probability trades with clearly defined risks.
🎯 Implement strict risk management rules: never exceed 1% risk per trade, aiming for steady account growth (5-10% monthly target).
📊 Monitor performance closely using provided analytics dashboards (e.g., FTMO Metrics App) and adapt accordingly.
📚 Diversify funded accounts across multiple firms, compounding total available trading capital while reducing firm-specific risk.
⚙️ Automating & Executing Trades (MT4 EA & Bots)
🛠️ Hire experienced MQL4 developers to code custom ICT-based MT4 Expert Advisors
🤖 Develop EAs specifically around ICT logic (Order Block detection, liquidity grabs, market structure shifts) and or supply/demand logic
🤖 use advanced algo based breakout EAs for automation
📌 Automate trade management: EAs should handle entry precision, partial exits, break-even stops, and trail stops.
📡 Set EAs on VPS Hosting (NY4, LD4) for optimal latency and consistent execution (ForexVPS, AccuWeb Hosting).
📈 Regularly perform forward-testing and optimization of EAs on demo accounts before live deployment (at least quarterly optimization).
📲 Integrating Advanced Bots and Technology in 2025
📊 Combine your MT4 EAs with third-party analytics platforms for detailed trade performance insights.
🔮 Incorporate AI-based forecasting tools to refine ICT setups and trade signals.
🔔 Use automated bots for real-time alerts on ICT-based setups via Telegram or Discord channels.
🧑💻 Maintain manual oversight for discretionary ICT decisions—use automation for entry efficiency, not blind reliance.
🔄 Continuously retrain and update your bot’s logic monthly using the most recent trade data, ensuring adaptive execution.
🗓️ Daily Routine for Success
🌅 Pre-session (30 mins): Review annotated charts, ICT concepts (liquidity, OB, FVG), and supply-demand levels.
💻 During trading session: Monitor EA execution, manually adjust positions based on real-time ICT setups.
📝 Post-session (15 mins): Journal trades meticulously in detail, noting ICT reasoning behind wins and losses.
📆 Weekly review: Assess overall ICT & EA performance—adjust EA parameters as needed to match evolving market conditions.
📚 Continuous learning: Keep updated on advanced ICT framework,
supply demand zone trading.
📌 Final Actionable Advice for 2025
🔍 Specialize intensely on ICT & supply-demand concepts rather than multiple strategies—depth over breadth.
🚩 Always adapt and evolve your trading algorithms to ICT methodology—market dynamics continually change.
🧘 Maintain emotional discipline and patience, relying on high-probability setups to steadily compound your account.
💡 Stay ahead by embracing technology: automation, AI-driven forecasting, and custom ICT tools will provide a significant edge in 2025.

ICT Concepts for FX and GOLD traders: 2025 edition🔍 ICT (Inner Circle Trader) is a trading methodology developed by Michael J. Huddleston. It focuses on market structure, smart money concepts (SMC), and how institutions manipulate liquidity to trap retail traders.
📚 It's not about indicators or over-complication — it's about reading the price action like a pro, understanding where liquidity is, and trading with the banks, not against them.
📐 1. Market Structure
Understand Highs & Lows: Identify break of structure (BOS) and change of character (CHOCH)
Follow the macro to micro flow: D1 > H4 > M15 for precision entries
🧱 2. Order Blocks (OBs)
An order block is the last bullish or bearish candle before a major price move.
Banks and institutions place large orders here.
Smart traders look for price to return to these areas (mitigation), then enter with tight stop losses.
👉 Think of OBs as institutional footprints on the chart.
💧 3. Liquidity Zones
Equal highs/lows, trendline touches, support/resistance — these are liquidity traps.
ICT teaches that price often hunts liquidity before reversing. That’s why many retail traders get stopped out.
Learn to trade into liquidity, not off it.
🔄 4. Fair Value Gaps (FVGs)
Also called imbalances — when price moves too fast and leaves gaps.
Price often retraces to "fill the gap" — a key entry point for ICT traders.
🥇 ICT for Gold & Forex in 2025
💰 Why It Works for XAUUSD & Majors:
Gold is a highly manipulated asset, perfect for ICT-style trading.
It responds beautifully to liquidity grabs, order blocks, and Asian–London–New York session transitions.
Forex majors (EUR/USD, GBP/USD, etc.) are also ideal since they’re heavily influenced by institutional flow and news-driven liquidity hunts.
🕐 Timing Is Everything
Trade Killzones:
📍 London Killzone: 2AM–5AM EST
📍 New York Killzone: 7AM–10AM EST
These are high-volume sessions where institutions make their moves.
📈 Typical ICT Setup
▪️Spot liquidity zone above or below recent price
▪️Wait for liquidity sweep (stop hunt)
▪️Identify nearby order block or FVG
▪️Enter on a pullback into OB/FVG
▪️Set tight SL just past the recent swing
Target internal range, opposing OB, or next liquidity level
👨💻 Why FX/GOLD Traders Love ICT
✅ It’s clean, no indicators, and highly logical
✅ Great for part-time trading — 1 or 2 trades a day
✅ Feels like "leveling up" your understanding of the market
✅ Perfect for backtesting and journaling on platforms like TradingView or SmartCharts
✅ Easy to integrate into algo-based systems or EAs for semi-automation
If you’re tired of indicators and guessing, and want to trade like the institutions, ICT is a game changer. In 2025, more prop firms and traders are applying ICT concepts to dominate markets like gold, forex, and even crypto.
🧭 Master the method. Understand the logic. Ride with the smart money.
🔥 Welcome to the next level of trading.

Ultimate 2025 Forex Prop Trading FAQ + Strategy Guide🧠 Forex Prop Trading: What Is It?
Prop trading (proprietary trading) is when a trader uses a firm’s capital to trade the markets (instead of their own), and keeps a share of the profits – usually 70–90%.
✅ Low startup cost
✅ No personal risk (firm takes the loss)
✅ Big upside potential with scaling plans
📋 Step-by-Step Action Plan to Get Started (2025)
🔍 1. Understand the Prop Firm Model
🏦 Prop firms fund skilled traders with $10K to $500K+
🎯 You pass a challenge or evaluation phase to prove your skills
💵 Once funded, you earn a profit split (70%–90%)
🧪 2. Choose a Top Prop Firm (2025)
Look for reliable and regulated firms with transparent rules:
FTMO 🌍 – Trusted globally, up to $400K scaling
MyFundedFX 📊 – Up to 90% profit split, no time limit
E8 Funding ⚡ – Fast scaling and instant funding
FundedNext 💼 – 15% profit share during challenge phase
The Funded Trader 🏰 – Up to $600K with leaderboard bonuses
🔎 Compare features: fees, drawdown limits, trading style freedom
💻 3. Train & Master Your Strategy
🧠 Pick a clear, rule-based strategy (e.g. trend following, breakout, supply/demand)
📅 Backtest over 6–12 months of data
💡 Use AI tools & trade journals like Edgewonk or MyFXBook
🎯 Focus on:
Win rate (above 50–60%)
Risk-reward ratio (1:2 or better)
Consistency, not wild profits
🧪 4. Pass the Evaluation Phase
🔐 Follow risk rules strictly (daily & max drawdown)
⚖️ Use proper risk management (0.5–1% risk per trade)
🧘♂️ Trade calmly, avoid overtrading or revenge trades
📈 Most challenges:
Hit 8–10% profit target
Stay under 5–10% total drawdown
Trade for at least 5–10 days
🧠 Tip: Pass in a demo environment first before going live!
💵 5. Get Funded & Start Earning
🟢 Once approved, you trade real firm capital
💰 You keep up to 90% of profits, with withdrawals every 2 weeks to 1 month
🚀 Many firms offer scaling plans to grow your account over time
💬 FAQ – Prop Trading in 2025
❓ How much can you make?
🔹 Small accounts ($50K): $2K–$8K/month with 4–8% returns
🔹 Large accounts ($200K+): $10K+/month possible for consistent traders
💡 Many traders start part-time and scale as they build trust with the firm
❓ How much do I need to start?
💳 Challenge fees range from:
$100 for $10K
$250–$350 for $50K
$500–$700 for $100K+
⚠️ No need to deposit trade capital – just the challenge fee
❓ What are the risks?
You can lose the challenge fee if you break rules or over-leverage
You won’t owe money to the firm
The biggest risk is psychological – many fail from overtrading or emotional decisions
🚀 Final Tips to Succeed
✅ Trade like a robot, think like a CEO
✅ Journal every trade – self-awareness is key
✅ Avoid over-leveraging and gambling mindset
✅ Stick to one strategy and master it
✅ Focus on consistency over quick wins
How to Trade Ending Diagonal: EURUSDOne of my favorite EW patterns: Ending Diagonal
It usually appears in wave C or 5, we have wave C
It consists of five waves and each of them are three waves
All looks good as wave 5 is over wave 3 and Ending diagonal might be completed
as EWO oscillator already shows Bearish Divergence between wave 3 and 5
This educational post to show trade setup on this pattern
The bottom of wave b in wave 5 is a breakdown trigger (blue) as it means wave 5 is over
Confirmation is on breakdown of wave 4 (orange)
Target is at the start of the Ending Diagonal (green)
Bonus track:
One could consider sell on 61.8% Fib retracement as we see the first impulse down
and now we watch this two-legged pullback.

How I trade ICT ConceptsIn this video I attempt to explain how I trade using ICT Concepts. In my opinion it is a bit different to how most people use the concepts, or perhaps how even Michael uses them, but I find it very reliable in terms of determining where price is in the PD Array Matrix.
I hope it this demonstration is insightful and thank you for watching.
- R2F Trading

Talking to myself; feel free to peep in... DXYHello Traders!
Spend some time with the charts this Sunday without any thought of any kind of transaction . @I_Am_ICT
1h charts for the price run from late September 2024 :-
Happy Sunday!

From Fiat to Crypto: A Pragmatic View on Cross-Asset USD Impact1. Introduction: Why Understanding USD Impact Matters
The U.S. dollar (USD) plays a pivotal role in shaping global financial markets, especially for assets denominated in dollars, such as S&P 500 Futures (ES/MES). Its movements affect equity market flows, international capital dynamics, and, ultimately, price trends for USD-denominated instruments. However, traditional methods of gauging USD strength often fall short of capturing the nuanced interplay between fiat currencies and emerging digital assets.
To bridge this gap, we introduce a pragmatic and dynamic solution: the USD Proxy. By combining a carefully weighted mix of key global currencies (Euro and Yen) with Bitcoin (BTC), this proxy provides a comprehensive and CME-specific lens for understanding USD strength. It is a modern approach to assess the dollar's “true” influence on equity markets, particularly the S&P 500 Futures.
2. The USD Proxy: A Pragmatic Cross-Asset Index
The USD Proxy is built to reflect real-time market dynamics, offering traders a potentially more relevant measure of the dollar’s impact. Unlike static indexes, this proxy is dynamic, continuously adjusting based on three major components:
Euro Futures (6E): Representing the largest fiat currency trading block.
Japanese Yen Futures (6J): Capturing the Asian market's influence.
Bitcoin Futures (BTC): Adding a layer of innovation by integrating cryptocurrency, which operates independently of traditional fiat systems.
The weighting is determined by notional values, market prices, and volume-weighted activity as volumes change and evolve through time, ensuring the proxy adapts to liquidity and relative importance. This structure provides a balanced view of USD strength across fiat and crypto markets, making it highly applicable to modern trading.
3. Adjusting S&P 500 Futures Using the USD Proxy
To uncover the “true” equity market performance, the S&P 500 Futures can be adjusted using the USD Proxy. The formula is straightforward:
Adjusted S&P 500 Futures = S&P 500 Futures Price x USD Proxy Value
This adjustment neutralizes the effects of USD strength or weakness, revealing the core price action of the equity market. By doing so, traders can distinguish between moves driven by dollar fluctuations and those stemming from genuine market trends.
For example, during periods of a strengthening USD, the unadjusted S&P 500 Futures may appear weaker due to currency pressure. However, the adjusted version may provide a clearer picture of the underlying equity market, enabling traders to make more informed decisions.
4. Regular vs. Adjusted S&P 500 Futures: Key Insights
The comparison between regular and USD Proxy-adjusted S&P 500 Futures charts could reveal critical divergences that may have been often overlooked. These divergences highlight how currency fluctuations can obscure or exaggerate the equity market’s actual performance.
For instance, while the S&P 500 Futures have recently reached new all-time highs, some market participants may view this as an indication of the market being overpriced. However, when adjusted using the USD Proxy, the chart reveals a different reality: the S&P 500 Futures are far from their highs. This adjustment aims to neutralize the currency's impact, uncovering that the recent record-breaking levels in the unadjusted chart are likely largely influenced by USD dynamics rather than true underlying equity market performance.
5. Trading Opportunities in Adjusted S&P 500 Futures
The adjusted S&P 500 Futures chart opens up new possibilities for traders to identify actionable insights and anomalies. By neutralizing the currency effect, traders can:
Spot Relative Overperformance: Identify instances where the adjusted chart shows strength compared to the regular chart, signaling robust underlying equity market dynamics.
Capitalize on Potential Anomalies: Detect price-action discrepancies caused by abrupt currency moves and align trades accordingly.
Refine Entry and Exit Points: Use the adjusted chart especially during high-volatility periods influenced by the USD.
6. Trading Application: A Long Opportunity in Adjusted S&P 500 Futures
Trade Setup:
o Instrument: S&P 500 Futures (ES) or Micro S&P 500 Futures (MES).
o Entry Point: Around 5900.00
o Targets:
Primary Target: 6205.75 (aggressive traders, Fibonacci extension level).
Conservative Target: 6080.00 (moderate traders, earlier Fibonacci extension).
o Stop Loss: Below the entry, calculated to maintain a 1:3 reward-to-risk ratio.
Rationale:
The adjusted S&P 500 Futures chart highlights a technical setup where the price is reacting to:
Breakout to the Upside: The adjusted chart is breaking out of a key resistance level, signaling potential continuation of upward momentum.
The 20-SMA: Acting as dynamic support, aligning with recent price behavior.
Technical Support Level: A key horizontal level.
These converging factors suggest the potential for a bullish continuation, targeting Fibonacci extension levels at 6205.75 or 6080.00. The adjusted chart provides added confidence that the move is not overly influenced by USD fluctuations, grounding the analysis in equity-specific dynamics.
Trade Mechanics:
o Instrument Options:
ES (full-size contract), with a point value of $50 per point.
MES (micro-sized version), designed for smaller accounts or precision risk management, with a point value of $5 per point—10 times smaller than the full-size ES contract.
o Margins (approximate, depending on broker):
ES: Approximately $15,000 per contract.
MES: Approximately $1,5000 per contract—10 times smaller than the ES margin.
Execution Plan Example:
Place Buy Limit Order at 5900.00.
Set Stop Loss below the entry, maintaining a 1:3 reward-to-risk ratio.
Take partial profits or adjust stop losses as the price approaches 6080.00 for conservative traders or 6205.75 for aggressive targets.
7. Conclusion: A Fresh Perspective on USD and Equity Futures
By introducing the USD Proxy and applying it to S&P 500 Futures, traders gain a powerful tool to assess market dynamics. This cross-asset approach—spanning fiat and crypto—bridges the gap between traditional and modern financial metrics, offering unparalleled insights.
The adjusted S&P 500 Futures chart neutralizes currency distortions, revealing the market's true movements. Whether identifying divergences, refining trading strategies, or uncovering hidden opportunities, this method empowers traders to approach the market with clarity and precision.
As markets evolve, tools like the USD Proxy demonstrate the importance of integrating diverse assets to stay ahead in a complex trading environment.
When charting futures, the data provided could be delayed. Traders working with the ticker symbols discussed in this idea may prefer to use CME Group real-time data plan on TradingView: www.tradingview.com - This consideration is particularly important for shorter-term traders, whereas it may be less critical for those focused on longer-term trading strategies.
General Disclaimer:
The trade ideas presented herein are solely for illustrative purposes forming a part of a case study intended to demonstrate key principles in risk management within the context of the specific market scenarios discussed. These ideas are not to be interpreted as investment recommendations or financial advice. They do not endorse or promote any specific trading strategies, financial products, or services. The information provided is based on data believed to be reliable; however, its accuracy or completeness cannot be guaranteed. Trading in financial markets involves risks, including the potential loss of principal. Each individual should conduct their own research and consult with professional financial advisors before making any investment decisions. The author or publisher of this content bears no responsibility for any actions taken based on the information provided or for any resultant financial or other losses.

Smart Money Trading concepts 101🔸The Smart Money Trading concept, often used in Forex and stock trading, revolves around the idea of tracking the moves made by major institutional players (like banks, hedge funds, and large financial institutions) rather than retail investors. Smart money strategies aim to identify and follow the price action patterns that large investors create, as these institutions often have access to more market-moving information and capital than individual traders.
🔸A critical part of this approach is understanding market structure, which includes concepts like Higher Highs (HH) and Lower Lows (LL). These patterns help traders determine the current trend direction and potential reversals, which can inform trading decisions.
Here's how these concepts fit into the Smart Money Trading framework:
1. Higher Highs (HH) and Higher Lows (HL) in an Uptrend
▪️When the market is in an uptrend, it typically forms a series of Higher Highs and Higher Lows:
Higher High (HH): Each new peak in the price is higher than the previous peak.
Higher Low (HL): Each new low is also higher than the previous low.
▪️This pattern signifies strong buying interest, indicating that smart money may be accumulating positions in anticipation of further price increases.
▪️Traders look for breakouts beyond previous highs, as it often signifies a continuation of the uptrend.
▪️If the price breaks a recent Higher Low, it may indicate potential weakness and a possible trend reversal.
2. Lower Lows (LL) and Lower Highs (LH) in a Downtrend
▪️In a downtrend, the market structure often forms Lower Lows and Lower Highs:
Lower Low (LL): Each new low is lower than the previous low.
Lower High (LH): Each high in the price action is also lower than the previous high.
▪️This pattern signals that selling pressure is dominant, suggesting that institutional investors might be offloading positions.
▪️Traders watch for prices to break the most recent Lower High for potential continuation signals in the downtrend.
▪️If the price breaks above the most recent Lower High, it can indicate that the trend may be weakening, signaling a potential reversal or entry opportunity.
3. Using HH and LL to Spot Trend Reversals
▪️Trend Reversal: When a series of HH and HL in an uptrend shifts to LH and LL (or vice versa), it often signals that a reversal is underway.
▪️Smart Money traders use these shifts to spot market traps where retail traders might be misled, allowing them to capitalize on new trend directions as they unfold.
4. Smart Money Concepts in Action: Liquidity and Price Action
▪️Large players need liquidity to execute significant trades without causing excessive slippage (or price movement). This liquidity often exists near recent highs and lows.
▪️By analyzing HH, HL, LH, and LL patterns, smart money traders can identify areas of liquidity where institutions might step in.
▪️For example, a series of HHs might attract retail buyers, providing liquidity for smart money to enter or exit positions.
5. Application in Trading
▪️By following HH and LL patterns, traders can align their positions with smart money rather than getting caught in fakeouts or market traps.
▪️Traders often combine these patterns with other indicators (like volume, order blocks, or support and resistance) to confirm the presence of institutional involvement.
🔸The Smart Money approach relies heavily on understanding and interpreting these HH and LL structures to trade in sync with the institutions, avoiding common pitfalls that trap many retail traders.

AI Algo Trading Intro/OverviewAI ALGO TRADING INTRO/OVERVIEW
🔹AI algorithmic trading, often referred to as AI algo trading, is a sophisticated approach to financial trading that uses artificial intelligence (AI) algorithms to make trading decisions. It combines finance, statistics, and computer science to analyze vast amounts of data and execute trades in real-time, often at speeds impossible for human traders. Here's a closer look at how it works, its benefits, and the key components:
1. How AI Algo Trading Works
AI algo trading employs machine learning, deep learning, and other advanced data analysis techniques to create models that can predict stock prices or detect trading patterns. These AI models are designed to identify patterns or anomalies in historical and real-time data, which helps them make predictions about price movements. The algorithms can process huge datasets from multiple sources, including stock prices, news, sentiment data from social media, and even macroeconomic indicators.
Typical steps involved in AI algo trading include:
🔹Data Collection: Gathering historical price data, technical indicators, financial reports, and alternative data (e.g., news, social media sentiment).
Model Training: Training machine learning models on historical data to predict asset price movements or specific trading signals.
🔹Backtesting: Testing the model on historical data to see how it would have performed in the past, adjusting for any biases or errors.
🔹Execution: Implementing the model in live markets to execute trades automatically when certain conditions are met.
2. Key Components of AI Algo Trading
Several key components work together in AI-driven trading systems, including:
🔹Data Management: Collecting, cleaning, and storing large volumes of financial and alternative data.
🔹Feature Engineering: Selecting or creating specific data features that improve the model's accuracy, such as moving averages, volatility measures, or sentiment scores.
🔹Machine Learning Models: Models like neural networks, decision trees, or support vector machines (SVMs) are common in AI trading. More advanced models use deep learning and reinforcement learning.
🔹Risk Management: Ensuring trades meet certain risk parameters to prevent excessive losses. Many AI algorithms have built-in risk management measures, like stop-loss limits or position size restrictions.
🔹Execution Algorithms: After generating trade signals, execution algorithms place trades in the market. These can include smart order routing and algorithms for optimizing trade timing.
3. Advantages of AI Algo Trading
🔹Speed and Efficiency: AI algorithms can execute trades within milliseconds, reacting instantly to market movements.
🔹Data-Driven Decisions: AI algo trading relies on empirical data rather than emotions, leading to potentially more consistent decision-making.
🔹Pattern Recognition: Advanced AI models can identify complex patterns in large datasets, uncovering trading opportunities that may be invisible to human traders.
🔹24/7 Operation: AI systems can monitor markets continuously, which is especially valuable in global markets that operate around the clock.
🔹Customization: AI-driven strategies can be tailored to specific asset classes, trading goals, and risk tolerances.
4. Popular AI Techniques in Trading
AI algo trading employs several popular techniques:
🔹Supervised Learning: This includes models like regression, classification, and neural networks, often used to predict price changes or determine trading signals.
🔹Unsupervised Learning: Clustering and anomaly detection models help identify unusual trading patterns or group similar assets.
🔹Reinforcement Learning: This is where AI learns to optimize strategies through trial and error, which can be particularly useful for adaptive, evolving trading strategies.
🔹Sentiment Analysis: AI can analyze text data (e.g., news articles, tweets) to gauge market sentiment, adding a qualitative dimension to trading models.
5. Risks and Challenges
While AI algo trading offers numerous advantages, it also comes with certain risks:
🔹Model Overfitting: Overfitting to historical data can result in poor performance in live markets if the model is too specific to past conditions.
Market Volatility: AI algorithms may struggle to adapt to sudden market changes, like unexpected geopolitical events or economic crises.
🔹Technical Failures: Infrastructure and connectivity issues can disrupt AI trading systems, leading to missed opportunities or unwanted positions.
🔹Regulatory Concerns: Regulatory bodies often scrutinize algorithmic trading for issues like market manipulation, requiring firms to ensure their algorithms are compliant.
6. Future of AI Algo Trading
🔹The future of AI algo trading looks promising, with ongoing advancements in AI and access to even more diverse data sources. Innovations in quantum computing, natural language processing (NLP) for deeper sentiment analysis, and reinforcement learning for adaptive strategies are likely to further enhance AI-driven trading.
🔹As AI trading models continue to evolve, they may also become more accessible to individual investors and retail traders, allowing a broader range of market participants to benefit from data-driven trading strategies. However, regulatory agencies may also implement stricter controls to manage the risks associated with autonomous AI trading.

Getting Started with Forex Prop Trading: Intro Guide🔸Forex prop trading (short for foreign exchange proprietary trading) refers to a trading model where traders use capital provided by a proprietary trading firm to trade in the Forex (foreign exchange) market. Unlike traditional retail trading, where traders use their own funds, prop traders operate with the firm's capital, typically after passing a series of evaluations to prove their trading skills and risk management abilities. In return, the firm takes a percentage of the profits generated by the trader.
🆕 Here’s a more detailed look at how forex prop trading works and why it's appealing:
🔸 Access to Capital
Prop firms offer substantial capital to skilled traders, allowing them to trade with much larger account sizes than they might be able to on their own. For example, a trader might be funded with anywhere from $10,000 to $1,000,000 or more, depending on their experience and the firm's offerings.
🔸 Evaluation Process
Most prop firms require traders to pass an evaluation or assessment phase before providing access to live capital. This involves trading on a demo account and meeting specific performance metrics like profit targets, drawdown limits, and risk management rules. If the trader successfully passes this phase, they are then given access to a live account with the firm's capital.
🔸 Profit Sharing
Once a trader is funded, they enter into a profit-sharing agreement with the firm. Typically, the trader receives a percentage of the profits, often around 70-90%, while the firm keeps the rest as compensation for providing the capital and infrastructure. For example, if a trader makes $10,000 in profits and their profit split is 80/20, they would keep $8,000 while the firm takes $2,000.
🔸 Risk Management
Prop firms are very strict about risk management because they are providing their own capital. They impose limits on the maximum drawdown (the amount a trader can lose), daily loss limits, and leverage. If these rules are violated, traders risk losing their funded status.
🔸 Advantages for Traders
Low Financial Risk: Traders do not need to risk their own capital, reducing personal financial exposure.
No Pressure to Invest Large Sums: With access to firm capital, traders don’t need to save up large amounts to trade at higher levels.
Support and Resources: Many prop firms provide educational resources, trading platforms, and tools to help their traders succeed.
🔸Types of Prop Firms
Prop firms can generally be categorized into two types:
🔸Traditional Prop Firms: These firms often require traders to work in-office and provide access to a wide range of markets beyond Forex, including stocks, commodities, and derivatives. Online Prop Firms: The more popular model today, these firms operate remotely, allowing traders from around the world to participate.
🔸 Fees
Most prop firms charge traders an initial fee to cover the evaluation process. This fee can range from a few hundred to a couple of thousand dollars, depending on the account size. In many cases, this fee is refundable if the trader successfully completes the evaluation.
🔸 Challenges
Strict Rules: If traders fail to adhere to the firm's rules (such as daily loss limits or maximum drawdown), they can lose their funded account.
Pressure to Perform: Trading with someone else’s capital can create pressure, which can affect trading decisions and lead to mistakes if not handled well.
🔸Bot Algo Trading in Forex
Algorithmic trading (algo trading) involves using pre-programmed instructions (algorithms) that can automatically execute trades in the Forex market based on specific conditions. These conditions can be price, volume, time, or other market indicators. Algo trading has become increasingly popular in the Forex market due to its ability to:
▪️Execute trades at high speed without the need for human intervention.
▪️Remove emotional biases, which can often lead to poor decision-making in trading.
▪️Test and optimize strategies through backtesting on historical data to ensure effectiveness.
▪️Implement complex strategies that would be difficult for a human to execute manually.
🔸what is a Bot Algo Expert?
A bot algo expert is typically a professional who specializes in developing and optimizing trading algorithms (bots) for Forex markets. They possess skills in coding, often using languages like Python, MQL4/5 (MetaQuotes Language), and other programming languages tailored to financial markets.
🔸The expert focuses on building bots that can:
▪️Identify trading signals based on technical indicators (like moving averages, RSI, Bollinger Bands).
▪️Automatically execute trades when certain criteria are met (such as entering or exiting positions).
▪️Manage risk by setting stop-loss and take-profit orders to minimize potential losses.
▪️Optimize performance by regularly updating the algorithm based on market conditions.
🎁Please hit the like button and
🎁Leave a comment to support our team!

Replace a 100 000 USD salary with income from trading🔸 Develop a Strong Foundation in Forex Trading
Before considering Forex as a full-time source of income, it’s essential to build a solid foundation in trading.
▪️Learn the Basics: Understand Forex fundamentals such as how currency pairs work, how to read charts, how the market operates, and how global economic events affect price movements.
▪️Master Technical and Fundamental Analysis: Study technical analysis (price action, indicators, chart patterns) and fundamental analysis (macroeconomic data, interest rates, geopolitical events). This allows you to make informed trading decisions.
▪️Study Risk Management: Managing risk is crucial to avoid catastrophic losses. Learn how to calculate position sizes, set stop-losses, and limit leverage. Most professional traders risk no more than 1-2% of their capital per trade.
▪️Backtest and Paper Trade: Test your trading strategies on historical data and in demo accounts to ensure they are profitable over time. This will help you refine your approach without risking real money.
🔸 Create and Test a Trading Strategy
A successful trading career requires a well-defined trading strategy. This is critical for consistency and profitability.
▪️Define Your Trading Style: Determine whether you are a day trader, swing trader, or position trader, based on your risk tolerance, time availability, and financial goals.
▪️Build a Strategy Based on Time Frames and Setups: Whether you focus on scalping, trend trading, or breakout strategies, you need a strategy that works for your trading style. Be sure to incorporate indicators (moving averages, Fibonacci retracement, RSI) and a risk-reward ratio.
▪️Test the Strategy: Test your strategy on demo accounts or paper trade until you have confidence in its profitability over the long run. A good strategy should consistently deliver positive results over several months and market conditions.
🔸 Accumulate Enough Capital
Forex trading requires sufficient capital to replace a salary and generate consistent income.
▪️Set Realistic Capital Requirements: The amount of capital you need will depend on how much monthly income you need and how much risk you are willing to take. Generally, to replace a full-time salary with Forex income, you will need significant capital (likely in the range of $50,000–$100,000 or more). This amount allows you to generate enough returns without taking excessive risks.
▪️Calculate Your Required Return on Investment (ROI): Let’s say you need $3,000 per month to replace your salary. If you have a $100,000 account, you would need a 3% return per month. If your account is smaller (e.g., $10,000), you would need a much higher (and riskier) 30% return, which is unrealistic in the long run.
▪️Use Leverage Cautiously: Leverage can magnify both profits and losses. While Forex brokers often offer high leverage (e.g., 50:1, 100:1), it’s essential to use leverage cautiously, as it can lead to significant losses if a trade goes against you.

What America Does with Its Money ? 🇺🇸 Decoding America's Spending: A Deep Dive into Government Finances
This topic has been on the horizon for a while, and I think many new traders will be pleased to see it so LFG
Just like a business, the government has its own financial records :
💰 Money comes in (primarily from taxes)
💸 Money goes out (to fund a variety of programs)
With an expected gross domestic product (GDP) of nearly $29 trillion in 2024, the US remains the world’s largest economy, surpassing China’s $18.5 trillion.
However, the US government isn’t exactly profitable. In fact, it’s been consistently running a growing deficit, raising concerns about its long-term financial stability.
As a general election approaches, it's more important than ever to understand how the US generates and spends its money. So, let’s dive into the details
Here’s a quick overview:
- Revenue: A deep dive into taxes
- Spending: Powering the nation
- Bottom Line: Operating costs & the deficit
- National Debt: A mounting challenge
- The Future: America's financial outlook
1. Revenue: A Deep Dive into Taxes
The US government operates on an enormous scale, and like any large organization, it requires a consistent stream of income to stay functional. However, unlike businesses that sell products or services, the government generates revenue primarily through taxes and fees
In fiscal year 2023, the federal government collected an astounding $4.4 trillion
So, where does all of this money come from? Let’s take a closer look:
👥 Individual Income Taxes:Nearly 50% of the government’s total revenue comes from individuals. Every time you receive a paycheck, a portion is automatically sent to Uncle Sam. This also includes taxes on capital gains from investments.
🏦 Social Security and Medicare Taxes: About 36% of revenue is generated from these taxes, which support programs like Social Security and Medicare for retirees and older adults. It’s a system where current workers help fund benefits for those who have already retired.
🏢 Corporate Income Taxes:Around 10% of the total revenue comes from businesses, which contribute a portion of their profits to the federal government. This is reflected in the income tax provisions that companies report.
🧩 Other Revenue:The remaining ~4% is sourced from various channels such as excise taxes (extra charges on goods like alcohol and tobacco), estate taxes, customs duties, and even fees collected from national park visits.
2. Spending: Powering the Nation
Now that we’ve seen how money flows into the US Treasury, it’s time to explore the exciting part figuring out how it’s spent. The US government faces the enormous responsibility of keeping the country functioning, covering everything from national defense to healthcare and infrastructure. And that demands a massive amount of spending
In fiscal year 2023, the federal government's net cost was $7.9 trillion, which is almost as large as the combined GDP of Germany and Japan the world’s third and fourth largest economies!
-Outlays vs. Net Cost:In FY23, total outlays (the actual cash spent) reached $6.1 trillion. Outlays refer to the cash disbursements, while the net cost also includes accrual-based accounting adjustments, such as changes in the future value of federal employee retirement benefits.
Who’s Deciding Where the Money Goes
So, how does the government determine how to allocate all this money? It’s a balancing act involving both the President and Congress:
-The President’s Proposal: The President begins the process by proposing a budget, outlining spending priorities based on requests from federal agencies. Think of it as a wish list—with a lot of extra zeros.
-House and Senate Role:Next, the House and Senate Budget Committees take over. They review the President’s proposal, make adjustments, and ultimately create the final spending bills. This process involves hearings, debates, and a fair amount of political negotiation.
Types of Spending
-Mandatory Spending:These are legally required expenses, like Social Security and Medicare, which make up a significant portion of the budget. These costs rise over time, particularly as the population ages
-Discretionary Spending:This is the part of the budget where the President and Congress decide how much to allocate to areas like defense, education, and more. In FY23, discretionary spending accounted for roughly 28% of total outlays, and it involves a yearly struggle as various departments compete for funding.
-Supplemental Spending: In cases of emergency, Congress can pass additional funding outside the normal budget cycle, as it did for the COVID-19 pandemic in 2020.
Where the Money Goes
Now, let's dive deeper into the specific areas where all that spending is directed:
-🏥 Healthcare Heavyweight:The Department of Health and Human Services commands the largest portion of spending, making up 22% of the net cost. This reflects the huge outlays for healthcare programs like Medicare and Medicaid.
-👵 Social Safety Net:Programs like Veterans Affairs and the Social Security Administration also require significant funding, together accounting for 18% of the budget. This demonstrates the high priority placed on supporting veterans and retirees.
-🫡 Defense and Security:The Department of Defense, tasked with ensuring national security, takes up 13% of government spending!
-💸 The Interest Burden: A growing share of the budget is going toward paying interest on the national debt, consuming 9% of total spending.
In FY23, government outlays represented 22% of the US economy (GDP). Over the past decade, this figure has remained slightly above 20%, excluding the exceptional impact of the COVID-19 pandemic.
3. Bottom Line: Operating Cost & Deficit
When government expenditures exceed its revenue, a budget deficit occurs
In FY23, the U.S. government recorded a $1.7 trillion deficit (revenue minus outlays).
Here’s a breakdown of two key financial terms:
-Net Operating Cost:This includes all costs incurred by the government, even if the payments haven’t been made yet. In FY23, the net operating cost was $3.4 trillion
-Budget Deficit:This is a narrower measure, focusing only on the cash difference between revenue and outlays. As mentioned, the FY23 budget deficit stood at $1.7 trillion
Both of these financial measures reveal a government consistently spending beyond its means—a pattern that has persisted for decades. In fact, over the past 50 years, the U.S. federal budget has only seen a surplus four times, with the most recent one occurring in 2001.
4. National Debt: A Mounting Challenge
So, how does the government continue operating despite being in the red?
It borrows money, mainly by issuing Treasury bonds, bills, and other securities. This borrowing adds to the national debt, which has grown into a major concern for the country’s economic outlook.
As of September 2024, the national debt has reached a staggering $36 trillion. To put that in perspective, it's as if every person in the US owes over $100,000!
Every time the government spends more than it earns, the shortfall is added to the national debt, which, in turn, increases the interest payments that need to be made in the future.
Why the Debt Keeps Growing ?
Several factors contribute to the relentless increase of the national debt:
-Persistent Deficits:For decades, the government has continuously spent more than it collects in revenue, leading to ongoing debt accumulation.
-Wars and Economic Crises: Significant events such as wars (like those in Iraq and Afghanistan) and economic crises (including the 2008 recession and the COVID-19 pandemic) often necessitate large government expenditures, further escalating the debt.
-Tax Cuts and Spending Increases: Policy decisions that either reduce government revenue (through tax cuts) or increase spending (by introducing new programs or expanding existing ones) also play a role in growing the debt.
The national debt presents a complicated issue without straightforward solutions. It requires balancing essential funding for programs and services while ensuring the nation’s long-term financial health.
5. The Future: America’s Finances
The road ahead is filled with challenges. The national debt continues to rise, with a debt-to-GDP ratio surpassing 100%, raising concerns about the nation's long-term economic stability and ability to fulfill financial commitments.
According to the Department of the Treasury, the current fiscal trajectory is unsustainable. Projections based on existing policies show a persistent gap between expected revenue and spending. Without substantial policy reforms, the national debt is likely to keep increasing.
Several factors will influence the future of America’s finances:
-Economic Growth: A strong economy generates higher tax revenues, making it easier to manage the debt. Conversely, slower growth could worsen the deficit and increase the debt burden.
-Interest Rates:Rising interest rates would elevate the cost of servicing the national debt, redirecting funds from other vital programs.
-Inflation: Excessive government debt can contribute to inflation, diminishing the purchasing power of individuals and businesses.
-Political Polarization: The significant partisan divide in U.S. politics complicates consensus-building on fiscal policy and the implementation of long-term solutions to address the debt.
-Demographic Shifts: An aging population increases pressure on entitlement programs like Social Security and Medicare, leading to higher government spending and potentially widening the deficit.
To tackle the challenges of growing debt and deficits, a combination of strategies is needed:
-Controlling Spending:Identifying areas for budget cuts or finding more efficient methods to deliver government services.
-Increasing Revenue:Exploring avenues for raising revenue through tax reforms or other means.
-Fostering Economic Growth:Implementing policies that promote sustainable long-term economic growth and boost tax revenues.
-Encouraging Bipartisan Cooperation:Seeking common ground across party lines to implement lasting fiscal reforms.
The future of America’s finances remains uncertain, but one thing is clear: addressing the national debt and ensuring the nation’s long-term fiscal health will require tough decisions and a commitment to responsible financial management.
What Can Be Done?
It’s easy to feel overwhelmed by the scale of these challenges, but meaningful change often starts with informed citizens. As we head into a new election cycle, understanding how the US government manages its finances is more crucial than ever.
So, what do you think should be America’s financial priorities?
Should policymakers concentrate on cutting spending, raising taxes, or fostering economic growth?

Top Down Analysis 101: Getting started📖 Forex Top-Down Technical Analysis
🔸Top-down technical analysis is a method used by traders to examine the Forex market starting from higher time frames and gradually zooming into smaller ones. 🔸This approach helps traders get a comprehensive view of the market, starting from the broader trend on long-term charts and then analyzing intermediate and short-term charts to find precise entry and exit points.
📩 Here’s a step-by-step breakdown of how top-down analysis works in Forex trading:
1. Start with Higher Time Frames
🔸Begin by analyzing the market on the higher time frames to understand the dominant trend. Typically, traders start from the Monthly (M), Weekly (W), or Daily (D) charts.
🔸Monthly Time Frame: The monthly chart provides a bird’s-eye view of long-term trends and key levels of support/resistance. You can observe the major direction of the market, whether it is trending up, down, or moving sideways. This is where traders establish the broader market context.
🔸Weekly Time Frame: Moving down to the weekly chart helps to refine the broader trend you’ve identified on the monthly chart. It reveals more intermediate levels of support and resistance, trend lines, and key price action patterns that can influence the market over a few weeks.
🔸Daily Time Frame: The daily chart helps traders zoom in further to find relevant market structures, patterns, and price movements. It also helps you evaluate the short-term trend while keeping the long-term trend in mind.
📩At this stage, traders may look for things like:
🔸Trend Direction: Is the market in an uptrend, downtrend, or range-bound (consolidation)?
🔸Support and Resistance Levels: Key horizontal levels where price has previously reacted.
🔸Price Action Patterns: Candlestick patterns (e.g., engulfing patterns, pin bars) that indicate potential reversals or continuations.
2. Analyze Intermediate Time Frames
🔸After understanding the overall trend on the higher time frames, move to intermediate time frames like the 4-Hour (H4) or 1-Hour (H1) charts. These time frames give you a clearer picture of more recent price action and finer details for your analysis.
🔸Identify the Current Market Structure: Look for things like the formation of higher highs and higher lows (indicating an uptrend) or lower highs and lower lows (indicating a downtrend).
🔸Find Consolidation Areas or Breakouts: These time frames are useful for spotting breakouts or consolidations that may indicate the start of a new move.
🔸Refine Support/Resistance Zones: Draw closer support/resistance levels that are relevant to the current price action.
🔸This step helps you align your understanding of the intermediate trend with the higher time frame trend.
🎁Please hit the like button and
🎁Leave a comment to support our team!
RISK DISCLAIMER:
Trading Futures , Forex, CFDs and Stocks involves a risk of loss.
Please consider carefully if such trading is appropriate for you.
Past performance is not indicative of future results.

US Interest Rates: Impact on Global Markets and StrategiesUS interest rates are a cornerstone of the global financial system, wielding significant influence over markets worldwide. Set by the Federal Reserve (Fed), these rates dictate the cost of borrowing, the return on savings, and overall liquidity in the economy. However, the impact of US interest rates goes far beyond American borders, affecting currency pairs, stock markets, and global investment strategies.
This article explores how changes in US interest rates shape global markets, including their effect on currencies like EUR/USD and USD/JPY, stock prices, and the strategies investors can adopt to navigate rate hikes and cuts.
The Role of US Interest Rates in Global Markets
US interest rates, specifically the federal funds rate, are a crucial tool for managing the US economy, but they also play a critical role in global financial stability. When the Federal Reserve adjusts interest rates, it signals shifts in economic conditions, such as inflation control or economic stimulation, to investors and central banks worldwide.
Effective federal funds rate - Bank of New York
The influence of US interest rates extends beyond domestic policy. A higher US interest rate often attracts global capital, strengthening the US dollar as investors seek better returns. This shift in investment flows impacts foreign currencies, stock markets, and global economic growth, making US monetary policy a key factor in global financial strategies.
For example, a rise in US interest rates can strengthen the dollar and increase borrowing costs for emerging markets holding dollar-denominated debt. On the other hand, lower US interest rates can boost global liquidity, prompting investment in riskier assets like foreign equities or bonds. As such, US interest rates serve as a global benchmark, shaping monetary policy decisions and influencing investment strategies worldwide.
Inflation and US Interest Rates
Inflation is a central consideration in the Fed’s interest rate decisions. When inflation rises, the Fed typically raises interest rates to cool the economy by making borrowing more expensive, which in turn curbs consumer spending and business investment. Conversely, when inflation is low or the economy is struggling, the Fed cuts interest rates to encourage borrowing, boost spending, and stimulate economic growth.
The US Dollar Currency Index (DXY) dropped during the coronavirus pandemic despite the Fed raising interest rates.
However, the relationship between inflation and interest rates is a balancing act. If rates are cut too much or inflation rises while rates remain low, purchasing power can be eroded, causing instability in financial markets. In the global context, rising inflation in the US can weaken the dollar, affecting currency pairs like EUR/USD and USD/JPY, while inflation-related volatility in commodities like oil and gold can ripple across global markets.
For global investors, tracking US inflation trends and the Fed’s response is crucial for understanding potential shifts in exchange rates and market stability.
Impact on Currency Pairs
US interest rates have a direct impact on the US dollar’s value relative to other major currencies. When the Fed raises interest rates, the US dollar usually strengthens because higher rates offer better returns on dollar-denominated investments. This increase in demand for the dollar causes currency pairs like EUR/USD, GBP/USD, and USD/JPY to move in favor of the dollar, making these currencies weaker relative to the USD.
On the flip side, when the Fed lowers interest rates, the dollar typically weakens as investors look for higher returns in other currencies. As a result, other currencies gain strength relative to the USD, leading to significant shifts in global currency markets.
Moreover, interest rate differentials—the gap between interest rates in different countries—create opportunities for strategies like the carry trade, where investors borrow in a currency with low interest rates (such as the Japanese yen) and invest in a currency offering higher yields (like the US dollar). These strategies add further volatility to currency markets, especially when central banks adjust their policies unexpectedly.
Impact on Global Stock Markets
US interest rates have a profound influence on global stock markets. When the Federal Reserve raises interest rates, yields on US Treasury bonds increase, making them more attractive to investors seeking safer returns. This can lead to a shift away from equities, especially in riskier markets like emerging economies, and into bonds, causing stock prices to fall.
US Government Bonds 5 Years
US Government Bonds 2 Years
United State Interest Rate
Higher interest rates can also hurt sectors that are sensitive to borrowing costs, such as technology and consumer discretionary, which rely heavily on debt to finance growth. In contrast, financial stocks, particularly banks, often benefit from rising interest rates as they can charge more for loans, improving their profitability.
Conversely, when the Fed cuts interest rates, borrowing costs decrease, which can lead to a rally in stock markets. Sectors like technology and consumer discretionary tend to perform well in a low-interest-rate environment, as companies find it cheaper to borrow and expand. At the same time, dividend-paying stocks and real estate investment trusts (REITs) become more attractive as investors seek better returns than those offered by bonds.
Possible Market Reactions to a Fed Rate Cut
A Federal Reserve rate cut can trigger several reactions across global markets:
--Stock Market Rally: Lower interest rates reduce the cost of borrowing for businesses, potentially boosting economic activity and stock prices. Sectors like technology and consumer discretionary often benefit, while investors may also flock to dividend-paying stocks due to their relatively higher yields.
--Weaker US Dollar: A rate cut usually weakens the dollar, as lower rates make the currency less attractive to investors. This depreciation can benefit exporters and companies with significant foreign revenues but can hurt importers.
--Increased Inflation Risk: While rate cuts stimulate growth, they can also fuel inflation if demand exceeds supply. Investors may turn to inflation-protected assets like commodities or inflation-linked bonds.
--Emerging Markets: Lower US interest rates reduce borrowing costs for emerging markets, encouraging investment in their higher-yielding assets. However, a weaker dollar can lead to currency appreciation in these markets, impacting their export competitiveness.
--Bond Market Dynamics: A Fed rate cut can lead to lower yields on short-term US government bonds, pushing investors to seek better returns in long-term bonds or riskier assets.
Strategies for Managing Interest Rate Volatility
In periods of fluctuating interest rates, investors must adjust their strategies to protect portfolios and capitalize on new opportunities.
During Interest Rate Hikes:
--Shift to Bonds and Fixed-Income Assets: As interest rates rise, bonds, particularly short-term ones, offer higher yields, making them an attractive addition to portfolios.
--Focus on Financial Stocks: Banks and financial institutions benefit from higher rates, as they can charge more for loans, increasing their profits.
--Reduce Exposure to High-Growth Stocks: High-growth sectors, like technology, are more sensitive to rising borrowing costs and may underperform during rate hikes.
During Interest Rate Cuts:
--Increase Equity Exposure: Rate cuts often lead to stock market rallies, particularly in growth-oriented sectors like technology. Increasing equity exposure during rate cuts can help capture gains.
--Look for Dividend-Paying Stocks: In a low-rate environment, dividend-paying stocks become more attractive as investors seek yield.
--Consider Real Estate Investments: Lower rates reduce borrowing costs, making real estate and REITs more appealing as an investment.
Managing Volatility in Your Portfolio
To navigate the volatility caused by interest rate changes, diversification is essential. A well-diversified portfolio, spanning stocks, bonds, commodities, and currencies, can help mitigate the impact of rate fluctuations on overall returns.
Currency hedging is another key tool for managing volatility. When US interest rates rise, the dollar strengthens, potentially eroding the value of foreign-denominated investments. Hedging strategies using currency futures or options can protect against adverse currency movements.
Lastly, a focus on defensive stocks—such as utilities and consumer staples—can provide stability in uncertain times. These companies tend to have stable earnings and are less affected by interest rate changes.
Conclusion
US interest rates wield significant influence over global markets, affecting everything from currency pairs to stock prices. Investors must stay informed about the Fed's actions and adapt their strategies to reflect the current interest rate environment. By incorporating risk management tools like diversification, currency hedging, and a focus on defensive stocks, investors can better protect their portfolios and capitalize on opportunities that arise from interest rate fluctuations.

Become a TOP 1% Trader 🔸🔸What it takes to become TOP 1% Trader? Everybody wants
to succeed in the trading game, but what's the actual formula?
🔸🔸What can we learn from the most successful global hedge fund
Renaissance Technologies? How did the Japanese legendary trader
Takashi Kotegawa become a TOP 1% Trader? Rules of life of
undefeated savage Japanese samurai Miyamoto Musashi.
🔸🔸RetTec flaship fund got 40% CAGR over a period of 30+ years, which
is an exceptional trackrecord in the industry. RenTec utilizes HFT trading
and uses multiple quantitative / statistical / data science models to gain
an edge over the market. RenTec is one of the most secretive hedge funds
in the industry, however it's clear that the fund relies on algo trading
to generate it's exceptional returns.
🔸Complex Models: Renaissance's models are built upon intricate mathematical models and statistical analysis that leverage massive datasets.
🔸High-Frequency Trading: The firm executes trades at breathtaking speeds, taking advantage of fleeting market inefficiencies.
Key takeaways from RenTec success
1) Use algo trading / HFT trading to gain an edge over the market
2) Use data science / quant models to identify patterns
3) Use proper risk management for capital protection
4) Do not overleverage / use leverage over x20
🔸🔸Takashi Kotegawa is a legendary Japanese trader who
turned initial investment of 13 000 USD into 150 mln USD trading
Japanese stock market.
🔸🔸Risk Control: His approach to managing risk ensures that trades are executed within safe limits, without jeopardizing overall financial stability.
🔸🔸Seizing Opportunities: Kotegawa's ability to swiftly identify and act on market inefficiencies underscores the importance of vigilance and quick decision-making in trading.
🔸🔸Takashi Kotegawa keeps himself out of the spotlight and gives virtually no interviews. That's one of the reasons why we don't know much about him and there are only a few pictures available on the internet.
Key takeaways from Takashi Kotegawa's success
1) Disciplined approach to trading
2) Enter / exit trades and make fast decisions
3) Grind alone and stay out of spotlight
4) Remain humble do not show off keep low profile
🔸🔸The majority of the Japanese people know Musashi Miyamoto as Japan's most famous and most skilled swordsman. His status among the Japanese has reached mythic proportions in the same measure that Westerners would give to Muhammad Ali or Michael Jordan. The life of Musashi is the gold standard of samurai in Japan.
🔸🔸Musashi's introverted nature, which manifests as a preference for being alone or engaging in solitary activities, allows him to focus on his own thoughts and ideas. He is particularly skilled at problem-solving, often finding unique and unconventional solutions that others may not think of.
🔸🔸Musashi's approach to winning was formed from repetitive disciplined training, focused practice, knowing his opponent and unorthodoxy.
Key takeaways from Miyamoto Musashi success
1) Grind alone and become savage
2) Develop your own strategy unlike any other
3) Outsmart your competition always stay sharp
4) Become ghost and lead a low profile life
🎁Please hit the like button and
🎁Leave a comment to support our team!
RISK DISCLAIMER:
Trading Futures , Forex, CFDs and Stocks involves a risk of loss.
Please consider carefully if such trading is appropriate for you.
Past performance is not indicative of future results.
