Why You Need to Know Elliott WavesThis is an introductory article in a series on Elliott Waves, designed to explain the basics of the theory and how to apply it in practice.
We will cover the key points you’ll encounter while learning this theory and developing your trading skills.
Definition
Elliott Wave Theory is a method of technical analysis that explains price movements through repeating wave patterns that reflect crowd psychology.
Learning
Like anything new, learning this requires dedicated time. It involves identifying waves, counting them, and spotting corrections - a process that can be very engaging. You won’t immediately see waves and subwaves or find the perfect entry points. Be patient and give your mind time to grasp the concepts. Over time, recognizing familiar structures on charts becomes so absorbing that you won’t want to stop analyzing.
Technical Level
Anyone can learn this theory, regardless of their starting skill level. Prior knowledge of technical analysis is helpful but not required. Elliott Wave Theory offers a different perspective on the market and, for some, can become the primary way to interpret price movements. Since it is a popular method, you have many tools on TradingView for analysis and forecasting.
Reducing Noise
Another key advantage is reducing unnecessary information. When working with charts, you don’t need to overload your mind with news or market data. Chart analysis can reveal more than external reports. Imagine trying to track multiple markets across exchanges and countries - the context could be overwhelming. Elliott Waves help simplify this process. You can analyze independently, relying solely on the chart.
Universality
With this knowledge, you can trade any instrument - futures, options, indices, stocks, gold, silver, or cryptocurrencies. Some assets may require more effort to discern the wave structure, while others show clear patterns immediately.
Everyday Applications
Wave patterns can appear everywhere: price charts for household goods, car parts, flu incidence, or livestock growth. Life itself is a series of waves - rises and falls, successes and setbacks. Recognizing these patterns can help you understand and anticipate changes in many areas.
Mistakes
Mistakes are inevitable. You cannot avoid them. Whatever strategy you choose, whatever experience you have, Elliott Wave Theory will help you learn from them, and over time, your errors will become less significant.
Timeframe
This approach works on any timeframe - minute, hourly, or weekly. Smaller timeframes are useful for trading, while larger timeframes reveal trends that can span years. You can anticipate market behavior and understand economic or political trends locally and globally. Local patterns are always linked to the bigger picture.
Human Weaknesses
Fear and greed are obstacles every trader must overcome. Knowledge and recognition of patterns provide a foundation to regulate behavior. Without this foundation, achieving goals is difficult - whether in trading or in other areas of life.
Discipline
Discipline is essential. Even if you are naturally unsystematic, accurately identifying waves and choosing entries at the right time and place will gradually develop discipline and prevent random trading.
Calmness
By mastering your weaknesses and developing discipline, you will gain calmness - a critical skill for any trader. You will understand when the market may reverse, anticipate corrections, and know the general direction. While others panic, you will remain calm and act confidently.
Money
Elliott Wave Theory helps you preserve and grow your capital, turning the waves on the chart into financial waves in your life. The key is consistent effort and dedication, just as in any other discipline.
Magic
This may seem like magic, but it isn’t. This is the result of careful work and analysis, not magic. Another important point: if this theory did not work, it would have long been forgotten. On the contrary, the most successful traders use wave analysis in their market strategies. Elliott Wave Theory is a “superpower” that can surprise both others and yourself.
Conclusion
Elliott Wave Theory is not a magic solution and offers no absolute guarantees. It is a tool that must be learned and applied correctly. Experience and accurate wave identification are essential, and it can be combined with other technical analysis methods.
Perhaps this is the gold you’ve been searching for.
Future articles will show live examples of how it works.
It will be very interesting, so stay tuned and don’t miss out.
Elliott Wave

Five Bubbles of TechnocracyGreetings, reader. Happy New Year!
The year 2026 is here—and it looks to be a challenging one for the bulls.
With it comes the "beginning of the end": the predictable bursting of the AI bubble. Your idols—Nvidia, OpenAI, massive Data Centers, and other tech icons that seemed to grow to the heavens—are finally falling back to earth. The speculative froth is evaporating, and the panic-stricken crowd is frantically searching for the Emergency Exit . There is nothing new under the sun: after a period of excess in the Western equity markets, we are witnessing yet another tragicomedy accompanied by the indignant cries of: “I never saw this coming!” 🤦♂️
Most analysts and investors are blinded by the current brilliance of the Data Center and AI bubble. They argue over Nvidia’s fundamentals and debate the exact timing of the crash. This is mere noise obscuring the grand design. This article is not about the AI bubble as a "random" or "unforeseen" failure. It is about the fact that financial bubbles over the last 50 years have not been anomalies—they are logically necessary, sequential stages in the construction of a Global Technocratic Infrastructure .
Each cycle served a specific purpose: attracting billions, then trillions of dollars to build a new layer of the system before collapsing to eliminate weak participants. Technocracy is being built according to a precise blueprint, and we can track its evolution through five sequential speculative cycles, each solving a bottleneck created by the previous one.
The Five Stages of Evolution: From PC to Nuclear Autonomy
1️⃣ The Genesis (1980s, Nifty Fifty): Establishing the user and the data collection point (PCs and mass electronics).
2️⃣ Connectivity (1990-2000, Dot-com): Laying the data highways (The Internet and fiber optics).
3️⃣ The Brain (2020-2025, Data Centers/AI): Developing the intelligence to process this colossal flow of information.
4️⃣ Order (2026–2028 Forecast, DLT/Tokenization): Systematizing and automating ownership, data, and assets.
5️⃣ Autonomy (Post-2030 Forecast, SMR/Uranium): Ensuring the invulnerability and uninterruptible power of this energy-intensive global system.
The "new money" gamblers—I mean, "young investors"—who bought the peaks will spend 2026 screaming about "Black Swans," searching the news feed for reasons why their favorite stocks are crashing. We, looking at the long-term horizon, must simply state the facts: we are witnessing the collapse of yet another financial bubble . It has already fulfilled its mission: attracting trillions to build the Artificial "Brain" (AI/DC) for the future technocratic system, redistributing capital from the greedy to the disciplined, and from retail to the institutional players.
For most, the 2026 crash will be a tragedy. But for insiders and my subscribers, it is the return of common sense, logic, and objective reality . The coming collapse is a sobering moment from the "AI-idiocracy" and the market madness of the last two years. It is the short-lived triumph of the truth we have analyzed here for years—a return from the pink clouds of AI hallucinations to the solid ground of reality .
The Five Bubbles of Technocracy is not just a market cycle analysis; it is the revelation of a grand design . The construction of a Digital Infrastructure of Control is not a future dream; it is a global conceptual project that uses the crowd's speculative mania as a free capital pump. This article will show how this pump has functioned for 50 years and where it will direct capital in the coming decade.
❗️ Disclaimer: A brief note for new readers. My goal is not to offend, but to analyze clearly. To understand these processes, we must call things by their real names —without sugarcoating. If you are accustomed to mainstream media and "influencers" who tell you polite half-truths and pleasant lies, this analysis may not be for you. The truth can be bitter, but it destroys illusions. If you are not ready for that, do not read further.
Let’s dive in!
________________________________________
📟 Introduction: The Era of Technocratic Bubbles
________________________________________
⚙️ From Nifty Fifty to SMR: How Speculation Funded the Global Technocratic Order. This article is not about the "AI bubble" as an error; it is an obituary for 2025 and a manual for the next 5-10 years. I will demonstrate that the financial bubbles of the last 50 years are not a random series of crises, but logical, sequential steps in assembling a global infrastructure. Technocracy follows a cyclical plan. The current crash is merely the final chord of Bubble #3 and the launchpad for Bubbles #4 and #5.
The Five Stages of Evolution: Where the Capital Flows We will trace this path to see how the 2026 collapse clears the field for a new, even more cynical speculative mania:
🎈Bubble #1: Creating the User (1980s): Established the point of data collection.
🎈Bubble #2: Connecting the Network (2000): Laid the global internet channels.
🎈Bubble #3: Building the "Brain" (2020–2025): Created the intelligence currently undergoing a painful revaluation.
🎈Bubble #4: Order and Control (2026–2028 Forecast, DLT/Tokenization): The next mega-bubble. Capital will flee to where they promise to "systematize" data through DLT and smart contracts.
🎈Bubble #5: The "Perpetual" Engine (Post-2030 Forecast, SMR/Uranium): The strategic goal—ensuring energy autonomy for the entire system.
________________________________________
🖥️ Part I. Building the Crowd, the Internet, and the Algorithms: Bubbles #1, #2, and #3
________________________________________
💥 Bubble #1: The Nifty Fifty and the Rise of Japan (1980s). Establishing the Data Collection Point (PCs and Electronics)
What was the Nifty Fifty? It was a list of approximately 50 "blue-chip" stocks in the late '60s and early '70s that were considered so reliable and innovative that investors believed in their "eternal growth," regardless of economic cycles. This bubble was directly tied to the rapid proliferation of electronic and computer technology, which ceased to be the exclusive domain of corporations and states. The transition from Mainframes to PCs: the emergence of personal computers (Apple II, Commodore 64, IBM PC) was a turning point. Technology became personal, understandable, and affordable due to economies of scale. Introducing PCs into homes and small businesses created millions of "users" for the first time. This was a critical aspect for the Technocracy—establishing a population base accustomed to generating and digitizing data.
📈 Chart: Nikkei 225 (1950 — 2040)
The Japanese index INDEX:NKY Nikkei 225 serves as a colorful historical example, tracing its trading history from the 1950s to the present. To put it briefly: following the end of WWII, when the world was re-divided into spheres of influence, the United States invested heavily in the development of Japanese industry, specifically in various technologies. This was a strategic investment in a technocratic ally and a manufacturing hub.
The Pump Phase (1950s – 1980s): The Nikkei 225, acting as the locomotive of the tech boom, grew without serious pullbacks until the late 1980s. Even the 1973 oil crisis, which hit Western nations hard, largely spared Japan. The index saw only a minor -35% correction before surging +1000%, setting an all-time high and nearly touching the 40,000-point mark by the early 1990s. This was the peak of the technocratic premium for creating mass-market consumer electronics and PCs, which successfully solved Task #1: creating a global "user base. "
The Payback and Decline Phase (1990s – 2008): Once the Nifty Fifty bubble and the associated Japanese real estate boom burst, the Japanese stock market entered a prolonged, "fascinating journey" of a downtrend that lasted 19 years, resulting in a -80% drop from its ATH. Japan had fulfilled its function, and capital flowed toward the next objective.
The Recovery (2008 – 2025): Amidst the 2008 global financial crisis—after dropping -60% from its local high and retesting the 2003 lows—the index began a long, slow recovery. Only in 2025 did it finally surpass the peaks of the bubble from 36 years ago. It took the Japanese index three and a half decades just to recover to its 1980s highs!
The Big Question: Is the Japanese economy doing so well today that the index is hitting new highs? Hardly. The reality is quite the opposite. Japan's national debt leads the world at over +250% of GDP 🤯 and continues to grow. Chinese and Korean competitors have long since captured market share and technology leads, Japan's demographics are in terminal decline, and the country lacks both resources and territory. However, they have a printing press, the "Carry Trade," and a strong alliance with the US. This maintains the facade of the Japanese economic "miracle." This is what the life-giving power of infinite money emission, carry trades, and zero interest rates does to asset prices and the INDEX:NKY index.
◻️ In the 1980s, the world wasn't ready for AI yet, but it was ready for a "new era of eternal growth." This was the first major speculative premium the market paid for technological dominance.
The Nifty 50 Idol: This group of stocks (IBM, Xerox, Polaroid, etc.) traded at astronomical P/E ratios. Investors believed these companies were "too big to fail." This was the first instance of faith in a technocratic elite that supposedly held a monopoly on the future. This faith was pure speculation, disguised by the slogan: "technology is invincible."
The Fundamental Order: The purpose of this bubble was practical: attract capital to scale production and, most importantly, make PCs and electronics affordable. The Technocracy didn't just need mainframes for the Pentagon; it needed a "mini-PC in every home"—in other words, data collection points.
The Role of Japan: Japan acted as the primary innovator of mass production. Companies like Sony and Toshiba made technology fashionable and accessible (Walkman, color TVs, semiconductors). The Japanese real estate and stock market bubble of the '80s was simply a colossal financial pump that provided the Technocracy with its necessary user base.
◽️ Bubble #1 Outcome: The bubble burst, fueled by the "eternal growth" of the Nifty Fifty, but it left behind the essential: millions of people accustomed to computers and devices, and a global manufacturing base to create them. The User was created, the crowd was ready. Moving on.
________________________________________
🌐 Part II. Bubble #2: The Dot-com Crash (2000). Building the Data Highways (Internet and Connectivity). Communication Infrastructure as the Logical Growth of Technocracy
________________________________________
If the 1980s focused on computerizing individual locations (the PC), the 1990s created an urgent need to connect those millions of computers. The emergence and standardization of the Internet i as a public network was the solution. Technocracy shifted from creating individual tools to building a global communication system.
The "Pipes" and Speed: Colossal investments flowed into laying fiber-optic cables and manufacturing networking hardware (Cisco Systems) . The prevailing belief was that "bandwidth" could never be excessive.
Network Software: An explosion of companies creating web servers, browsers, and early online services (AOL, Yahoo!) . This marked the transition from local software installed on a disk to networked software.
Profitless IPOs: In the final phase, thousands of companies went public with nothing but a business plan and a .com domain. The key metric wasn't profit, but "eyeballs" or user count. Thus, WEB 1.0 was born.
The Technocratic Move : The bubble created the channels for data transmission. Technocracy realized its networked nature and laid the "arteries" necessary for the PCs of the 80s and 90s to exchange information.
📈 Chart: NASDAQ-100 (1990 — 2040)
When the "Japanese Economic Miracle" was sidelined in the early 1990s, leaving the Nikkei 225 to fall -80%, capital was already redirected to the next task. During the decade Japan’s market spent in a knockout, the US index FX:NAS100 surged +2000%.
The Pump Phase (1990s): The Dot-com bubble was a cynical fundraising campaign to lay global arteries—fiber-optic networks and communication protocols. In March 2000, it hit an ATH of 4800. This was the premium paid for the promise of connecting the "crowd" established in Bubble #1.
The Payback Phase (2000–2002): Once the infrastructure task was essentially solved (the pipes were laid), the bubble burst. In a two-and-a-half-year decline, the NASDAQ-100 crashed -83%, bottoming out just below 800 points.
The Recovery: It took the index sixteen years just to reclaim its 2000 ATH. This clearly demonstrates that once a strategic mission is completed, an asset class can be left in stagnation until it is needed again.
Key Insight: The Role of Post-2008 Liquidity. Even the 2008 Global Financial Crisis didn't crush the NASDAQ-100 as severely as the dot-com bust; it fell "only" -54% from its 2007 highs, without breaking the 2002 lows.
A New Driver: From 2008 onward, a new and much more aggressive game began. We’ve seen an almost uninterrupted rally, showing over +2000% growth from the 2008 lows.
Selling the Narrative: While the growth of the tech-heavy NASDAQ-100 can still be "sold" to the crowd using the success of Big Tech giants, why are European, British, and Japanese indices hitting new ATHs today? The answer is simple: the true driver is not earnings, but liquidity, carry trades, and buybacks , fueled by media narratives and hype.
Focus on GLI: Since 2008, the Western stock market has essentially acted as a STERILIZER for excess liquidity from the Eurodollar system . Looking at the Global Liquidity Index (GLI) chart, it is clear what the PRIMARY driver of stock market growth really is. The media narratives used to explain the rally to the masses are secondary.
Conclusion: The Dot-com bubble created the channels (The Internet). The 2008 crisis created an unprecedented flood of liquidity, providing the fuel for the next stage: creating the Brain to process the data flowing through these channels.
◻️ The Dot-com bubble was about infrastructure and access. Once the masses had their computers and gadgets, the logical problem arose: how to connect them into a single network so data could flow freely?
The "Pipes" Bubble: This was a pure infrastructure bubble. Speculation revolved around companies promising to lay fiber (WorldCom, Global Crossing) or sell the hardware for it i . Investors poured billions into profitless companies that simply had a plan to "build the tubes."
The ".com" Hysteria: The tragicomedy peaked when any company with a ".com" suffix was hailed as the future—even if they were losing money on every transaction. Behind this circus was a strategic mandate.
The Fundamental Order: Lay the arteries for WEB 1.0, WEB 2.0, and eventually WEB 3.0. For Technocracy to manage the world, it needs advanced communication channels. This bubble forced private capital to fund a global network that otherwise wouldn't have been built so rapidly.
The Cynical Outcome: The bubble burst, leaving behind "dark fiber," bankrupt telcos, and thousands of failed businesses—but the infrastructure remained. The survivors (Google, Amazon, eBay) inherited cheap, surplus data channels. These companies later used this infrastructure to collect and process the data that would lead us to Bubble #3.
◽️ Bubble #2 Outcome: The bubble left behind the communication channels (The Internet). The masses are now connected and constantly generating data.
________________________________________
💻 Part III. Bubble #3: Creating the Intelligence—Data Centers and AI (2022–2025). The Construction of the "Brain" (Big Data Processing) 🧠
________________________________________
After the previous two bubbles created billions of connected devices and a global network, we faced a new bottleneck: there is too much data, and it moves too fast.
The Primary Driver: The urgent need to process, analyze, and monetize vast volumes of information in real-time.
The Technocratic Shift: The focus has moved from communication infrastructure to "intelligence" infrastructure. Ownership of data is no longer enough; the value now lies in the ability to "digest" it for automated decision-making and social control.
Generative AI (LLMs): The rise of Large Language Models (ChatGPT and its peers) proved that AI could be a mass-market, transformational product, sparking a global corporate arms race.
Data Centers (DCs) and GPUs: Training and running these models requires astronomical computing power provided by hyperscale Data Centers. Specialized GPUs i became the literal "accelerants" of this technocratic evolution.
Concentration of Power: Unlike the Dot-com era, speculation today is concentrated in a handful of Mega-Caps that control the silicon and the cloud platforms.
As of late 2025, the AI bubble’s momentum is visibly fading. Beyond the hype of "AI will save us all," we must account for the Political Engineering factor.
The Political Trigger: In the context of a shifting liberal world order and internal corporate-oligarchic friction in the US, the stock market is more sensitive to political influence than ever before.
The Game of "Hot Potato": The AI bubble was inflated under the Biden administration starting in 2023. Now, the Republicans and Trump face the fallout in 2026—just in time for the Congressional Midterm Elections. The MAGA team’s delay in forcing the Fed to aggressively cut rates in 2025 has left them vulnerable. The longer you stretch the rubber band, the harder it snaps back.
The November 3, 2026 Midterms:
1. All 435 seats in the House of Representatives are up for election.
2. 35 out of 100 Senate seats are at stake.
3. 36 State Governors will be elected.
4. Thousands of state legislative and administrative positions are on the line. A crash in 2026 would likely lead to a "Divided Government," blocking the MAGA agenda and creating a springboard for the Democrats in 2028.
◻️ The "Rescue" Scenario: The appointment of a new Fed Chair in 2026 will likely be marketed as a "market rescue," launching another round of unlimited QE (Quantitative Easing). The Eurodollar system cannot function without it, but new QE requires a catalyst: a sharp "Risk-OFF" event and a market correction of -40-50%, similar to 2008. The fiat model survives only on FAITH and liquidity injections.💸
◻️ Price vs. Value: Do not confuse speculative bubbles with technological progress. The Price of overextended AI stocks is not the same as the Value of the technology itself. Just as the PC survived the Nifty Fifty crash and the Internet survived the Dot-com bust, AI will continue to integrate into our lives after the 50% "sobering up" of 2026. This isn't an accident; it's the end of Stage Three.
The Bottleneck: 40 years of digitization (Bubble #1) and global networking (Bubble #2) left us with a mountain of data that was useless without a way to "digest" it.
The Fundamental Mandate: Create the "Brain"—AI algorithms and Data Centers capable of real-time global management.
The New Idol: Investors deified the chips i and the cloud (Microsoft, Amazon) . The speculative premium was paid for the expectation of a monopoly on intelligence.
The Strategic Outcome: The crash doesn't mean AI failed. It means the capital required to build the core infrastructure i has been successfully harvested and deployed.
◽️ Bubble #3 Outcome: The AI/DC Bubble is the culmination of the previous cycles. It elevates the Technocracy by making computation the central nervous system of society. However, this system has two critical vulnerabilities that lead us directly to the next two cycles:
1) Data Order: Data is collected and processed, but it must be systematized, secured, and property rights must be automated (Enter Bubble #4).
2) Energy Demand: The unprecedented power required by Data Centers makes energy the next critical "commodity" (Enter Bubble #5).
This part of the translation deals with the transition from "Intelligence" to "Systematization." I have adapted the sharp Russian metaphors (like the "rectal suppository" analogy) into a more sophisticated but equally biting critique of financial engineering and behavioral economics that will resonate with the Western "contrarian" and "macro" investment communities.
________________________________________
🏦 Part II. Asset Systematization: Bubble #4 (2026–2028 Forecast)
________________________________________
🗣 "We’ve always used technology to better serve our clients, and we’re going to do the same with tokenization. Tokenization and blockchain are real." — Jamie Dimon, CEO of JPMorgan
🗣 "Tokenization is the future. It’s time to move all assets onto the blockchain." — CEO of Coinbase
🗣 "The potential for tokenization extends to real estate, stocks, bonds, and beyond. The industry is only at the beginning of this journey." — Larry Fink, CEO of BlackRock
🔗 Bubble #4: DLT and Tokenization. Establishing Order (Distributed Ledger Technology and Smart Contracts). Systematization, Transparency, and Automation of Assets.
The AI/Data Center bubble (#3) generated an incredible amount of data and algorithms but failed to solve a fundamental problem: how do we manage ownership rights and automate transactions for this data and the real-world assets they represent?
The Primary Driver: The demand for absolute transparency, immutability, and automated management. Traditional financial and legal systems are too slow and expensive for a real-time world.
The Technocratic Shift: Technocracy is moving toward an automated, transparent asset management system. This eliminates intermediaries, standardizes processes, and makes the entire system controllable at the protocol level.
Tokenization: Converting real-world assets (Real Estate, Private Equity, Commodities, Stocks) into digital tokens. This opens the door to massive liquidity and fractional ownership, attracting trillions of dollars.
Smart Contracts: Code that automatically executes transactions without lawyers or banks. It is the perfect tool for technocratic automation.
DLT/Blockchain: The technology that ensures ledger immutability, removing the need for centralized trust.
📈 Chart: GLI, S&P 500, and Selected DLT Assets (2019 – 2029)
In the previously published analysis: 🩻 Anatomy of AI Illusions. 2026–2028 Forecast , I broke down the pump mechanism of 2021-2025.
The Master Driver — Liquidity: Since 2019, the S&P 500 and the crypto market have moved in lockstep with the Global Liquidity Index (GLI). When liquidity is drained ("dried up"), a correction follows. When the system is flooded with "helicopter money," it flows into high-speculation bubbles to vent the excess pressure. The masses, lured by media and "fin-fluencers," buy the peaks, burning their capital to fund the next stage of Technocratic development.
The mechanism is simple, bold, and cynical — but highly effective:
1) Organize a crisis and panic (buy up devalued assets) →
2) "Save" everyone by printing piles of paper — QE (continue accumulation) →
3) Distribute cash to the masses under the guise of "care" (continue driving prices up) →
4) Inflate a market bubble in the sector of your choice (begin stealthy offloading) →
5) Use media and social networks to lure "dumb retail" into buying at the highs (sell more aggressively) →
6) Continue offloading into the naive herd, feeding them stories via MSM while the market slides →
7) Organize a new crisis and panic (begin buying back the necessary devalued assets) →
8) Once the plebs have forgotten everything, or "new" un-scared investors enter the market — repeat the scheme...
The "greater fool" theory remains the most reliable engine of the financial world. 🤷♂️
The GLI Cycle and QE Synchronization: According to the CrossBorder Capital GLI model, we expect a peak in late 2025 followed by a decline through 2027. Markets will likely bottom out in late 2026 amidst falling liquidity, aggressive rate cuts, the AI bubble burst, and a "post-facto" recognition of a global recession. In late 2026, a new Fed Chair will step in to "save" the US economy. 2027 will see a recovery, and 2028 will bring the explosive culmination of Bubble #4. The goal of this new QE is to absorb old debt through stablecoins and "trap" the digital dollar in a regulated loop, preventing it from leaking into the physical economy and causing hyperinflation.
🛠️ The Instruments for Bubble #4:
For the "Tokenization of Real-World Assets" (RWA), institutional capital needs controlled, scalable platforms. I have selected three primary "horses" for Bubble #4: Ethereum (ETH), Solana (SOL), and Hedera (HBAR), along with three infrastructure plays:
Ethereum (ETH): The Regulatory and Institutional Hub. It provides the financial gravity needed to legitimize the RWA market.
Solana (SOL): The High-Throughput Engine. Its "VISA-level" speed is critical for high-frequency trading and billions of micro-transactions.
Hedera (HBAR): The Enterprise Ledger. Governed by a council of global corporations, it provides the legal maturity and security required by supra-national organizations.
Infrastructure Plays: Chainlink (LINK) as the bridge between smart contracts and real-world data; Avalanche (AVAX) for institutional "subnets" with KYC/AML compliance; and Polygon (POL) as the mass-adoption gateway for Web2 brands.
❓ Where is BTC? Bitcoin is the "evergreen bubble." Its job is to be the billboard and the locomotive for the industry. But being first doesn't mean being the ultimate winner. Think of the pioneers: IBM 5150, Motorola DynaTAC, Nokia 9000, Kodak. Where are they now? Most are either gone or secondary players in the indices. Bitcoin will likely face a similar fate once its function is fulfilled.
💡 Why Bubble #4 is Inevitable:
The "Smart" Data Flood: Every gadget today—from "Smart" TVs and watches to Tesla cars—is a sensor (Camera, Mic, GPS) gathering data. This creates a chaos of information that requires a unified, automated ledger.
The Trust Crisis: To function, the Technocracy needs stable ledgers, not chaotic, open-source forks. DLT is not for "crypto-anarchist freedom"; it is for the stability and invulnerability of the system’s records.
The RWA Narrative: After 2026, DLT will be marketed as the "savior" from a corrupt, slow banking system. It will facilitate the digitalization of everything—Real Estate, Commodities, and Equity—into an automated, traceable turnover.
◽️ Outcome of Bubble #4: From Dot-com to Tokenization
The 2026-2028 DLT bubble is the logical heir to the Dot-com era. If Dot-com built the pipes for information , Tokenization builds the protocols for value and ownership . Most crypto-influencers miss the big picture. They pray for an "Alt-season" in their sandbox while failing to see that the cryptomarket was created as a testing ground for a new digital economy . If the public isn't ready for a direct "CBDC" injection (as seen in the failure in Nigeria), the system will introduce it through the "back door" via stablecoins and RWA. By 2030, after "The Great Depression v2.0" and "Great Reset" of old debts, the infrastructure will be ready for the final step:
DLT → Digital ID → CBDC → UBI
Technocracy will achieve (die Ordnung) Order!
________________________________________
⚛️ Part III. The "Perpetual" Engine: Bubble #5 (Post-2030 Forecast)
________________________________________
⚡ Bubble #5: SMRs, Microreactors, and Uranium. Establishing Autonomy and Invulnerability. Uninterruptible Power and Infrastructure Defense
The Problem: Conventional, centralized power grids cannot keep up with the exponential growth in demand from Data Centers, each requiring megawatts of power comparable to a small city. A technocratic system built on blockchain and AI cannot rely on unstable or centralized infrastructure.
The Primary Driver: The need for autonomous, powerful, and secure energy sources that can be deployed locally—next to consumption hubs like Data Centers, industrial clusters, and remote strategic facilities.
SMRs (Small Modular Reactors) and Microreactors (μR): These are the ideal solution. They can be mass-produced, rapidly deployed, and placed directly adjacent to hyperscale DCs. This eliminates long-distance transmission losses and makes the "Brain" of the system energy-independent.
Satellite Internet: Continued investment in low-earth orbit (LEO) networks (Starlink, Kuiper) ensures global, resilient connectivity. The ultimate vision—already hinted at by the likes of Elon Musk—is an autonomous "3-in-1" orbital complex: a satellite equipped with its own SMR and on-board Data Center. This is the ultimate guarantee of security, far removed from any "ground-level" threats.
The Technocratic Shift: Creating an invulnerable, distributed, and energy-autonomous system. This is the final stage that makes the entire technocratic structure truly self-sufficient and globally dominant.
◽️ Thus, Bubble #5 is the final chord. Once completed, the infrastructure will be fully realized:
1. Users and Data (The 80s).
2. Connectivity (The Dot-com era).
3. Processing Intelligence (The AI/DC era).
4. Systematized Order (DLT/RWA).
5. Autonomous Energy (SMR/Uranium).
The sequential construction—from PCs to global AI Data Centers and DLT networks—has generated a critical energy deficit.
The Bottleneck:
The infrastructure built across the first four bubbles is an energy-hungry beast. Centralized grids cannot provide the stability or autonomy required.
The Fundamental Mandate: Energy Autonomy. Technocracy cannot depend on political shifts, geopolitical conflicts, or the intermittency of "green" energy—we'll leave those for the distracted masses. It requires its own local, powerful, uninterruptible power source.
The New Idol: Small Modular Reactors (SMRs). Forget the old, cumbersome nuclear plants of the past. We are entering the era of compact, factory-built energy units acting as "batteries" for the industrial and digital elite.
The Speculative Core: This bubble will be marketed under the banner of "Energy Independence," but its true purpose is to fund the global energy pivot toward autonomous AI and DLT networks.
The Raw Material: Bubble #5 transforms Uranium from a mere commodity into the strategic fuel of the future civilization. This is the ultimate long-term investment thesis: uranium demand will grow exponentially to feed these autonomous nodes of power.
☢️ Uranium: Its Future and Ours. 2026–2050 Forecast
⬇️ Link to the detailed analysis: ⬇️
🔑 Strategic Insight: The Speed of Cycles Not all bubbles are created equal. Bubbles #1 and #2 (PC and Internet) moved slowly because they required physical construction —laying fiber, building factories, and logistics. Bubbles #3 and #4 (AI and DLT) are lightning-fast because they are "born digital" and leverage existing hardware. Here, the "Hype-to-Crash" cycle has compressed from decades into 3–5 years.
Bubble #5 (SMR/Uranium) is a return to physics . You cannot "copy-paste" a ton of uranium or spawn a thousand nuclear reactors overnight. This cycle is tied to the slow, fundamental commodities super-cycle. It will not unfold in a few years, but likely over two or three decades. It is the most reliable strategic asset, for without autonomous, uninterruptible nuclear energy, the entire technocratic machine simply cannot exist.
________________________________________
🏁 Summary and Conclusions
________________________________________
There is the panoramic view. As you read this in early 2026, you are not looking at a chaotic market, but a shift in structural priorities. We have seen that 50 years of financial "excess" were not mistakes or system "bugs"—they were the "features" of a successful engineering project to fund the Technocracy:
✅ Past (Bubbles #1, #2, #3) - DONE: Data collection, connectivity, and the creation of algorithms and AI are largely complete.
▶️ Present (Bubble #4) - START: Capital is migrating into DLT/Tokenization to bring order to global assets.
🎯 Future (Bubble #5) - STRATEGY: Strategic capital is already taking positions in Uranium and SMRs, recognizing the final, most fundamental asset of the New Technocratic Order .
The construction of this New Babylon through the Five Bubbles is not a future dream; it is a global conceptual project using the crowd's speculative mania as a capital pump . Your task is to understand which stage of construction the money is flowing into—and to avoid being the one who buys "idols" at their peak once their mission is complete.
A project of this scale does not rely on a single generation of investors or a single nation-state. The emerging Technocracy does not care who sits in the Oval Office. This is a multi-generational, long-term blueprint orchestrated by supra-national conceptual power . These forces move the needle behind the scenes, far from the "theatre of democracy" and the temporary political actors shown on the mainstream news. Those who truly hold the strings of global management will never be televised.
1️⃣ Strategy for 2026–2028: DLT and Debt Absorption (Bubble #4)
The next "idol" the market will deify is Digital Money (Stablecoins/CBDCs), Tokenization, and DLT . Capital will migrate en masse into technologies promising absolute transparency and automated accounting. This is an inevitable mania designed to digitize assets and—cynically—provide the technical framework for "writing off" the legacy debts of the old hegemon. The plan: accumulate the crypto-assets discussed in this analysis monthly throughout 2026 (ideally starting in the summer) with a focus on 2028. The goal is not to "catch the bottom," but to deliberately build a portfolio while the panic-stricken crowd is selling.
2️⃣ Strategy for 2026–2050: The Foundation of Autonomy (Bubble #5)
The most coveted asset of the Technocracy is invulnerability. Invulnerability equals autonomous nuclear energy. While speculators are driven into the RWA/DLT bubble in 2027–2028—tokenizing their last remaining possessions—strategic capital will have already occupied positions in assets that power the "AI Brain" for decades. We are talking about Small Modular Reactors (SMRs) and the raw materials that fuel them.
To survive the 2026 crisis, the subsequent 2029–2033 depression, and ultimately enter the Brave New World of Cyberpunk , your primary task is not to be part of the distracted masses . Do not buy the "idols" at their peak when their mission is already accomplished. Instead, use the 2026 collapse of the "AI-idiocracy" as a window for strategic positioning .
The core purpose of the ideas published on this channel is to cultivate a broad, objective, panoramic vision for my subscribers. This conceptual clarity is achieved through constant self-work: maintaining a sober mind, developing critical thinking, and utilizing impartial logic. Do not follow the herd as it gallops toward the abyss in yet another fit of FOMO and euphoria.
Our goal is for as many rational and enlightened individuals as possible to pass through the "bottleneck" of 2020–2030. We want you to emerge from the hybrid chaos of the current era, the burst of Bubble #4, and the resulting Great Depression 2.0, as survivors ready for the future.
Happy New Year!
Support this idea with a 🚀 rocket and a constructive 💭 comment to keep it from drowning in the ocean of useless information noise.
🙏 "Thank you for your attention to this matter"©
☘️ Good luck, stay safe!
📟 Over and out.

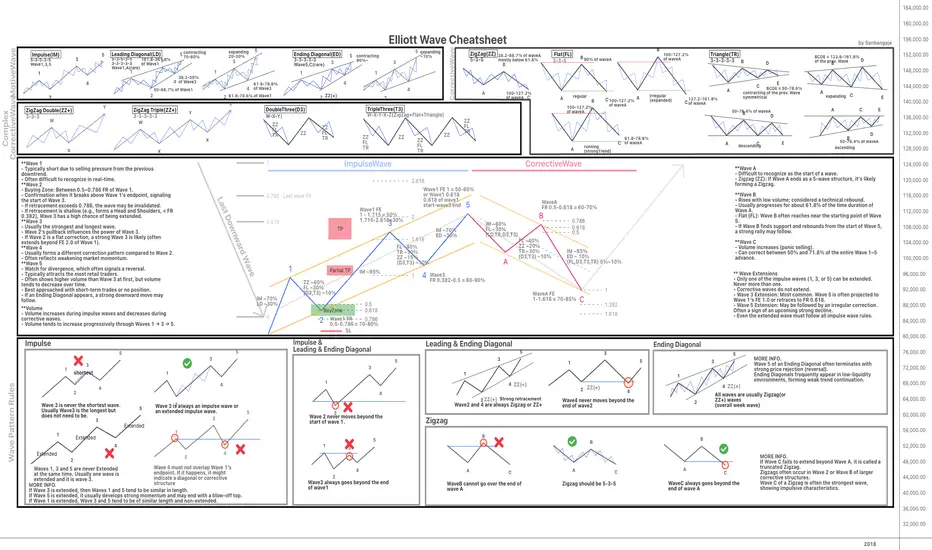
Elliott Wave Rules: Quick Cheatsheet for TradersHello everyone! I'm happy to share this Elliott Wave Cheat Sheet that I personally created during my journey. I hope this guide is helpful to the community.
This chart is designed to provide a quick, at-a-glance overview of the core Elliott Wave principles and patterns. Please note, it is just a summary of the main theories.
To dig into further and truly master the concepts, I highly recommend consulting the foundational texts:
* Elliott Wave Principle: Key to Market Behavior by A.J. Frost and Robert Prechter
* Mastering Elliott Wave by Glenn Neely
** Best viewed with QHD resolution (2560x1440)
** If the chart appears slightly squeezed vertically, you can adjust the aspect ratio by dragging the Price Panel (Y-axis) on the right side of the chart.**
**You can download the PNG version of this chart here:
drive.google.com
Happy Trading!
Elliott Wave or NEoWave? Which on is better?A common question people often ask is: Should I learn Elliott Wave or NEoWave? Which one is better? And do I need to study Elliott Wave first before moving on to NEoWave?
Let’s break it down.
The classic Elliott Wave theory originates from the book Elliott Wave Principle, written and compiled by Robert Prechter and A.J. Frost.
Both authors were not the original creators of the theory .. they simply collected and organized the works of Ralph Nelson Elliott, whose ideas were scattered across various sources, and compiled them into a single book.
Given the context of that era .. the trading environment, technology, and available tools .. it’s fair to say R.N. Elliott developed the theory to a level that was almost complete for his time.
Back then, there were no PCs, no laptops, no internet… and charts had to be drawn by hand.
In that sense, Elliott was genuinely a genius.
But despite its impact and popularity, the classical version still contains many weaknesses.
And someone eventually stepped in to identify those flaws .. a passionate young man named Glenn Neely, who dedicated himself to studying wave theory seriously and wanted to eliminate the criticism that Elliott Wave was nothing more than “a subjective theory that doesn’t work in real trading.”
Because he was born in an era where computers were emerging and technology was accelerating, he had the thought of applying science and mathematics to make wave analysis more accurate and repeatable.
After more than seven years of work, Neely published an extremely complex .. and extremely difficult .. book: Mastering Elliott Wave.
This book essentially became the foundation of early NEoWave, because nearly all of the first-generation NEoWave concepts were packed inside it.
So… which one is better?
The answer, without hesitation: Mastering Elliott Wave wins by a landslide.
Yes, it’s difficult.
But that difficulty comes with benefits:
– Higher accuracy
– Clearer structure
– Much stronger logic
These are things classical Elliott Wave simply cannot do.
The blue book (Elliott Wave Principle) lacks something crucial that the red book (MEW) provides:
a practical and functional Degree system.
(The truth is, even MEW’s Degree system isn’t perfect .. which is why I eventually built my own system on top of it.)
Neely also introduced time and price principles to calculate Degrees .. determining which waves are major, which are minor, etc.
This method does not exist in the classical version at all, which only provides extremely abstract degree labels.
So, do you need to learn Elliott Wave first before studying NEoWave?
Let me give you a simple analogy.
Elliott Wave = manual transmission car
NEoWave = automatic transmission car
The question is:
“If you buy an automatic car, do you need to learn manual first?”
The answer: Absolutely not.
Even though NEoWave originated from Elliott Wave, the internal logic has diverged significantly.
(And in today’s world, NEoWave has already moved far past the classical version.)
In fact, I personally believe you shouldn’t study both at the same time .. especially if you’re a beginner .. because the rules of the two systemas will conflict with ech other and waste your time.
For example, some patterns that classical Elliott Wave strictly prohibits, NEoWave has tested and proven to be possible.
In summary:
NEoWave takes the material from classical Elliott Wave and develops it into a far more precise, detailed system.
But even NEoWave still has flaws that make real-world trading difficult .. which is exactly why I’m working on improving and modernizing it.
At the end of the day, no theory lasts forever, because markets are driven by humans.
The psychology of today’s generation isn’t the psychology of people 100 years ago.
And modern markets influenced by AI-driven trading are not the same as Elliott’s era or Neely’s era.
This is why we need new-generation theories built for new-generation data.
- written by me(brainiak/ew-lab) thanks for reading!

Beginner Friendly! Use Elliott Wave Theory for Directional Bias!Here is a brief visual roadmap showing how a beginner to the wave theory can still access the main benefit of EW Theory... Directional Bias! That thing that keeps you in profit and with the trend, even if you misdiagnose a pattern or have an errant wave count.
I've highlighted some of the key benefits to having the correct directional bias and some of the most important properties of using The Elliott Wave Theory as a beginner! I hope this is helpful to someone, if you are struggling with your current trading system or methodology or just someone who needs a different approach, dig into the Elliott Wave Principal as this "Theory" has no doubt changed my life for the better! For Educational Purposes Only.

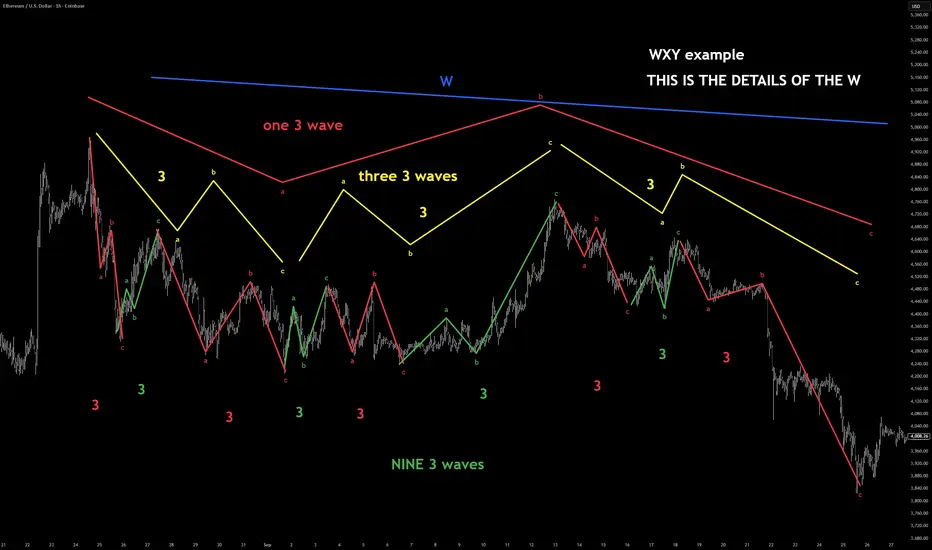
ETH was this correction a WXY- elliot wave tutorial nine 3 waveIts possible this is wave 4 and crypto is going to make a new ATH. theres no way for me to actually know this until after the fact. but it does look like this to me.
wave W is the main chart. to see the other legs see the notes
*** Elliott Wave: Quick Guide to W-X-Y (Double Three) Corrections
A W-X-Y is a complex corrective pattern in Elliott Wave Theory.
If your chart keeps printing choppy overlapping waves that refuse to trend/count cleanly, you’re probably looking at one of these.
- What W-X-Y Actually Is
A W-X-Y is simply:
W = 3 waves
X = 3 waves
Y = 3 waves
So the entire structure is:
*** 3 – 3 – 3 (total of nine internal waves which is 27 on a lower degree)
W and Y are corrective patterns (they can be zigzags or flats), and the X wave is a connecting correction—usually shallow, sideways, and time-wasting.
- What Each Leg Can Be
W:ABC or any corrective 3-wave structure
X: ABC pullback, often sideways
Y: ABC or another corrective structure
None of the legs are impulsive.
If you see a clean 1-2-3-4-5 impulse, it cannot be W, X, or Y.
- How to Recognize a W-X-Y
Corrections subdivide into threes, not fives
Price action is sloppy, overlapping, and often sideways
X wave is typically small relative to W or Y
Y often mirrors W in slope, depth, or duration
The whole thing looks like “two corrections glued together with an X in the middle”
- Where W-X-Y Appears
You’ll see W-X-Y commonly in:
B waves
Wave 4 corrections
The middle section of complex pullbacks
Crypto consolidations (extremely common)
My Ideal Elliott Wave Entry ModelThe IMSETT 3/C Entry Model.
Every trader wants to catch the big moves the ones that pay quickly and decisively. In Elliott Wave, those moves often come during Wave 3. It's the strongest part of the trend, and when you're positioned early, the risk-to-reward is unmatched.
But not every opportunity hands you a clean Wave 3 on a silver platter. Sometimes you’re looking at a Wave C instead. That’s where the 3/C Entry Model comes in. It’s designed to get you aligned with high-conviction moves—whether the market is in a trend or a zig zag.
Here’s the edge: both Wave 3 and Wave C often start the same way—a strong, motive push off an AOI (area of interest), followed by a retracement. That shared structure gives us an anchor. Whether we’re labeling it a 3 or a C doesn’t change the fact that the initial impulse gives us clarity, direction, and a place to manage risk.
That’s what the IMSETT Model is built around:
Identify
Motive
Scout
Entry Plan
Track
Trade
Each step is focused, actionable, and repeatable. You're not trying to outguess the market—you’re reacting to structure, preparing for common behavior, and executing with intent.
I do have a video with a walk through.
This just the way I look for clarity in setups. As with everything in trading, nothing will work every time so do your own research this is not financial advice.
Cheers!
Trade Safe, Trade Clarity.

Where traders tend to failAfter 25 years playing this game, it is incredible to see the same issues today for new traders as there have always been.
In a nutshell, OVERCOMPLICATION!!!
New traders will often go looking for as much information as possible, adding instruments, screens, indicators, timeframes, news feeds. Anything looking for an edge.
Go back over 100 years and Charles Dow - yes, the same Dow behind the #DJI (The industrial average) laid down a very simple framework for understanding the markets.
I have written several posts here on @TradingView about Dow Theory here's one of them.
Inside this post, you will see this image.
For some of you familiar with either Elliott Wave principles or Wyckoff Techniques, you might recognise some elements of an image like this.
Both Richard Wyckoff and Ralph Elliott were onto something. But over the years these techniques have been "added to" creating hybrids and then assumptions are often made. Complex is key... Or so they think.
When you try and trade an Elliott wave cycle on a 5-minute chart on some instrument that has not been fully adopted by institutional players, you are asking for trouble.
Psychology is more important in trading than, quite possibly 99.9% of other aspects of trading. So whilst people tend to add to the technical analysis part of trading, they often ignore the psychology controlling the market.
I am not talking about psychology in terms of simple risk management and high probability moves. I am talking about the piece of the psychology studies that controls the masses.
Sentiment is one thing, the psychology that drives sentiment is where the failing and struggling traders simply ignore.
I wrote a post - trying to add some humour. Here's a Simpson's post.
=========================================
Let me give you an example;
People tend to use simple off the shelf indicators; now when millions use the same tools. Why is it that 90% + of traders still lose money?
Here is a snapshot of the MACD and RSI side by side.
Now look closely at the price action. What additional info are you getting from these lagging indicators (rhetorical question).
.
Let's look at this in a simple way; no indicators, clean chart, Dow Theory in focus.
When price moves up you will often see accumulation, then as price reaches it's next area of interest and starts to pullback (oversimplified) you will see, even on smaller timeframes as this is not always obvious on the same timeframe. a distribution pattern.
Overall, the price action has created a simple Elliott Wave move from a zero point, up to one and pushing down for a two.
Where this gets interesting, and simple...
Is the psychology behind it, The momentum up is often created by early buyers (yes, state the obvious) these buyers have been accumulating. Then, as retail jumps in because RSI says so. The price pulls back. This is often deep into the zone it just left, retail often using small timeframes and tight stops - 5 pips, 10 pips. So you often see a PB of 11 pips (example) and you get that feeling of "why does it always hit my stop and then go in my desired direction"?
The momentum from taking these stops, then goes on to create an impulsive 2-3 move in EW terms. This is stops becoming opposing orders. Thus creating momentum to break the high of the 1 move. New stops from shorts get triggered and momentum traders enter positions. All of which fuels a larger rally.
Now, when you break this down. You can draw ranges and operate inside these ranges to know the general bias. And just like that, you are on the right side of the market more often than not.
Here's a more detailed post on this aspect.
To give an example here:
The larger swing creates a range. An obvious high and low as marked in this image.
Then as the move inside happens; Think Dow Theory;
The market is giving a very clear clue. We just took out a fresh high and the market is seeking liquidity.
That internal move will have a fractal move inside; let's call that a trigger move.
Keep in mind, the larger trend does not change it's directional bias until it breaks the old low or the fresh high.
Now, although the price does not have to. The price can pull all the way back to the low and not change the larger trend.
Once you get to grips with this, you will stop trying to predict the market and instead work with price action.
Less, really, is more!
Have a great weekend!!!
Disclaimer
This idea does not constitute as financial advice. It is for educational purposes only, our principal trader has over 25 years' experience in stocks, ETF's, and Forex. Hence each trade setup might have different hold times, entry or exit conditions, and will vary from the post/idea shared here. You can use the information from this post to make your own trading plan for the instrument discussed. Trading carries a risk; a high percentage of retail traders lose money. Please keep this in mind when entering any trade. Stay safe.

Understanding ELLIOT WAVES ---a technical B waveJust wanted to share this part of the chart because it was pretty hard to see live — it formed on a very low timeframe. I’m posting it on the 15-minute since TradingView won’t let me publish anything lower, but I’ll drop it down and link the lower timeframes below so you can see more of the detail.
This is today’s Ethereum move. I was waiting for the bullish breakout and got in right at the low because I spotted the B wave setup forming. The B wave is the cipher — it tells you where you are within the Elliott structure if you know how to read it.
In this case, the B wave formed a big expanding triangle. You could also map it as an internal ABC inside the B itself. It was a very technical structure, so I wanted to post it to show how a complex B wave can look in real time. Recognizing these patterns helps a lot when you’re tracking the transition from correction to impulse.
FOLLOW AND COMMENT FOR MORE ELLIOT WAVE EXAMPLES AND LESSONS

Educational BTC Analysis: Decoding BTC's Wave (C) DownHello Friends, Welcome to RK_Chaarts.
Today we are going to understand Elliott Wave Teaching Points from the BTCUSD Daily Chart,
This chart sequence perfectly illustrates the difference between motive (impulse) and corrective waves, as well as the important structures and rules of a larger correction.
1. The Structure of a Corrective Pattern (A-B-C)The Big Picture: The overall movement, labeled Intermediate Wave (A), (B), and (C) (Blue), is a three-wave corrective pattern. This type of pattern moves against the trend of one larger degree (which have been an uptrend). The three-wave (A-B-C) structure is the classic way markets move in a counter-trend. Wave (A): The initial counter-trend move.Wave (B): A bounce or retracement that moves back in the direction of the previous trend, but fails to reach the start of Wave (A).Wave (C): The final, and often most powerful, leg of the correction, which is designed to complete the retracement. This wave is always structured as a five-wave impulse.
2. The Rule of Subdivisions: Corrective Waves are Internally Motive, Wave (C) is an Impulse: The report states that Intermediate Wave (C) is expected to unfold as a five-wave impulse sequence of a Minor Degree (Red) (Minor Wave 1, 2, 3, 4, 5).
Learning Point: This highlights a fundamental Elliott Wave rule: the C-wave of an A-B-C correction is a motive wave (it has a five-wave internal structure) because its purpose is to create strong directional progress and complete the larger correction. This is commonly known as a Zigzag correction (which has a 5-3-5 internal count for A-B-C).
3. Identifying the Strongest Move (Wave 3)
The Current Phase: The market is currently in Minor Wave 3 (Red) downwards.
Learning Point: In Elliott Wave theory, Wave 3 is typically the longest and never the shortest of the three motive waves (Waves 1, 3, and 5). This means the analysis anticipates the current move to be the most directional, high-momentum, and volatile part of the entire Intermediate Wave (C) correction. This is the "sweet spot" for trend traders.
4. The Principle of Alternation (Predicting Wave 4)
Upcoming Wave: The analysis projects a shallow Minor Wave 4 (Red) rebound.
Learning Point: While the chart doesn't show Wave 4 yet, this prediction is often guided by the Principle of Alternation. If the preceding corrective wave (Minor Wave 2) was a sharp, deep correction, the next corrective wave of the same degree (Minor Wave 4) is expected to be a sideways, shallow, or complex correction (like a flat or triangle). The prediction of a "shallow" wave 4 suggests Minor Wave 2 was likely a deeper, sharper retracement.
5. The Critical Invalidation Rule
The Invalidation Level: The report sets the critical invalidation price at 74,223, which represents the low or starting point of wave ((1)).
Learning Point: Wave ((2)) can never retrace more than 100% of Wave ((1)). By identifying a specific price level, we can assume that our study says price should not broke below that particular level, it provides traders with clear risk management parameters.
I. Current Wave Count Status
The analysis indicates that the previous upward corrective structure, designated as Intermediate Degree Wave (A) and Wave (B) (Blue), is complete. The market is now engaged in a significant downward movement within the larger Intermediate Degree Wave (C) (Blue).
This Intermediate Wave (C) is expected to unfold as a five-wave impulse sequence of a Minor Degree (Red) to the downside, fulfilling the final leg of the overall corrective cycle.
II. Detailed Downward Projection
The Minor Degree five-wave structure within Intermediate Wave (C) is currently positioned as follows:
Minor Wave 1 and Minor Wave 2 (Red): These waves are identified as complete.
Current Phase: The market is now unfolding Minor Wave 3 (Red) downwards, indicating the strongest portion of the bearish move is in progress.
Anticipated Completion: Following the completion of Minor Wave 3, the analysis projects a shallow Minor Wave 4 (Red) rebound, followed by the final impulse move, Minor Wave 5 (Red), to complete the entire Intermediate Wave (C) correction.
The ultimate completion of Intermediate Wave (C) will signal the end of the larger-degree correction (labeled as a corrective wave (2)).
III. Critical Invalidation Level
The integrity of this bearish wave count is contingent upon the price action respecting a critical support level.
Invalidation Price: 74,223
Significance: This price point represents the extreme low or starting point of wave ((1)), so Wave ((2)) correction Should not breach this level as per wave principles, if it makes lower low below 74,223 on the lower side, the current Elliott Wave analysis would be invalidated, requiring a revision of the entire wave structure and market outlook.
I am not Sebi registered analyst.
My studies are for educational purpose only.
Please Consult your financial advisor before trading or investing.
I am not responsible for any kinds of your profits and your losses.
Most investors treat trading as a hobby because they have a full-time job doing something else.
However, If you treat trading like a business, it will pay you like a business.
If you treat like a hobby, hobbies don't pay, they cost you...!
Hope this post is helpful to community
Thanks
RK💕
Disclaimer and Risk Warning.
The analysis and discussion provided on in.tradingview.com is intended for educational purposes only and should not be relied upon for trading decisions. RK_Chaarts is not an investment adviser and the information provided here should not be taken as professional investment advice. Before buying or selling any investments, securities, or precious metals, it is recommended that you conduct your own due diligence. RK_Chaarts does not share in your profits and will not take responsibility for any losses you may incur. So Please Consult your financial advisor before trading or investing.

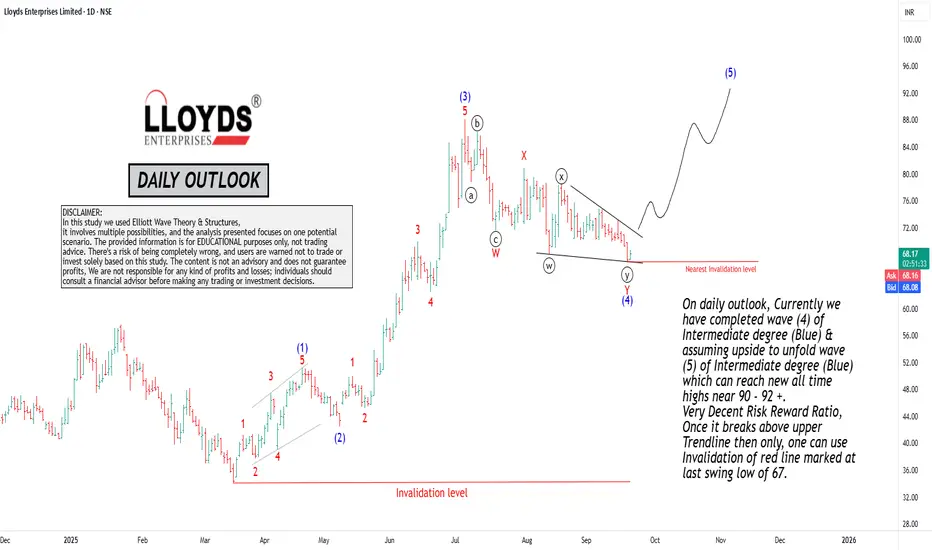
Understanding Elliott Wave Analysis: A Daily Outlook ExampleHello Friends, Welcome to RK_Chaarts!
Today we're going to explore Elliott Wave Analysis using a daily outlook example of Lloyds Enterprises Ltd Chart. Please note that this is for educational purposes only.
Important Disclaimer:
- This analysis is not trading advice.
- I am not a SEBI-registered analyst.
- Please consult your financial advisor before trading or investing.
Understanding Elliott Wave Analysis
In this educational guide, we'll walk through a daily outlook analysis using Elliott Wave theory. Our goal is to identify potential price movements and understand the underlying wave structure.
Current Market Analysis
We are currently analyzing a daily chart, and our analysis suggests:
- We have completed wave (4) of Intermediate degree (blue).
- We assume an upside movement will unfold, forming wave (5) of Intermediate degree (blue).
- This wave (5) has the potential to reach new all-time highs near 90-92+.
Risk-Reward Ratio
Our analysis indicates a very decent risk-reward ratio. This means that the potential upside movement is substantial compared to the potential downside risk.
Trade Setup
To validate our trade setup, we are watching for a break above the upper trendline. Once this break occurs, we can consider using the invalidation level marked at the last swing low of 67.
Key Takeaways:
1. Elliott Wave Structure: Understand the current wave structure, including the completed wave (4) and the anticipated wave (5).
2. Potential Price Movement: Recognize the potential for wave (5) to reach new all-time highs.
3. Risk-Reward Ratio: Acknowledge the decent risk-reward ratio, which supports the trade setup.
4. Trade Validation: Wait for a break above the upper trendline to validate the trade setup.
By applying Elliott Wave analysis and understanding the underlying wave structure, traders can make more informed decisions and identify potential trading opportunities.
Remember:
Most investors treat trading as a hobby because they have a full-time job doing something else. However, if you treat trading like a business, it will pay you like a business. If you treat it like a hobby, hobbies don't pay, they cost you!
Hope this post is helpful to the community!
Thanks,
RK
Disclaimer and Risk Warning:
The analysis and discussion provided on in.tradingview.com are intended for educational purposes only and should not be relied upon for trading decisions. RK_Chaarts is not an investment adviser, and the information provided here should not be taken as professional investment advice. Before buying or selling any investments, securities, or precious metals, it is recommended that you conduct your own due diligence. RK_Chaarts does not share in your profits and will not take responsibility for any losses you may incur. So please consult your financial advisor before trading or investing.
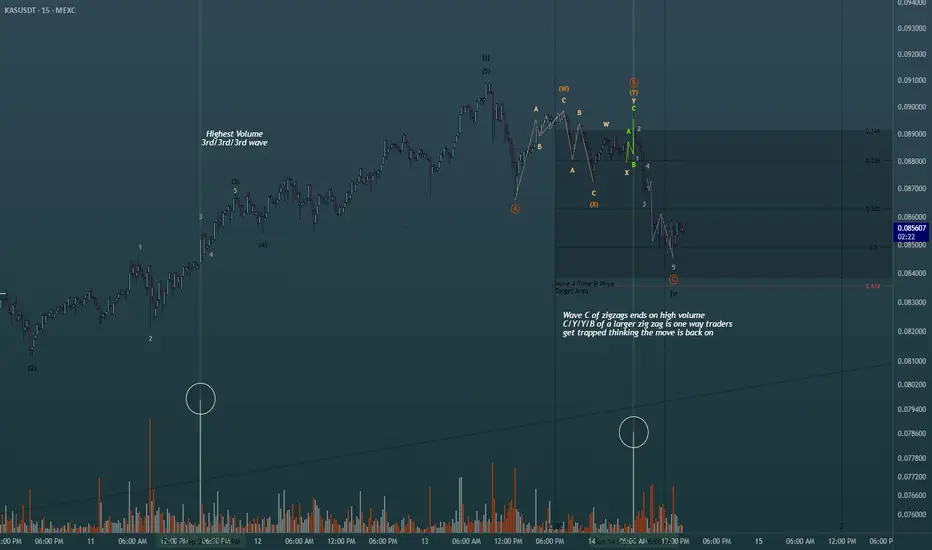
Using simple volume for added confluence in Elliott Wave Theory!Shown on the chart is 2 of the ways you can use the highest volume spikes on the chart to find out where you are in the wave count. Easiest way is to find the highest volume with the steepest slope of trend to label as your third wave. Same concept whether its bearish bars printing or bullish bars. The highest volume shown is actually part of the retracement, albeit in one of the actionary waves (moving with trend), alot of buying happened at the termination of the wave C of the zig zag shown in green. Perfect scenario to rake in buy orders from retail then dump on them to finish out the WXY pattern. This is just 2 of the many scenarios in which you can find help from the volume oscillator to give you a directional bias in Elliott Waves. Happy Trading
Understanding Elliott Wave Theory with BTC/USD If you’ve ever stared at a Bitcoin chart and thought, “ This looks like chaos ”, Ralph Nelson Elliott might disagree with you. Back in the 1930s, Elliott proposed that markets aren’t just random squiggles — they actually move in recognizable rhythms. This became known as Elliott Wave Theory .
So, what is Elliott Wave Theory? In the simplest terms, it’s the idea that market psychology unfolds in waves: five steps forward, three steps back, repeat. Not every chart follows it perfectly, but when you see it play out, it feels like spotting order in the middle of crypto madness.
⚠️ Before we dive in: remember, no single tool or pattern works alone. Elliott wave trading is most useful when combined with other methods.
The Elliott Wave Principle
At the heart of the Elliott Wave principle are two phases:
Impulse Waves (5 waves) : Markets advance in five moves — three with the trend, two counter-trend. This is when optimism snowballs.
Corrective Waves (3 waves) : The market cools off in three moves. Usually messy, choppy, and fueled by doubt.
Put them together, and you get a “5-3“ structure that repeats at different scales. That’s what gives Elliott Wave its fractal character. Again, don’t treat this as a crystal ball. Elliott Wave Theory rules are guidelines, not guarantees. Real-world Bitcoin charts bend, stretch, and sometimes ignore them altogether.
Elliott Wave Theory Explained with BTC
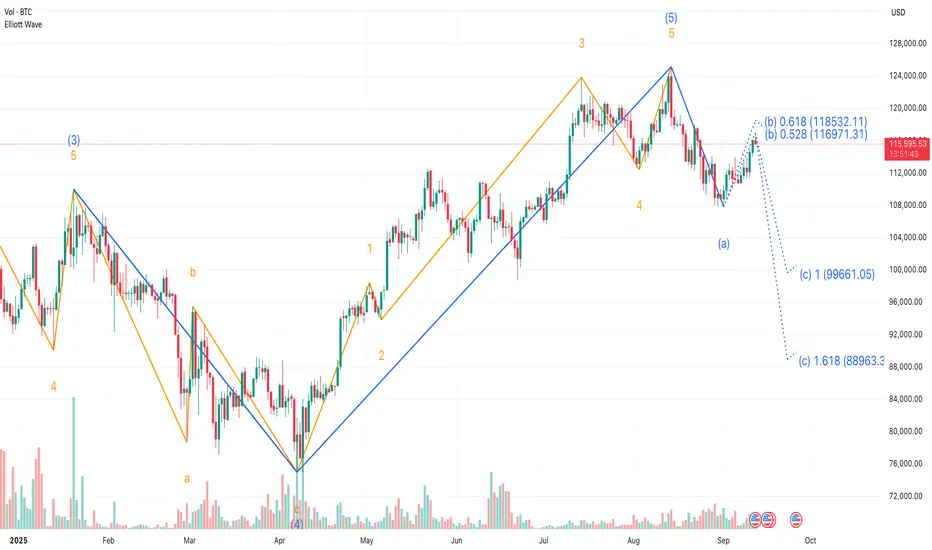
Let’s use an example: Bitcoin’s rally from early 2025 till now .
This downturn marked the first step in a broader consolidation, signaling that momentum was beginning to fade.
The corrective sequence unfolded in a classic A-B-C structure.
❗This three-part move effectively reset the market, washing out excess leverage and preparing the ground for the next impulsive cycle.
From that low, Bitcoin launched into a textbook five-wave impulsive rally.
This initial leg down, labeled wave (a), suggested that a larger corrective phase was now underway, replacing the bullish momentum with profit-taking and distribution.
That’s a textbook case of Bitcoin Elliott wave analysis . But notice: it wasn’t clean. Some traders counted the waves differently. Some saw extensions or truncations. That’s the thing with Elliott — interpretation matters as much as the rules.
Elliott Wave Theory Rules and Flexibility
The classic Elliott wave rules say things like: Wave 2 can’t retrace more than 100% of Wave 1. Wave 3 is never the shortest impulse wave. Wave 4 can’t overlap with Wave 1 in most cases.
But in practice, Bitcoin often blurs these lines. Extreme volatility, liquidation cascades, and macro shocks can distort wave counts. That’s why even seasoned analysts will say, “This is my Elliott count,” not the Elliott count.
The takeaway? Think of Elliott as a lens, not a lawbook.
Tools That Pair with Elliott
Many traders use the MT5 Elliott Wave Indicator or TradingView drawing tools to sketch their wave counts. Despite the waves becoming far more meaningful when tied to other signals:
Fibonacci Retracements: For example, watching how corrections line up with golden pocket levels. Momentum Oscillators: That confirm or contradict the wave structure. Macro Sentiment: Shifts that often align with corrective or impulsive phases.
Elliott Wave Theory trading doesn’t exist in a vacuum. Used alone, it’s like trying to predict the weather with just cloud shapes.
Why Beginners Should Care
If you’re new, you might be asking: “ Okay, but why bother with this at all? ” The answer: Elliott Wave Theory explained the psychology behind price swings long before the existence of cryptocurrency. It captures the human emotions behind markets — fear, greed, doubt, euphoria. And Bitcoin, perhaps more than any other asset, runs on psychology.
So whether you’re sketching waves, testing them on the Bitcoin Elliott wave chart , or just trying to understand why BTC always seems to surge then collapse, this framework helps put the chaos into context.
Final Thoughts 🌊
What is Elliott Wave Theory in trading? It’s not a magic formula. It’s a structured way of looking at markets through recurring patterns of optimism and pessimism.
And just like with every other tool we’ve discussed, it’s not about using it alone. The best insights come when you combine the Elliott Wave principle with other indicators: Fibonacci, moving averages, and even plain old support and resistance.
So the next time someone posts a “ wave count ” on a Bitcoin Elliott Wave analysis, don’t take it as gospel. Treat it as one possible map of where we are in the cycle. Because in trading, it’s never about certainty. It’s about perspective.
This analysis is performed on historical data, does not relate to current market conditions, is for educational purposes only, and is not a trading recommendation.
Elliot Wave📚 Elliott Wave Trading Strategy — Education Framework
1. Origins & Philosophy
Ralph Nelson Elliott (1920s–1930s): Found that markets, while seeming chaotic, often move in repeating wave structures.
Core Belief: Market psychology cycles between optimism and pessimism in a fractal pattern.
Purpose: Provides a roadmap of where the market could be within a cycle (not a certainty).
2. The Two Types of Waves
Impulse (Motive) Waves (1–5):
Move in the direction of the main trend.
Rules:
Wave 2 never retraces >100% of Wave 1.
Wave 3 is never the shortest.
Wave 4 doesn’t overlap Wave 1.
Net result = trend continuation.
Corrective Waves (A–B–C):
Move against the main trend.
Three-wave structure: down (A), up (B), down (C) in a bull market.
Typically retraces a Fibonacci % of the prior impulse.
3. Key Components
Fractals: Small waves make up bigger ones, across timeframes.
Degrees of Waves: From Grand Supercycle (multi-century) to Subminuette (intraday).
Fibonacci Ratios: Common retracement levels (38.2%, 50%, 61.8%) and extensions (161.8%) guide targets.
4. Practical Trading Strategy
Elliott Wave by itself is subjective. The edge comes when combined with confirming indicators.
Example Workflow for Swing Trading
Identify Trend Direction:
Use 50-day/200-day MA, Ichimoku, or ADX.
Wave Counting:
Label impulse waves 1–5.
Wait for a corrective wave A–B–C.
Entry:
Many Enter end of Wave 2 or Wave 4 (buy dips in uptrend). Try entering a wave earlier, so that you lock in better Risk to Reward.
Use momentum oscillators (RSI/Stochastics) to confirm end of correction.
Exit/Profit Target:
Project Wave 3 or 5 using Fibonacci extensions (often 161.8% of Wave 1).
Stop Loss:
Below Wave 1 start (if long).
Above Wave 1 start (if short in a bear sequence).
5. Who Uses Elliott Wave?
Day Traders / Swing Traders: To catch impulse waves.
Long-term Investors: To avoid topping markets (useful in bubbles).
Cross-Market Traders: Applies in stocks, forex, commodities, crypto.
6. Advantages
✅ Provides forward-looking framework (not just lagging).
✅ Works across asset classes and timeframes.
✅ Helps identify where we are in a market cycle.
✅ Blends well with Fibonacci, RSI, and trend filters.
7. Disadvantages
❌ Highly subjective (two traders may count waves differently).
❌ No guarantee — probabilities, not certainties.
❌ Developed in the 1930s, critics argue it hasn’t adapted well to algorithmic/modern markets.
8. Famous Elliott Wave Calls
Dow 2002–03 Crash: Prechter predicted drop from 11,000 → 7,000.
Gold 2011 Peak: Predicted ~$1,900 top.
Bitcoin 2017: Analysts called $20K top → $3K.
9. Common Mistakes
Forcing wave counts (bias confirmation).
Ignoring other indicators.
Trading every wave → instead, focus on the big impulses.
No patience (wave structures can take weeks or months).
✅ Summary Strategy (Simple Version)
Use MAs or trendlines → determine main trend.
Count impulse waves → focus on Wave 3 and Wave 5 (strongest).
Wait for corrective pullback (Wave 2 or 4).
Enter with oscillator confirmation + Fibonacci retracement.
Exit at Fibonacci extension or trend exhaustion.

Let's learn & Apply Elliott Wave Rules on chart: BTCUSD BitcoinHello Friends,
Welcome to RK_Chaarts,
Friends, Today we are going to learn 3 Rules of the Elliott Wave theory, there are three principles and some patterns. Impulses move in a 1-2-3-4-5 pattern, either as an impulse or a motive wave. However, within impulses, there are three rules:
Rule No 1:
Wave 2 will never retrace more than 100% of Wave 1.
Rule No 2:
Wave 3 will never be the shortest among Waves 1, 3, and 5; it can be the largest, but never the smallest.
Rule No 3:
Wave 4 cannot overlap Wave 1, except in diagonals or triangles; in impulses, it cannot overlap.
We've checked these three rules and marked them with separate tick marks on the chart with different colors, making them clearly visible. You can review the chart and verify these rules yourself, learning how wave principles are applied and checked.
We've explained all this through a drawing on the chart, so we won't elaborate further here. Moving forward, let's analyze what the wave theory suggests about the current market trend. This entire analysis is shared for Educational purposes only.
I hope you'll consider this educational post as a learning resource, Definitely, I encourage you to review the chart as an image or picture to better understand the concepts we've worked hard to explain.
Our effort will be successful if you gain a deeper understanding and learn something new from this post. If you find this helpful and informative, our hard work will have paid off. Please keep this in mind as you review the material.
Now let's explore how wave counts within wave counts, or lower degrees within higher degrees, unfold through complete wave theory patterns and following theory Rules all the times.
Let's take a closer look at the Bitcoin chart we've analyzed using Elliott Waves. From this perspective, it's clear that the Intermediate Degree Wave (2) concluded around June 23rd.
After this, we observe that the internal wave counts of the lower degree, specifically Wave 1-2-3 (in red) have completed their cycle of Minor degree. Furthermore, Red Wave 4 of same Minor degree has been moving sideways, characterized by a downward trend.
Notably, the fall of Red Wave 4 is classified as a Minor Degree movement. Interestingly, this downward movement appears to have terminated in an even lower degree, namely the Minute Degree, which we've marked in black as ((w))-((x))-((y))-((xx))-((z)) that means Wave 4 of Minor degree (in Red) is complete.
Given that Red Wave 4 Minor has reached its conclusion, it's highly plausible that Wave 5 has initiated. This development suggests that Bitcoin is poised to make a significant move.
Moving on to the analysis, we observe that:
- Rule 1: Wave 2 has not retraced more than 100% of Wave 1, so this rule is intact.
- Rule 2: Wave 3 is not the shortest among Waves 1, 3, and 5, so this rule is also valid.
- Rule 3: Wave 4 does not overlap Wave 1, so this rule is also satisfied.
Bitcoin is all set to shake things up! We eagerly anticipate further rallies in the market.
This post is shared purely for educational purpose & it’s Not a trading advice.
I am not Sebi registered analyst.
My studies are for educational purpose only.
Please Consult your financial advisor before trading or investing.
I am not responsible for any kinds of your profits and your losses.
Most investors treat trading as a hobby because they have a full-time job doing something else.
However, If you treat trading like a business, it will pay you like a business.
If you treat like a hobby, hobbies don't pay, they cost you...!
Hope this post is helpful to community
Thanks
RK💕
Disclaimer and Risk Warning.
The analysis and discussion provided on in.tradingview.com is intended for educational purposes only and should not be relied upon for trading decisions. RK_Chaarts is not an investment adviser and the information provided here should not be taken as professional investment advice. Before buying or selling any investments, securities, or precious metals, it is recommended that you conduct your own due diligence. RK_Chaarts does not share in your profits and will not take responsibility for any losses you may incur. So Please Consult your financial advisor before trading or investing.
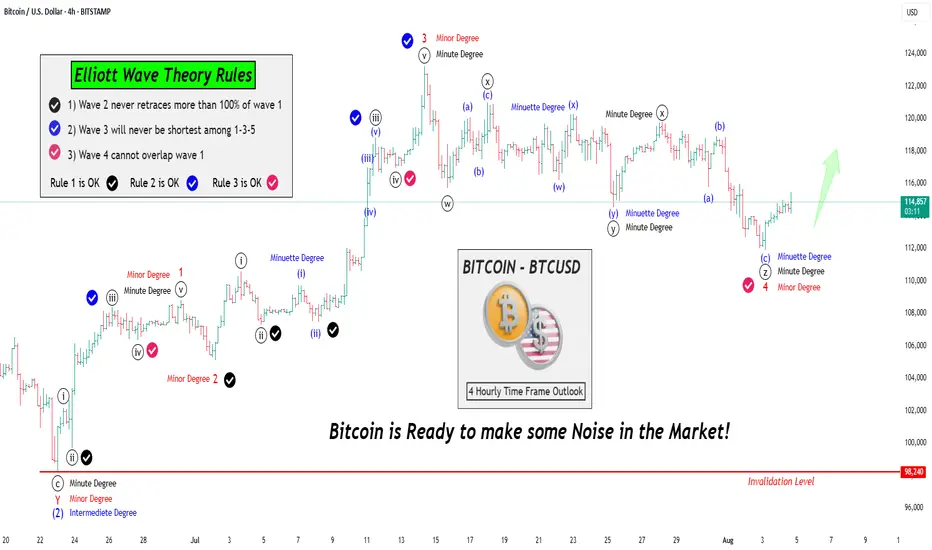
A scalping study using volume and Elliott Wave theory.A study I conducted to show how to make money in scalping by applying simple Elliott Wave analysis and volume control.
Attention: There’s no audio, and when examined carefully, none is needed.

Impact on the Dollar and Forex — Artavion AnalyticsThe development of central bank digital currencies (CBDCs) — especially the digital yuan (e-CNY) — is becoming a key factor in transforming global currency flows. While the US dollar still dominates, the architecture of global liquidity is beginning to shift.
At Artavion, we see the e-CNY not just as a technological experiment but as a tool of China’s currency policy. Its goal is to strengthen the yuan’s role in international settlements and reduce dependence on the dollar, particularly in developing regions.
Why the Digital Yuan Matters
The e-CNY is already being used in China for retail payments and is being tested in cross-border transactions (e.g., in the mBridge project with the UAE and Thailand). This enables the creation of alternative payment systems not tied to SWIFT.
If the digital yuan gains broader acceptance, especially for commodity and energy settlements, its role in forex will grow, potentially weakening the dollar’s monopoly in certain regions.
CBDCs and Forex Structure
CBDCs won’t displace the dollar in the near term, but they are already influencing the structure of currency trading:
New currency pairs are emerging, especially in Asia;
Transactions are becoming faster and cheaper, particularly in the B2B segment;
Market participants are adjusting strategies to real-time settlements and the potential programmability of currencies.
Risks and Limitations
Privacy: CBDCs are under full state control;
Fragmentation: There is no unified technical standard across different countries’ CBDCs;
Geopolitics: The rise of the e-CNY could intensify currency competition with the dollar.
Artavion’s Conclusion
The digital yuan will not replace the dollar, but it is creating an alternative — especially in regions seeking autonomy from Western financial infrastructure. For traders and investors, this means reassessing currency risks and exploring new opportunities in decentralized settlement channels.

Elliott Wave Principles: A Study on US Dollar IndexHello friends, today we'll attempt to analyze the (DXY) US Dollar Index chart using Elliott Wave theory. Let's explore the possible Elliott Wave counts with wave Principles (Rules).
We've used the daily time frame chart here, which suggests that the primary cycle degree in Black weekly wave ((A)) and ((B)) waves have already occurred. Currently, wave ((C)) is in progress.
Within wave ((C)) in Black which are Weekly counts, Subdivisions are on daily time frame, showing Intermediate degree in blue wave (1) & (2) are finished and (3) is near to completion. Post wave (3), we can expect wave (4) up in Blue and then wave (5) down in Blue, marking the end of wave ((C)) in Black.
Additionally, within blue wave (3) Intermediate degree, we should see 5 subdivisions in red of Minor degree, which is clearly showing that waves 1 & 2 are done and now we are near to completion of wave 3 in Red. followed by waves 4 and 5, which will complete blue wave (3).
Key Points to Learn:
When applying Elliott Wave theory, it's essential to follow specific rules and principles. Here are three crucial ones:
1. Wave 2 Retracement Rule: Wave two will never retrace more than 100% of wave one.
2. Wave 3 Length Rule: Wave three will never be the shortest among waves 1, 3, and 5. It may be the largest most of the time, but never the shortest.
3. Wave 4 Overlap Rule: Wave four will never enter into the territory of wave one, meaning wave four will not overlap wave one, except in cases of diagonals or triangles.
Invalidation level is a level which is decided based on these Elliott wave Principles only, Once its triggered, then counts are Invalidated so we have to reassess the chart study and other possible counts are to be plotted
The entire wave count is clearly visible on the chart, and this is just one possible scenario. Please note that Elliott Wave theory involves multiple possibilities and uncertainties.
The analysis we've presented focuses on one particular scenario that seems potentially possible. However, it's essential to keep in mind that Elliott Wave counts can have multiple possibilities.
I am not Sebi registered analyst.
My studies are for educational purpose only.
Please Consult your financial advisor before trading or investing.
I am not responsible for any kinds of your profits and your losses.
Most investors treat trading as a hobby because they have a full-time job doing something else.
However, If you treat trading like a business, it will pay you like a business.
If you treat like a hobby, hobbies don't pay, they cost you...!
Hope this post is helpful to community
Thanks
RK💕
Disclaimer and Risk Warning.
The analysis and discussion provided on in.tradingview.com is intended for educational purposes only and should not be relied upon for trading decisions. RK_Charts is not an investment adviser and the information provided here should not be taken as professional investment advice. Before buying or selling any investments, securities, or precious metals, it is recommended that you conduct your own due diligence. RK_Charts does not share in your profits and will not take responsibility for any losses you may incur. So Please Consult your financial advisor before trading or investing.

This is where money is made — in the retrace, not the rally. Strategy Recommendation
Wait for:
Rejection or bullish reversal pattern in Buy Zone.
CHoCH or BOS in LTF (1H/4H).
Target: 1.1600–1.2000 supply zone (wave v completion).
Risk Management: Below the But Zone or trendline break.

Dogecoin Daily Chart Analysis: A Fresh Start Ahead ?Hello friends, let's analyze Dogecoin, a cryptocurrency, from an Elliott Wave perspective. This study uses Elliott Wave theory and structures, involving multiple possibilities. The analysis focuses on one potential scenario and is for educational purposes only, not trading advice.
We're observing the daily chart, and it appears we're nearing the end of Wave II, a correction. The red cycle degree Wave I ended around 2024 December's peak. Currently, we're nearing the end of red Wave II, which consists of black ((W)), ((X)), and ((Y)) waves. Black ((W)) and ((X)) are complete, and black ((Y)) is nearing its end.
Within black ((Y)), we have Intermediate degree blue (W), (X), and (Y) waves. Blue (W) and (X) are complete, and blue (Y) is nearing its end. Inside blue (Y), red A and B are complete, and red C is nearing its end. Once red C completes, blue (Y) will end, Once blue (Y) completes, means black ((W)) will end that means higher degree cycle wave II in red will end.
If our view remains correct, the invalidation level for this Elliott Wave count is 0.04913. If this level holds and doesn't touch below it, we can expect a significant reversal to unfold wave III towards new highs. This is an educational analysis, and I hope you've learned something by observing the chart and its texture.
I am not Sebi registered analyst.
My studies are for educational purpose only.
Please Consult your financial advisor before trading or investing.
I am not responsible for any kinds of your profits and your losses.
Most investors treat trading as a hobby because they have a full-time job doing something else.
However, If you treat trading like a business, it will pay you like a business.
If you treat like a hobby, hobbies don't pay, they cost you...!
Hope this post is helpful to community
Thanks
RK💕
Disclaimer and Risk Warning.
The analysis and discussion provided on in.tradingview.com is intended for educational purposes only and should not be relied upon for trading decisions. RK_Charts is not an investment adviser and the information provided here should not be taken as professional investment advice. Before buying or selling any investments, securities, or precious metals, it is recommended that you conduct your own due diligence. RK_Charts does not share in your profits and will not take responsibility for any losses you may incur. So Please Consult your financial advisor before trading or investing.

Using Fibonacci/Measured Moves To Understand Price TargetThis video is really an answer to a question from a subscriber.
Can the SPY/QQQ move downward to touch COVID levels (pre-COVID High or COVID Low).
The answer is YES, it could move down far enough to touch the pre-COVID highs or COVID lows, but that would represent a very big BREAKDOWN of Fibonacci/ElliotWave price structure.
In other words, a breakdown of that magnitude would mean the markets have moved into a decidedly BEARISH trend and have broken the opportunity to potentially move substantially higher in 2025-2026 and beyond (at least for a while).
Price structure if very important to understand.
Measured moves happen all the time. They are part of Fibonacci Price Theory, Elliot Wave, and many of my proprietary price patterns.
Think of Measured Moves like waves on a beach. There are bigger waves, middle waves, smaller waves, and minute waves. They are all waves. But their size, magnitude, strength vary.
That is kind of what we are trying to measure using Fibonacci and Measured Move structures.
Watch this video. Tell me if you can see how these Measured Moves work and how to apply Fibonacci structure to them.
This is really the BASICS of price structure.
Get Some.
#trading #research #investing #tradingalgos #tradingsignals #cycles #fibonacci #elliotwave #modelingsystems #stocks #bitcoin #btcusd #cryptos #spy #gold #nq #investing #trading #spytrading #spymarket #tradingmarket #stockmarket #silver

Calibrating Trading Indicators for Different MarketsCalibrating Trading Indicators for Different Markets: A Beginner's Guide
(Simple Steps to Adjust RSI , MACD , and Other Tools for Better Results)
Key Idea : Just like you'd tune a guitar differently for rock vs. classical music, trading tools like RSI or MACD need adjustments depending on what you're trading (stocks, crypto, forex) and how it moves. This guide shows you how to tweak these tools using price swings (pivot points) to make them work better for your specific asset.
---
Why "One Size Fits All" Doesn't Work
Most traders use default settings for indicators (like RSI's 14-day period). But these defaults were created for "average " markets. Real markets aren't average!
Example:
- Crypto ( CME:BTC1! ) : Super volatile → Needs faster, more sensitive indicators.
- Blue-Chip Stocks ( NASDAQ:AAPL ) : Less wild swings → Needs slower, smoother indicators.
If you use the same RSI settings for both, you'll get bad signals. Calibration fixes this.
---
The Pivot Point Method for Calibration
One effective approach to calibration is measuring the natural rhythm of price swings between high and low points. Here's how to do it step by step:
Step 1: Find Pivot Points on Your Chart
Pivot points are like "price turning points." Use TradingView's ZigZag indicator (or draw them manually) to spot these swings.
How to Add ZigZag on TradingView :
1. Open your chart.
2. Click "Indicators" → Search " ZigZag " → Select it.
3. Adjust settings (defaults work fine for starters).
The ZigZag will draw lines between significant highs (peaks) and lows (valleys).
---
Step 2: Measure the "Rhythm" of the Market
Count the bars (candles) between pivot points to find the market's natural cycle.
Example :
- If Bitcoin swings from peak to peak every 14 bars on average, its "cycle" is 14 bars.
- If Apple does this every 16 bars, its cycle is 16 bars.
In the picture above, we used the Williams Fractal to identify pivots.
Formula for Indicator Settings :
- RSI Period = Half the average cycle → If cycle = 16 bars → RSI = 8 days.
- MACD Settings : Fast EMA = ¼ cycle, Slow EMA = ½ cycle → Cycle = 16 → Fast EMA = 4, Slow EMA = 8
---
Step 3: Test Your Calibrated Indicators
Backtest on TradingView :
1. Add your indicator (e.g., RSI) with the new settings.
2. Use the Strategy Tester (click "Add to Chart" → " RSI Strategy ") to see if signals improve.
Look For :
- Fewer false signals (e.g., RSI saying "oversold" too early).
- Clearer trends (MACD crossovers matching price moves).
---
Calibrating Popular Indicators (Simple Rules)
1. RSI (Relative Strength Index)
- Default : 14 days.
- Calibrated : Half the average cycle length.
- Example : Cycle = 16 bars → RSI = 8 days.
Why It Works : Shorter RSI reacts faster to volatile markets (like crypto).
2. MACD
- Default : 12, 26, 9.
- Calibrated :
- Fast EMA = ¼ of cycle.
- Slow EMA = ½ of cycle.
- Signal Line = ⅙ of cycle.
- Example : Cycle = 20 → Fast = 5, Slow = 10, Signal = 3.
Why It Works : Matches the asset's natural momentum shifts.
3. Williams %R
- Default : 14 days.
- Calibrated : Same as RSI (half the cycle).
---
How to Avoid Common Mistakes
Mistake 1 : Overfitting (Making It Too Perfect for the Past)
- Problem : If you calibrate too precisely to old data, it might fail in the future.
- Fix : Test on 2 types of data:
1. Training Data : First 70% of your chart (to calibrate).
2. Testing Data : Last 30% (to check if it still works).
Mistake 2 : Ignoring Market Changes
- Problem : What works today might not work next month.
- Fix : Recheck your settings every 3 months or after big news (e.g., Fed rate hikes).
---
Free Tools to Help (No Coding Needed)
1. TradingView's "Auto-Detect Cycle" Scripts
Search for indicators like "Cycle", "RSI Adaptive" or " Rainbow Adaptive RSI " in TradingView's public library. These automatically calculate cycle lengths (Not tested).
2. Adaptive MACD/RSI Indicators
Try pre-built adaptive indicators like:
- Adaptive MACD : Adjusts itself based on volatility.
- Dynamic Pivot : Uses pivots to set stop-loss and take-profit levels.
---
Building a Simple Pivot Calibration System
Basic ZigZag Calibrator Method :
1. Add ZigZag to your chart.
2. Manually count the bars between 5 recent swings.
3. Calculate the average → Divide by 2 → Use that number for your RSI/MACD.
Example :
- Swings: 12, 14, 16, 10, 8 bars → Average = 12.
- Calibrated RSI = 6 days.
---
Why This Works (Without the Math)
Markets move in waves. By matching your indicator's speed to the wave length, you "surf" the trend instead of fighting it. Research shows adaptive methods like this beat default settings.
The Science Behind It
When you calibrate to an instrument's natural rhythm:
- Oscillators (RSI, %R) catch extremes at the right time
- Trend indicators (MACD) signal changes faster
- Volatility bands (Bollinger Bands) expand and contract appropriately
---
A Step Further: Multi-Timeframe Calibration
For even better results, calibrate across timeframes:
1. Calculate cycles on daily charts for swing trading
2. Calculate cycles on 4-hour charts for day trading
3. Use both calibrated indicators together for confirmation
---
Final Tips for Beginners
1. Start Small : Calibrate one indicator (like RSI) first.
2. Use Free Tools : TradingView has thousands of free scripts to automate calculations.
3. Keep Records : Document what settings work for which assets.
4. Be Patient : Finding the right calibration takes time, but the results are worth it.
Calibration isn't about being perfect—it's about making your tools work better for specific markets . Happy trading!

A Closer Look at Bitcoin's Elliot Wave PatternHello friends, today we'll attempt to analyze the Bitcoin chart using Elliot Waves. Our approach will involve using Elliot Wave theory and structures, which involve multiple possibilities. The analysis we present here focuses on one potential scenario that seems possible to us.
Please note that this information is for educational purposes only and should not be considered trading advice or investment tips. There's a risk of being completely wrong, so never trade based solely on this post. We're not responsible for any profits or losses. Individuals should consult a financial advisor before making any trading or investment decisions.
Now, let's discuss the Bitcoin chart. On the daily chart, we can see that a black primary degree wave has completed its ((4th)) wave, and the ((5th)) wave has started. Within the fifth wave, an intermediate degree wave is unfolding, which will have its own set of waves (1), (2), (3), (4), (5). The primary black degree wave five will be complete once the intermediate degree wave is finished.
We've drawn accounts on the chart, illustrating the entire structure, including the nearest invalidation level at around $76,666 and the real invalidation level below $50,000.
I hope this analysis based on Elliot Wave theory has helped you understand the chart better and learn something new. Please keep in mind that this is for educational purposes only.
I am not Sebi registered analyst.
My studies are for educational purpose only.
Please Consult your financial advisor before trading or investing.
I am not responsible for any kinds of your profits and your losses.
Most investors treat trading as a hobby because they have a full-time job doing something else.
However, If you treat trading like a business, it will pay you like a business.
If you treat like a hobby, hobbies don't pay, they cost you...!
Hope this post is helpful to community
Thanks
RK💕
Disclaimer and Risk Warning.
The analysis and discussion provided on in.tradingview.com is intended for educational purposes only and should not be relied upon for trading decisions. RK_Charts is not an investment adviser and the information provided here should not be taken as professional investment advice. Before buying or selling any investments, securities, or precious metals, it is recommended that you conduct your own due diligence. RK_Charts does not share in your profits and will not take responsibility for any losses you may incur. So Please Consult your financial advisor before trading or investing.
