FireHoseReel | Engulfing Candlestick Pattern (Crypto Version)🔥 Welcome FireHoseReel !
Let’s dive into the Engulfing Candlestick Pattern.
✔️ Bearish Engulfing – Basics
The Bearish Engulfing is a two-candlestick reversal pattern.
The first candle is bullish, and the second is a larger bearish candle that fully engulfs the first candle’s body and closes below its low.
Since crypto rarely has gaps, the key condition is that the second body completely covers the first body.
Shadows are not significant.
This pattern is most reliable after a weakening uptrend.
🎯 Bearish Engulfing – Psychology
This pattern shows a strong bearish shift.
Buyers push price upward at first, but the second candle proves sellers have taken full control, dragging price down and even breaking the previous candle’s low.
It signals momentum shifting from bulls to bears.
🧮 Bearish Engulfing – Setup & Levels
• Trigger: Break below the low of the second candle.
• Confirmation: A close below the trigger.
• Stoploss: Above the high of the second candle or whole structure.
• Buy-stop entry: Only if the main trend remains strongly bullish (rare in crypto).
✔️ Bullish Engulfing – Basics
The Bullish Engulfing is a two-candlestick reversal.
The first candle is bearish, and the second is a larger bullish candle that fully engulfs the first body and closes above its high.
In crypto, the key factor is that the second bullish body fully covers the first bearish body.
It works best after a downtrend or capitulation phase.
🎯 Bullish Engulfing – Psychology
This pattern indicates a strong bullish reversal.
Sellers control the first candle, but buyers return aggressively on the second candle, overpowering them and closing above the previous high.
It signals momentum shifting from bears to bulls.
🧮 Bullish Engulfing – Setup & Levels
• Trigger: Break above the high of the second candle.
• Confirmation: A close above the trigger.
• Stoploss: Below the low of the second candle or structure.
• Sell-stop entry: Only in strong downtrends and rarely recommended.
🛞 Risk Management & Disclaimer
Please remember to always use proper risk management and position sizing. Nothing in this analysis is financial advice. The market can change quickly, so always trade based on your own strategy, research, and risk tolerance. You are fully responsible for your own trades.
Engulfing Candle

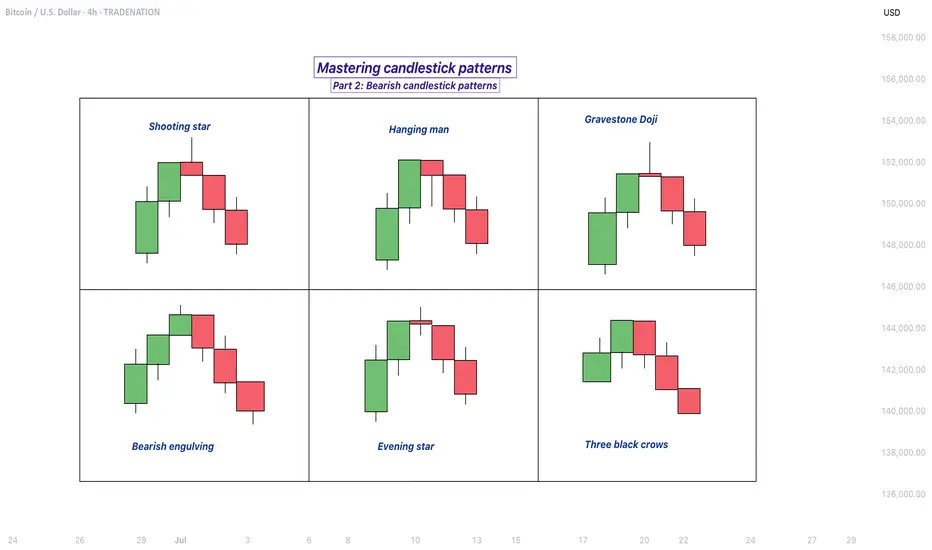
Mastering bearish candlestick patterns - How to use it!Bearish candlestick patterns are a cornerstone of technical analysis, relied upon by traders across financial markets to assess the likelihood of price reversals or continued downward trends. At their core, these patterns are visual representations of shifts in market sentiment, formed by the open, high, low, and close prices over one or several trading sessions. When recognized accurately and interpreted in context, bearish candlestick setups can alert market participants to the fading strength of buyers and the increasing presence of sellers, which often precedes downward price movements. Expanding on this, a comprehensive understanding of each pattern’s nuances, psychological underpinnings, and optimal trading applications can significantly enhance a trader’s analytical toolkit.
What will be discussed?
- What is a shooting star?
- What is a hanging man?
- What is a gravestone dojo?
- What is an evening star?
- What are the three black crows?
- How to trade the bearish candlestick patterns?
Shooting star
The shooting star pattern stands as a prominent candlestick configuration foreshadowing potential bearish reversals after an uptrend. This single-candle pattern is distinguished by a small real body situated near the lower end of the price range, a long upper shadow that is at least twice the length of the body, and little to no lower shadow. The psychological narrative implied by the shooting star is compelling: buyers initially control the session, pushing prices sharply higher, but by the close, sellers have overwhelmed this optimism, pulling the price back down to near or below the opening point. This abrupt shift in control suggests that the bullish momentum is waning, priming the market for a price correction or reversal.
Hanging man
The hanging man, while visually similar to the hammer pattern of bullish reversals, is distinctly bearish because of its position at the top of an established uptrend. This single-candle pattern features a small body at the upper part of the trading range and a markedly long lower shadow, again with minimal or absent upper shadow. During the session, substantial selling pressure drives prices down, accounting for the extended lower shadow, yet buyers temporarily regain some control, recovering much of the loss by the close. Despite this late-session recovery, the appearance of the hanging man warns traders that sellers are growing more aggressive – especially if the next candle confirms the weakness with a lower close.
Gravestone doji
A classic and somewhat ominous formation, the gravestone doji is a specialized form of doji candlestick that carries even greater weight when it appears after a rising market. Here, the open, close, and low are all clustered near the session’s low, forming a long upper shadow with no lower shadow. This structure vividly illustrates a dramatic shift in sentiment: buyers propel prices higher during the session, only to be met by intense selling which pushes prices back to the opening level by the close. This failed rally, marked by the upper wick, reflects the exhaustion of buying interest and the potential onset of bearish dominance.
Bearish engulfing
Turning to multi-candle setups, the bearish engulfing pattern is a powerful, two-bar reversal pattern. The initial candle is bullish and typically a continuation of the prevailing uptrend, but the second candle is bearish and must open above and close below the body of the first candle, “engulfing” it completely. The transition from a relatively small upward move to a much larger downward move highlights a rapid escalation in sell-side enthusiasm. Importantly, the larger the second candle and the greater the volume accompanying it, the more reliable the signal.
Evening star
The evening star expands the analysis further into a three-candlestick formation, representing a storyline of shifting market dynamics. The pattern commences with a long bullish candle, followed by an indecisive small candle (the star) that gaps above the previous close, and concludes with a large bearish candle that closes deep into the first candle’s body. The evening star is especially meaningful because it narrates a transition from bullish exhaustion to bearish control over three sessions, making it a robust signal of a pending trend reversal. The reliability of the evening star increases if the bearish candle is accompanied by high volume, confirming a surge in selling pressure.
Three black crows
Among the most striking bearish signals is the three black crows pattern. It comprises three consecutive large bearish candles, each opening within the body of the previous candle and closing successively lower. This pattern demonstrates relentless selling over several sessions, erasing prior gains and indicating that bearish sentiment is in full swing. Collectively, the three black crows can shift market psychology significantly when they appear after a lengthy uptrend, especially if accompanied by increased trading volume.
How to trade the bearish candlestick patterns?
Effectively using bearish candlestick patterns in a trading strategy requires more than mere recognition of shapes. The context in which these patterns emerge matters greatly; traders should analyze preceding price action, the scope of the trend, and any converging signals from other technical tools such as momentum oscillators or volume indicators. Confirmation is a best practice, waiting for a subsequent session that continues in the bearish direction can filter out false signals and decrease the chances of whipsaw trades.
In practice, traders may use these patterns to identify short-selling opportunities, define entry and exit points, or adjust stop-loss levels to protect profits as a trend appears to reverse. Risk management is crucial, as no pattern is infallible. Position sizing, stop-loss placement, and ongoing evaluation of the broader market environment all contribute to the prudent use of candlestick analysis. By integrating these patterns into a comprehensive market analysis framework, traders are better positioned to interpret crowd psychology, anticipate significant reversals, and navigate the complexities of price movement with a higher degree of confidence and skill.
-------------------------
Disclosure: I am part of Trade Nation's Influencer program and receive a monthly fee for using their TradingView charts in my analysis.
Thanks for your support. If you enjoyed this analysis, make sure to follow me so you don't miss the next one. And if you found it helpful, feel free to drop a like 👍 and leave a comment 💬, I’d love to hear your thoughts!
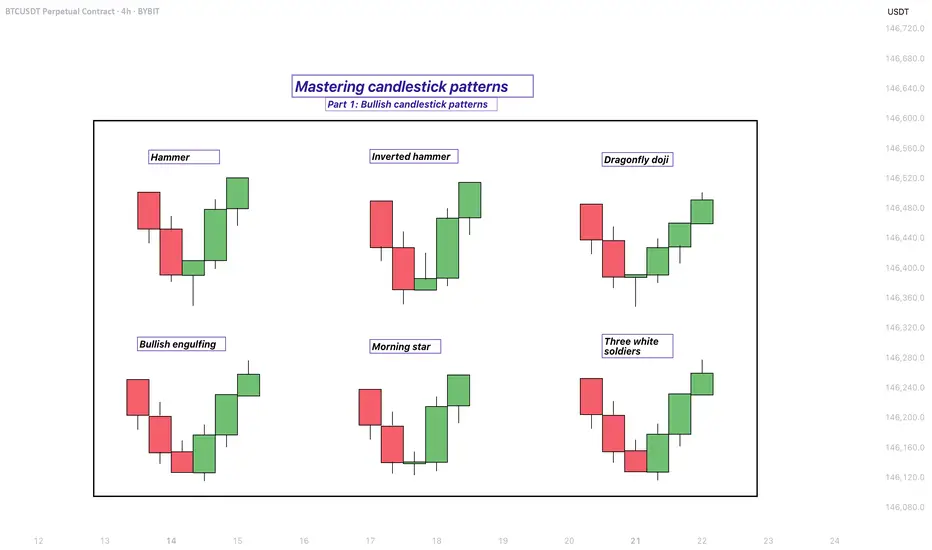
Mastering bullish candlestick patterns - How to use it!In this guide, we will explore some of the most important bullish candlestick patterns used in technical analysis. These patterns are essential tools for traders and investors who want to better understand market sentiment and identify potential reversal points where prices may start moving upward.
What will be explained:
- What are bullish candlestick patterns?
- What is the hammer?
- What is the inverted hammer?
- What is the dragonfly doji?
- What is the bullish engulfing?
- What is the morning star?
- What is the three white soldiers?
- How to use bullish candlestick patterns in trading?
What are bullish candlestick patterns?
Bullish candlestick patterns are specific formations on a candlestick chart that signal a potential reversal from a downtrend to an uptrend. These patterns are used by traders and investors to identify moments when the market sentiment may be shifting from bearish to bullish. Recognizing these patterns can help traders time their entries and make more informed decisions based on price action and market psychology. While no single pattern guarantees success, they can provide valuable clues when combined with other forms of analysis such as support and resistance, trendlines, and volume.
What is the Hammer?
The Hammer is a single-candle bullish reversal pattern that typically appears at the bottom of a downtrend. It has a small real body located at the upper end of the trading range, with a long lower shadow and little to no upper shadow. The long lower wick indicates that sellers drove the price lower during the session, but buyers stepped in strongly and pushed the price back up near the opening level by the close. This shift in momentum suggests that the downtrend could be coming to an end, and a bullish move might follow.
What is the Inverted Hammer?
The Inverted Hammer is another single-candle bullish pattern that also appears after a downtrend. It has a small body near the lower end of the candle, a long upper shadow, and little to no lower shadow. This pattern shows that buyers attempted to push the price higher, but sellers managed to bring it back down before the close. Despite the failure to hold higher levels, the buying pressure indicates a possible reversal in momentum. Traders usually look for confirmation in the next candle, such as a strong bullish candle, before acting on the signal.
What is the Dragonfly Doji?
The Dragonfly Doji is a special type of candlestick that often indicates a potential bullish reversal when it appears at the bottom of a downtrend. It forms when the open, high, and close prices are all roughly the same, and there is a long lower shadow. This pattern shows that sellers dominated early in the session, pushing prices significantly lower, but buyers regained control and drove the price back up by the end of the session. The strong recovery within a single period suggests that the selling pressure may be exhausted and a bullish reversal could be imminent.
What is the Bullish Engulfing?
The Bullish Engulfing pattern consists of two candles and is a strong indication of a reversal. The first candle is bearish, and the second is a larger bullish candle that completely engulfs the body of the first one. This pattern appears after a downtrend and reflects a shift in control from sellers to buyers. The bullish candle’s large body shows strong buying interest that overpowers the previous session’s selling. A Bullish Engulfing pattern is even more significant if it occurs near a key support level, and it often signals the beginning of a potential upward move.
What is the Morning Star?
The Morning Star is a three-candle bullish reversal pattern that occurs after a downtrend. The first candle is a long bearish one, followed by a small-bodied candle (which can be bullish, bearish, or a doji), indicating indecision in the market. The third candle is a strong bullish candle that closes well into the body of the first candle. This formation shows a transition from selling pressure to buying interest. The Morning Star is a reliable signal of a shift in momentum, especially when confirmed by high volume or a breakout from a resistance level.
What is the Three White Soldiers?
The Three White Soldiers pattern is a powerful bullish reversal signal made up of three consecutive long-bodied bullish candles. Each candle opens within the previous candle’s real body and closes near or at its high, showing consistent buying pressure. This pattern often appears after a prolonged downtrend or a period of consolidation and reflects strong and sustained buying interest. The Three White Soldiers suggest that buyers are firmly in control, and the market may continue moving upward in the near term.
How to use bullish candlestick patterns in trading?
To effectively use bullish candlestick patterns in trading, it’s important not to rely on them in isolation. While these patterns can signal potential reversals, they work best when combined with other technical tools such as support and resistance levels, moving averages, trendlines, and volume analysis. Traders should also wait for confirmation after the pattern forms, such as a strong follow-through candle or a break above a resistance level, before entering a trade. Risk management is crucial—always use stop-loss orders to protect against false signals, and consider the broader market trend to increase the probability of success. By integrating candlestick analysis into a comprehensive trading strategy, traders can improve their timing and increase their chances of making profitable decisions.
Thanks for your support. If you enjoyed this analysis, make sure to follow me so you don't miss the next one. And if you found it helpful, feel free to drop a like 👍 and leave a comment 💬, I’d love to hear your thoughts!
How to Use Engulfing Candles in TradingViewEngulfing patterns are among the most powerful candlestick formations because they signal strong momentum shifts and can help you spot dramatic trend reversal opportunities.
What You'll Learn:
• How to identify valid engulfing formations where one candle completely covers another's body
• The two types: bullish engulfing (green candle engulfs red) and bearish engulfing (red candle engulfs green)
• Psychology behind engulfing patterns: when one side completely overwhelms the other
• Using volume analysis to confirm engulfing pattern validity
• Finding meaningful engulfing patterns at trend highs and lows for reversal setups
• Timeframe considerations for engulfing analysis on any chart period
• Step-by-step trading strategy for engulfing reversal setups
• Setting proper stop losses above engulfing candle highs
• Determining profit targets below engulfing candle lows
• Managing wide-range drawdowns common with strong momentum shifts
• Advanced entry technique: waiting for retracements to improve risk-reward ratios
This tutorial may help futures traders and technical analysts who want to use powerful candlestick patterns to identify significant momentum changes.
The strategies covered could assist you in creating effective reversal setups when strong buying or selling pressure appears at key price levels.
Learn more about futures trading with Tradingview: optimusfutures.com
Disclaimer:
There is a substantial risk of loss in futures trading. Past performance is not indicative of future results. Please trade only with risk capital. We are not responsible for any third-party links, comments, or content shared on TradingView. Any opinions, links, or messages posted by users on TradingView do not represent our views or recommendations. Please exercise your own judgment and due diligence when engaging with any external content or user commentary.
This video represents the opinion of Optimus Futures and is intended for educational purposes only. Chart interpretations are presented solely to illustrate objective technical concepts and should not be viewed as predictive of future market behavior. In our opinion, charts are analytical tools—not forecasting instruments. Market conditions are constantly evolving, and all trading decisions should be made independently, with careful consideration of individual risk tolerance and financial objectives.

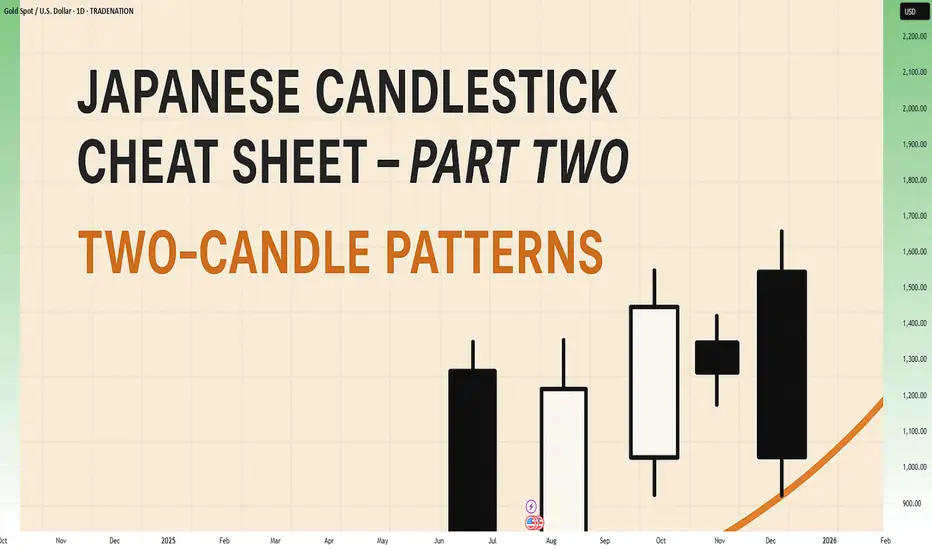
Japanese Candlestick Cheat Sheet – Part Two- 2 candle patternsTwo-Candle Patterns That Signal Shifts in Sentiment
Single candles whisper…
But two candles talk to each other — and when they do, they often reveal the first signs of a reversal or continuation.
In this second part of the series, we go deeper.
From engulfings to haramis, tweezer tops to piercing lines — these patterns don’t just look good on charts… they capture the psychological tug-of-war between buyers and sellers.
Price doesn’t lie.
And two candles in a row can say: “Something just changed.”
Learn to spot them early. Learn to listen when the chart speaks.
This is Part Two of your practical guide to mastering candlestick formations.
BULLISH KICKER
Bias: Bullish
What is the Bullish Kicker pattern?
The Bullish Kicker forms when a strong bullish candle follows a bearish one with no overlap between the two, indicating a sudden shift in sentiment. This pattern is a powerful indicator of a reversal as buyers take control. The sharp contrast between the bearish and bullish candles reflects a dramatic shift in market psychology, where bears are caught off-guard and forced to cover their positions.
Bullish Kickers are rare but extremely telling, providing a clear signal that sentiment is favoring buyers. Recognizing such decisive patterns can be a game-changer.
Meaning:
Found after downtrends or sell-offs; suggests a sudden shift in sentiment, indicating strong buying interest and potential trend reversal.
BULLISH ENGULFING
Bias: Bullish
What is the Bullish Engulfing pattern?
The Bullish Engulfing pattern occurs when a large bullish candle fully engulfs the previous smaller bearish candle, signaling a potential trend reversal. This pattern highlights a moment when buyers overpower sellers, often marking the beginning of upward momentum. Psychologically, it suggests that buyer confidence is returning, and sellers are losing their grip.
For traders, understanding Bullish Engulfing patterns can provide crucial entry points into emerging trends. Learning to identify and trade such patterns is essential for capturing momentum and new trends.
Meaning:
Typically found in downtrends, this pattern signals a potential bullish reversal as buyers overpower sellers, often indicating a shift toward upward momentum.
BULLISH HARAMI
Bias: Bullish
What is the Bullish Harami pattern?
The Bullish Harami consists of a small bullish candle within a preceding larger bearish one, indicating a pause in downward momentum and hinting at a potential reversal. This pattern shows that sellers are beginning to weaken as buyers cautiously test the waters. The Harami reflects a shift in sentiment from bearish to neutral, often marking a transitional phase in the market.
Interpreting the Bullish Harami helps traders spot moments when sentiment is shifting, potentially signaling the start of a trend change.
Meaning:
Seen in downtrends, it suggests indecision, with possible bullish reversal if the following candles confirm buying strength, indicating a weakening bearish trend.
PIERCING LINE
Bias: Bullish
What is the Piercing Line pattern?
The Piercing Line forms when a bullish candle opens below the previous bearish candle’s low but closes over halfway into it. Found in downtrends, this pattern reflects strong buying pressure as buyers step in at lower prices, creating a potential bullish reversal. The Piercing Line pattern suggests that sentiment may be shifting as buyers gain confidence.
This pattern’s strength lies in its psychological impact, revealing moments when buyers are willing to take risks. Recognizing these signs early can provide valuable insights for traders looking to time entries.
Meaning :
Found in downtrends, this pattern suggests a possible bullish reversal if buying continues, as sellers lose control to buyers.
TWEEZER BOTTOM
Bias: Bullish
What is the Tweezer Bottom pattern?
The Tweezer Bottom pattern is characterized by two consecutive candles with nearly identical lows, one bearish and one bullish. This pattern often signals the end of a downtrend, as the matching lows suggest a strong support level where buyers are stepping in. The Tweezer Bottom highlights market psychology at work, with sellers unable to push prices lower, reflecting renewed buying interest.
Tweezer Bottoms are ideal for traders looking to identify support zones and potential reversal points. By understanding this pattern’s significance, traders can make informed decisions.
Meaning:
Found in downtrends, it signals potential reversal, showing strong support at the matching low, suggesting buyers are stepping in.
BEARISH KICKER
Bias: Bearish
What is the Bearish Kicker pattern?
The Bearish Kicker is the inverse of the Bullish Kicker, forming when a strong bearish candle follows a bullish one without overlap, indicating a sharp sentiment shift. This pattern often marks a sudden reversal, with sellers taking control after an initial bullish period. Psychologically, Bearish Kickers are powerful, signaling that buyers are caught off-guard and losing momentum.
Recognizing Bearish Kickers provides traders with insights into sudden shifts in market dynamics, helping them avoid buying into weakening trends.
Meaning:
Found after uptrends; indicates a sudden sentiment shift, signaling potential trend reversal and intensified selling pressure.
BEARISH ENGULFING
Bias: Bearish
What is the Bearish Engulfing pattern?
The Bearish Engulfing pattern forms when a large bearish candle engulfs the previous smaller bullish candle, suggesting a potential reversal in an uptrend. This pattern signals that sellers have regained control, often marking the start of downward momentum. The Bearish Engulfing reveals a psychological shift, as selling pressure overtakes buying interest.
This pattern is a powerful tool for traders who aim to catch trend reversals, allowing them to align with emerging downward momentum.
Meaning:
Typically found in uptrends, this pattern signals a potential bearish reversal as sellers overpower buyers, often indicating a downward momentum shift.
BEARISH HARAMI
Bias: Bearish
What is the Bearish Harami pattern?
The Bearish Harami consists of a small bearish candle contained within a larger preceding bullish one, reflecting indecision and a potential trend reversal. Found in uptrends, it hints that buyers are losing strength, while sellers are cautiously testing the market. This pattern highlights moments when buyer momentum begins to wane, suggesting caution.
Interpreting the Bearish Harami allows traders to spot potential shifts in sentiment, helping them manage risk and time their exits.
Meaning:
Seen in uptrends, it suggests indecision with a potential bearish reversal if following candles confirm, indicating a weakening bullish trend.
DARK CLOUD COVER
Bias: Bearish
What is the Dark Cloud Cover pattern?
The Dark Cloud Cover appears when a bearish candle opens above the previous bullish candle but closes over halfway into it, reflecting a shift in control from buyers to sellers. This pattern suggests that bullish momentum may be fading, hinting at a potential reversal. Dark Cloud Cover patterns reveal moments when sentiment shifts from optimism to caution.
For traders, understanding this pattern helps them anticipate reversals at the top of uptrends.
Meaning:
Found in uptrends; signals potential bearish reversal if selling continues, as buyers lose control to sellers.
TWEEZER TOP
Bias: Bearish
W hat is the Tweezer Top pattern?
The Tweezer Top is formed by two candles with matching or nearly matching highs, typically one bullish and one bearish. This pattern signals potential resistance, as sellers are consistently pushing back against the same level. The Tweezer Top reflects a moment of seller strength, often marking the end of an uptrend.
Recognizing Tweezer Tops helps traders spot resistance zones and potential reversal points, allowing them to avoid buying into weakening trends or even shorting the asset.
Meaning:
Found in uptrends, it signals potential reversal, showing strong resistance at the matching high, suggesting selling pressure.
🧭 Final Thought
Two-candle formations often appear at key turning points — right where most traders hesitate or get trapped.
Learn to read them not just as patterns, but as conversations between candles — one pushing, the other reacting.
And if this is your first time reading the series, don’t miss Part One – where we covered single-candle signals like dojis, hammers, and marubozus — the very foundations of candlestick reading.
Bullish Engulfing Pattern: A Strong Reversal SignalBullish Engulfing Pattern: A Strong Reversal Signal
The bullish engulfing pattern is a two-candlestick formation that suggests a possible reversal from a downtrend to an uptrend in the financial market. This particular pattern holds immense value for traders and technical analysts as it equips them with the means to discern potential buying opportunities. In this article, we will explain how traders implement this pattern in their trading strategies.
What Is a Bullish Engulfing Pattern?
The bullish engulfing is a technical analysis pattern consisting of two candles. This formation emerges when a large bearish candlestick is succeeded by a larger green one that entirely engulfs it.
What does the bullish engulfing mean? The bullish engulfing indicates a potential shift in market sentiment, suggesting that buying pressure might surpass selling pressure in the near future and highlighting a possible reversal from a downtrend to an uptrend.
Traders can find the bullish engulfing candlestick pattern across various financial instruments, including currencies, stocks, cryptocurrencies*, ETFs, and indices.
Bearish Engulfing vs Bullish Engulfing
The bullish engulfing pattern has a counterparty - bearish engulfing. The bearish engulfing pattern occurs during an uptrend, indicating a change in market sentiment and potential price reversal to the downside. It consists of two candles, where the second is larger and bearish and completely engulfs the body of the preceding candlestick.
How Can You Trade the Bullish Engulfing Pattern?
Here are some steps traders consider when trading with the bullish engulfing:
- Identification: Look for a clear bullish engulfing setup on a price chart at the end of a downtrend.
- Entry Point: Although candlestick patterns don't provide precise entry and exit points as chart patterns do, there are general rules you could use.
The entry point could be set slightly above the high of the bullish engulfing formation. In the conservative approach, traders enter the market after several candles close higher. In a risky approach, traders open a buy position after the pattern is formed.
- Exit Point: A stop-loss level could be below the low of the engulfing candle or below a nearby support level. A take-profit level could be based on a trader’s risk/reward ratio or key resistance levels.
- Risk Management: You can consider a risk management strategy to potentially limit losses. Traders focus on appropriate position sizing and risk-to-reward ratios to maintain a balanced approach to trading.
- Trade Monitoring: Once you have entered the trade, monitor price action and market conditions. Pay attention to any sign of reversal confirmation or potential obstacles that may invalidate the signal.
- Stop-Loss and Take-Profit Adjustment: As the trade progresses, you may consider adjusting your stop-loss level to protect potential returns. Similarly, you may consider adjusting your take-profit level if the price signals a strong uptrend.
Live Market Example
Let's consider an example of a bullish engulfing on the forex chart. The bullish engulfing candle in the example below is marked with 1 and 2. The trader sets the entry point above the green candle and a stop-loss level below it. The take profit is at the closest resistance level.
How Do Traders Confirm a Bullish Engulfing Candlestick Pattern?
Confirming this pattern enhances the reliability of its signals and helps traders make informed decisions. Here are key steps to confirm it:
- Volume Analysis: Traders typically look for increased buying trading volume accompanying the candle. Higher volume suggests stronger buyers’ interest and validates the reversal signal.
- Follow-Up Candlesticks: Waiting for subsequent closes can confirm the upward momentum. A series of higher closes strengthens its credibility.
- Support Levels: If it forms near a significant support level, this adds context to the reversal, as buyers are stepping in at a critical price point.
- Technical Indicators: Complementary indicators like the Relative Strength Index (RSI), Stochastic Oscillator, or a pair of moving averages can confirm the shift in sentiment.
- Market Context: Traders assess the overall market trend and news to ensure the formation aligns with broader market conditions.
Bullish Engulfing and Other Patterns
Let’s take a closer look at how this pattern compares to other chart formations, like the piercing and harami.
What Is the Difference Between a Bullish Engulfing and a Piercing Pattern?
A bullish engulfing pattern occurs when a large bearish bar is followed by a larger candlestick that completely overtakes the former's body. This indicates a strong potential reversal from a downtrend to an uptrend.
In contrast, a piercing formation also signals a potential reversal but is slightly weaker. It forms when a bearish candle is followed by a bullish candle that closes above its midpoint but doesn’t envelop it entirely.
What Is the Difference Between a Bullish Engulfing Pattern and a Bullish Harami Pattern?
The bullish harami pattern consists of a large red candle followed by a smaller green candle that is completely contained within the body of the red candle. This formation suggests a potential reversal but is generally considered less strong than the bullish engulfing candle pattern, as the latter completely envelops the previous bearish bar, showing more decisive buying pressure.
Final Thoughts
While this pattern offers valuable insights into potential trend reversals, it's essential to complement it with technical indicators and robust risk management for effective use. Also, be sure to explore other patterns as they may look very similar but provide different signals.
FAQ
What Is a Bullish Engulfing Pattern?
A bullish engulfing pattern is a two-candlestick formation in technical analysis that suggests a potential reversal from a downtrend to an uptrend. It occurs when a large bearish candlestick is followed by a larger bullish candlestick that completely engulfs the body of the preceding bearish candle.
How Reliable Is the Bullish Engulfing Pattern?
The reliability of the bullish engulfing pattern as a reversal signal depends on various factors, including the overall market context, confirmation from other technical indicators, and the timeframe being analysed. While it can be a strong indication of a potential trend reversal, it is not foolproof and should be used in conjunction with other tools and fundamental analysis.
What Is a Bullish Engulfing Candle Trading Strategy?
The bullish engulfing candle strategy involves identifying this pattern at the end of a downtrend as a signal for a potential sentiment shift. Traders typically enter a buy position slightly above the high of the closing bar, with stop-loss levels set below the low or beneath nearby support levels. Take-profit levels are determined based on risk/reward ratios or key resistance levels.
Do Wicks Matter in Engulfing Candlesticks?
Yes, wicks matter in the formation. The wicks provide insights into price rejection and volatility. For a strong confirmation, the absence of long upper wicks suggests sustained buying pressure, reinforcing its validity as a reversal signal.
*Important: At FXOpen UK, Cryptocurrency trading via CFDs is only available to our Professional clients. They are not available for trading by Retail clients. To find out more information about how this may affect you, please get in touch with our team.
This article represents the opinion of the Companies operating under the FXOpen brand only. It is not to be construed as an offer, solicitation, or recommendation with respect to products and services provided by the Companies operating under the FXOpen brand, nor is it to be considered financial advice.

Mastering Candlestick Patterns - How to use them in trading!Introduction
Candlesticks are one of the most popular and widely used tools in technical analysis. They offer a visual representation of price movements within a specific time period, providing valuable insights into market trends, sentiment, and potential future price movements.
Understanding candlestick patterns is crucial for traders, as these formations can indicate whether a market is bullish or bearish, and can even signal potential reversals or continuations in price. While candlesticks can be powerful on their own, trading purely based on candlestick patterns can be challenging and risky.
-----------------------------------------------------------------------------------------------
What are we going to discuss:
1. What are candlesticks?
2. What are bullish candlestick patterns?
3. What are bearish candlestick patterns?
4. How to use candlestick patterns in trading?
-----------------------------------------------------------------------------------------------
1. What are candlesticks?
A candlestick in trading is a visual representation of price movement in a specific time period on a chart. It is a fundamental element used in technical analysis to study market trends, determine price levels, and predict potential future price movements. A single candlestick consists of four main components: the open, close, high, and low prices for that time period.
Here’s how a candlestick works:
- The Body: The rectangular area between the open and close prices. If the close is higher than the open, the body is green, indicating a bullish (upward) movement. If the close is lower than the open, the body is red, signaling a bearish (downward) movement.
- The Wick (high and low of the candle): The thin lines extending above and below the body. These represent the highest and lowest prices reached during the period. The upper wick shows the highest price, while the lower wick shows the lowest price.
- The Open Price: The price at which the asset began trading in that time period (for example, the start of a day, hour, or minute depending on the chart timeframe).
- The Close Price: The price at which the asset finished trading at the end of the period.
-----------------------------------------------------------------------------------------------
2. What are bullish candlestick patterns?
What is a Hammer Candlestick Pattern?
A hammer candlestick pattern has a small body near the top of the candle and a long lower wick, typically two to three times the length of the body. There is little to no upper wick. This formation shows that during the trading session, sellers managed to push the price significantly lower, continuing the downward momentum. However, buyers eventually stepped in with strong demand and drove the price back up near the opening level by the close.
What is an Inverted Hammer?
An inverted hammer has a small body near the bottom of the candle with a long upper wick, usually at least two to three times the size of the body, and little to no lower wick. This unique shape resembles an upside-down hammer, hence the name.
What is a Dragonfly Doji?
A dragonfly doji has a unique shape where the open, close, and high prices are all at or very close to the same level, forming a flat top with a long lower wick and little to no upper wick. This gives the candle the appearance of a "T," resembling a dragonfly.
What is a Bullish Engulfing?
A bullish engulfing candlestick consists of two candles. The first candle is bearish, indicating that sellers are still in control. The second candle is a large bullish candle that completely engulfs the body of the first one, meaning it opens below the previous close and closes above the previous open. This pattern reflects a clear shift in market sentiment. During the second candle, buyers step in with significant strength, overpowering the previous selling pressure and reversing the momentum. The fact that the bullish candle completely engulfs the previous bearish candle indicates that demand has taken over, signaling a potential trend reversal.
What is a Morning Star?
The morning star consists of three candles. The first is a long bearish candle, indicating that the downtrend is in full force, with strong selling pressure. The second candle is a small-bodied candle, which can be either bullish or bearish, representing indecision or a pause in the downtrend. Often, the second candle gaps down from the first, indicating that the selling pressure is subsiding but not yet fully reversed. The third candle is a long bullish candle that closes well above the midpoint of the first candle, confirming that buyers have taken control and signaling the potential start of an uptrend.
-----------------------------------------------------------------------------------------------
3. What are bearish candlestick patterns?
What is a Shooting Star?
A shooting star has a smal body near the low of the candle and a long upper wick, usually at least twice the size of the body, with little to no lower wick. This shape shows that buyers initially pushed the price higher during the session, continuing the upward momentum. However, by the close, sellers stepped in and drove the price back down near the opening level.
What is a Hanging Man?
A hanging man has a distinct shape, with a small body positioned near the top of the candle and a long lower wick, usually at least twice the length of the body. There is little to no upper wick. The appearance of this candle suggests that although there was strong selling pressure during the session, buyers managed to bring the price back up near the opening level by the close. Despite the recovery, the long lower wick shows that sellers were able to push the price down significantly at one point. This introduces uncertainty into the uptrend and can indicate that bullish momentum is weakening.
What is a Gravestone Doji?
A gravestone doji has a distinctive shape where the open, low, and close prices are all at or near the same level, forming a flat base. The upper wick is long and stretches upward. This shape resembles a gravestone, which is where the pattern gets its name.
What is a Bearish Engulfing?
A bearish engulfing candlestick pattern is a two-candle reversal pattern that typically appears at the end of an uptrend and signals a potential shift from bullish to bearish sentiment. The first candle is a smaller bullish candle, reflecting continued upward momentum. The second candle is a larger bearish candle that completely engulfs the body of the first one, meaning it opens higher than the previous close and closes lower than the previous open. This indicates that bears have taken control, overpowering the buyers, and suggests a potential downside movement.
What is an Evening Star?
An evening star is a bearish candlestick pattern that typically signals a potential reversal at the top of an uptrend. It consists of three candles and reflects a shift in momentum from buyers to sellers. The pattern starts with a strong bullish candle, showing continued buying pressure and confidence in the upward move. This is followed by a smaller-bodied candle, which can be bullish or bearish, and represents indecision or a slowdown in the uptrend. The middle candle often gaps up from the first candle, showing that buyers are still trying to push higher, but the momentum is starting to weaken. The third candle is a strong bearish candle that closes well into the body of the first bullish candle. This candle confirms that sellers have taken control and that a trend reversal could be underway. The more this third candle erases the gains of the first, the stronger the reversal signal becomes.
-----------------------------------------------------------------------------------------------
4. How to use candlestick patterns in trading?
Candlestick patterns are most useful when they appear at key levels, such as support, resistance, or significant trendlines. For instance, if a bullish reversal pattern like a hammer or bullish engulfing forms at a support level, it may indicate that the downtrend is losing momentum, and a reversal could be coming.
Trading based on candlestick patterns alone can be risky. To improve your chances of success, always seek additional confirmation from other technical analysis tools. Here are some common ones:
- Support and Resistance Levels: Look for candlestick patterns that form near key support or resistance levels. For instance, if the price reaches a support zone and a bullish reversal candlestick pattern forms, this may suggest a potential upward reversal.
- Fibonacci Retracement: Use Fibonacci levels to identify potential reversal zones. If a candlestick pattern appears near a key Fibonacci level (such as the Golden Pocket), it adds confirmation to the idea that the price may reverse.
- Liquidity Zones: These are areas where there is a high concentration of buy or sell orders. Candlestick patterns forming in high liquidity zones can indicate a stronger potential for a reversal or continuation.
- Indicators and Oscillators: Incorporating indicators like the Relative Strength Index (RSI), Moving Averages, MACD, or Stochastic RSI can help confirm the momentum of the price. For example, if a candlestick pattern forms and the RSI shows an oversold condition (below 30), this could indicate a potential reversal to the upside.
It’s crucial to wait for confirmation before entering a trade. After a candlestick pattern forms, it’s important to wait for the next candle or price action to confirm the signal. For example, if you spot a bullish reversal candlestick like a hammer at support, wait for the next candle to close above the hammer’s high to confirm that buyers are in control and a reversal is likely.
-----------------------------------------------------------------------------------------------
Thanks for your support.
- Make sure to follow me so you don't miss out on the next analysis!
- Drop a like and leave a comment!

Mastering Candlestick Patterns: Visual Guide for Traders
🔵 Introduction
Candlestick charts are among the most popular tools used by traders to analyze price movements. Each candlestick represents price action over a specific time period and provides valuable insights into market sentiment. By recognizing and understanding candlestick patterns, traders can anticipate potential price reversals or continuations, improving their trading decisions. This article explains the most common candlestick patterns with visual examples and practical Pine Script code for detection.
🔵 Anatomy of a Candlestick
Before diving into patterns, it's essential to understand the components of a candlestick:
Body: The area between the open and close prices.
Upper Wick (Shadow): The line above the body showing the highest price.
Lower Wick (Shadow): The line below the body showing the lowest price.
Color: Indicates whether the price closed higher (bullish) or lower (bearish) than it opened.
An illustrative image showing the anatomy of a candlestick.
🔵 Types of Candlestick Patterns
1. Reversal Patterns
Hammer and Hanging Man: These single-candle patterns signal potential reversals. A Hammer appears at the bottom of a downtrend, while a Hanging Man appears at the top of an uptrend.
Engulfing Patterns:
- Bullish Engulfing: A small bearish candle followed by a larger bullish candle engulfing the previous one.
- Bearish Engulfing: A small bullish candle followed by a larger bearish candle engulfing it.
Morning Star and Evening Star: These are three-candle reversal patterns that signal a shift in market direction.
Morning Star: Occurs at the bottom of a downtrend, indicating a potential bullish reversal. It consists of:
- A long bearish (red) candlestick showing strong selling pressure.
- A small-bodied candlestick (bullish or bearish) indicating indecision or a pause in selling. This candle often gaps down from the previous close.
- A long bullish (green) candlestick that closes well into the body of the first candle, confirming the reversal.
Evening Star: Appears at the top of an uptrend, signaling a potential bearish reversal. It consists of:
- A long bullish (green) candlestick showing strong buying pressure.
- A small-bodied candlestick (bullish or bearish) indicating indecision, often gapping up from the previous candle.
- A long bearish (red) candlestick that closes well into the body of the first candle, confirming the reversal.
2. Continuation Patterns
Doji Patterns: Candles with very small bodies, indicating market indecision. Variations include Long-Legged Doji, Dragonfly Doji, and Gravestone Doji.
Rising and Falling Three Methods: These are five-candle continuation patterns indicating the resumption of the prevailing trend after a brief consolidation.
Rising Three Methods: Occurs during an uptrend, signaling a continuation of bullish momentum. It consists of:
- A long bullish (green) candlestick showing strong buying pressure.
- Three (or more) small-bodied bearish (red) candlesticks that stay within the range of the first bullish candle, indicating a temporary pullback without breaking the overall uptrend.
- A final long bullish (green) candlestick that closes above the high of the first candle, confirming the continuation of the uptrend.
Falling Three Methods: Appears during a downtrend, indicating a continuation of bearish momentum. It consists of:
- A long bearish (red) candlestick showing strong selling pressure.
- Three (or more) small-bodied bullish (green) candlesticks contained within the range of the first bearish candle, reflecting a weak upward retracement.
- A final long bearish (red) candlestick that closes below the low of the first candle, confirming the continuation of the downtrend.
🔵 Coding Candlestick Pattern Detection in Pine Script
Detecting patterns programmatically can improve trading strategies. Below are Pine Script examples for detecting common patterns.
Hammer Detection Code
//@version=6
indicator("Hammer Pattern Detector", overlay=true)
body = abs(close - open)
upper_wick = high - math.max(close, open)
lower_wick = math.min(close, open) - low
is_hammer = lower_wick > 2 * body and upper_wick < body
plotshape(is_hammer, title="Hammer", style=shape.triangleup, location=location.belowbar, color=color.green, size=size.small)
Bullish Engulfing Detection Code
//@version=6
indicator("Bullish Engulfing Detector", overlay=true)
bullish_engulfing = close < open and close > open and close > open and open < close
plotshape(bullish_engulfing, title="Bullish Engulfing", style=shape.arrowup, location=location.belowbar, color=color.blue, size=size.small)
🔵 Practical Applications
Trend Reversal Identification: Use reversal patterns to anticipate changes in market direction.
Confirmation Signals: Combine candlestick patterns with indicators like RSI or Moving Averages for stronger signals.
Risk Management: Employ patterns to set stop-loss and take-profit levels.
🔵 Conclusion
Candlestick patterns are powerful tools that provide insights into market sentiment and potential price movements. By combining visual recognition with automated detection using Pine Script, traders can enhance their decision-making process. Practice spotting these patterns in real-time charts and backtest their effectiveness to build confidence in your trading strategy.

Understanding Bullish Engulfing Candlestick PatternThe Bullish Engulfing Candlestick Pattern is a popular price action signal used by traders to identify potential trend reversals in the market. If you're keen on mastering price action trading, understanding this pattern is essential. This guide will take you from the basics of the pattern to advanced insights, with easy-to-understand explanations to help you become more confident in your trading decisions.
What is a Bullish Engulfing Candlestick?
A bullish engulfing candlestick is a two-candle pattern that signals a potential reversal in a bearish trend. The pattern consists of a smaller bearish (red) candle followed by a larger bullish (green) candle that completely engulfs the previous one. This indicates that the buying pressure has overwhelmed the sellers, suggesting a shift from a downtrend to an uptrend.
Key Features of the Bullish Engulfing Pattern
Here’s a breakdown of the key characteristics:
Number of Candles: The pattern consists of two candles.
First Candle: A bearish candle, typically red, showing a decline in price.
Second Candle: A bullish candle, typically green, that completely engulfs the previous bearish candle, including its wicks.
Prior Trend: A bearish trend must precede the pattern to validate it as a potential reversal signal.
Prediction: A potential shift from bearish to bullish trend.
The Anatomy of a Bullish Engulfing Pattern
To fully grasp this pattern, let's break down the structure:
The first candle in the pattern is a small bearish candle, indicating the continuation of a downtrend.
The second candle is a large bullish candle that opens lower than the previous close and closes higher than the previous high, completely engulfing it. This suggests a strong buying momentum.
Why Do Bullish Engulfing Patterns Work?
A bullish engulfing pattern is significant because it reflects a shift in market sentiment. Here’s why:
Seller Exhaustion: The first candle shows a bearish trend, indicating seller dominance. When the second candle engulfs it, it suggests that sellers are losing control.
Buyer Strength: The second candle’s larger body signals strong buying interest, indicating a shift in market control from sellers to buyers.
Market Psychology: A bullish engulfing pattern indicates that traders are willing to buy at higher prices, leading to increased bullish momentum.
Why a Pin Bar Can Be an Engulfing Pattern
A common observation among experienced traders is that a pin bar on a higher timeframe can appear as a bullish engulfing pattern on a lower timeframe. This happens because:
A pin bar shows a strong rejection of lower prices, which on a lower timeframe looks like a large bullish candle engulfing smaller bearish candles.
This highlights the importance of multi-timeframe analysis. Understanding how patterns form on different timeframes gives a more holistic view of market dynamics.

How to Spot and Trade the ENGULFING CANDLE
Hey traders,
In this post, we will discuss a classic candlestick pattern formation each trader must know - the engulfing candle.
Key properties of this pattern:
🔑 Engulfing candle is a reversal pattern.
🔑 Engulfing candle can be bullish or bearish.
❗️Also, remember that this candle demonstrates the highest accuracy when it is formed on a key level (support or resistance).
⬆️Bullish Engulfing Candle usually forms after a strong bearish impulse.
Weakening, the market keeps going lower forming bearish candles.
However, at some moment, instead of forming a new bearish candle the market reverses. The price forms a bullish candle that engulfs the range of the previous bearish candle and closes above its opening price.
Such a candle we call a bullish engulfing candle.
The main feature of this pattern is the fact that its total range (distance from the wick high to wick low) & body range (distance from body open to body close) exceed the ranges of a previous bearish candle.
Being formed on a key support level or within a demand zone it signifies a highly probable pullback or even a trend reversal.
⬇️Bearish Engulfing Candle usually forms after a strong bullish move.
Reaching an overbought condition, the market keeps going higher forming bullish candles.
However, at some moment, instead of forming a new bullish candle the market goes in the opposite direction. The price forms a bearish candle that engulfs the range of the previous bullish candle and closes below its opening price.
Such a candle we call a bearish engulfing candle.
The main feature of this pattern is the fact that its total range (distance from the wick high to wick low) & body range (distance from body open to body close) exceed the ranges of a previous bullish candle.
Being formed on a key resistance level or within a supply zone it signifies a highly probable pullback or even a trend reversal.
Take a look how powerful the engulfing candle is: on Gold chart, 4H time frame, the price formed a bullish engulfing candle after a pullback. The formation of the pattern immediately triggered a bullish continuation.
At some moment, the market became overbought, the formation of a bearish engulfing candle confirmed the initiation of a bearish movement and the market dropped heavily then.
📝Engulfing candle can be applied for scalping lower time frames, for intraday trading, or even for swing trading.
Personally, I apply this candle on daily/4h time frames as one of the confirmations of the strength of the structure level that I spotted.
Let me know, traders, what do you want to learn in the next educational post?

Mastering Engulfing Candle Trading
📚Engulfing candles are an essential feature of technical analysis in forex trading. An engulfing pattern happens when a larger candle engulfs the entire body of the previous candle, signaling a potential reversal of the current trend. Engulfing candles, which can be either bullish or bearish, are trusted by many traders for their reliability in predicting future price movements. However, to become an expert in engulfing candle trading, one needs to learn how to identify the best ones and leverage their body size effectively. In this article, we will look at the crucial steps to master this trading strategy.
🔎Identifying the Best Engulfing Candles
One of the key aspects of trading using engulfing candles is knowing how to spot the strongest signals. The best engulfing candles should be resistant to the noise and inconsistent movements that can often occur in the forex market. The first step towards identifying the best engulfing candles is to focus on the size of the preceding candles. Candles with small bodies and long wicks produce too much noise and can lead to false signals. Instead, seek engulfing candles that develop after a significant price move, ideally with a larger body and shorter wick. Higher timeframe charts - like the 4-hour and daily - offer better accuracy in identifying reliable engulfing patterns.
💪Leveraging Body Size for More Efficient Trading
The size of an engulfing candle’s body plays a crucial role in determining the strength of a trend. A larger body indicates more significant price movement and more active participation from traders. The size of the engulfing candle can also help ascertain the potential strength of the new trend. Bigger body sizes usually signal a stronger trend, whereas smaller bodies usually represent a more moderate price move. Traders can leverage body size to adjust their trading strategy – for instance, employing wider stop losses for more significant movements or using tighter take profit targets for moderate trends.
I have collected couple of good engulfing candles that we were trading with our team.
Take a closer look at their body sizes and the previous candles.
Such candles alone can provide fantastics trading opportunities.
🔔Conclusion
Engulfing candles are an essential tool in forex trading, and their size can significantly help traders identify the best entry signals. Traders who master engulfing candle trading can develop a more accurate technical analysis strategy that yields high returns. By continually analyzing candlestick patterns and using other technical analysis tools, traders can build robust investment strategies that enable them to become profitable forex traders.
What do you want to learn in the next post?

Stochastic + RSI + MACD zero cross strategy from backtest on SPYStrategy
1. Stochastic cross at 50 level
2. RSI cross at 50 level
3. MACD cross at 0 level
4. Engulfing Candlestick?
5. Level 2 Tape sentiment balance (Optional)
Technical Analysis
It's a simple technical analysis setup strategy for bullish or bearish trading setup in both bullish and bearish sentiment scenarios. All levels in the indicators are at standard default settings.
Step One:
Look at the Stochastic indicator cross at 50 level and a cross over the signal line. This will be the first check and we want the cross to occur at the 50 level.
Step Two:
Check the RSI and need a cross at 50 level. This is the second confirmation.
Step Three:
Check the MACD cross and it's best to wait for the cross to happen at the zero line. This has a lower instances from occurring but it helps to avoid fake-outs that MACD is prone to showing.
Step Four:
Look for an engulfing candlestick pattern in the chart for a final confirmation.
Step Five (Optional):
If you have access to Level II quotes and the Time&Sales, watch for a momentum into the Ask side for a bullish sentiment or the Bid side for a bearish sentiment. Also you'll need to be familiar with tape reading on the volume and speed for better entry or exit.

THE ENGULFING CANDLE LIQUIDITY EntrySo let's learn something about engulfing candles entries. An engulfing candle is usually a momentum candle and in most cases signifies reversal and at times trend continuation. Now what you do is plot your fib on the engulfing candle from wick to wick and mark the 40-50% retracement area which becomes a potential supply liquidity zone to sell from a bearish engulfing and a demand liquidity zone to buy from a bullish engulfing. In short 90%+ of the time price will retrace back to these zones before continuing and can thus provide clean and safe entries with reduced drawdown, lower risk and a good risk to return. Try it

Tug of War Among Central BanksThere is a tug of war situation among the central banks to hike interest rates. What is the bad and the good that will come out from this?
i. Last week of October, European Central Bank officials announced another massive 75 basis point hike, increasing interest rates at the fastest pace in the history of the euro currency.
ii. This week, the Federal Reserve is expected to increase rates by 75 basis points for the fourth time in a row.
iii. The Bank of England could join the club on Thursday.
Content:
. The Interest Rate race has just started, why?
. The impact on different currencies
. It may not be all bad news, why?
With higher interest rates, it attracts investors to buy its currency, in this case the USD.
Currency is always a pair, when USD strengthens, the other side weakens.
When a currency gets weaker, it is very bad news for inflation because they will have to pay more on their imports.
Therefore in order to counter inflation, one of the best measures is to hike rate
Expect more volatility in the currencies market, meaning currencies will take its turn to move.
And if you are a trader, you should welcome volatility. Because with volatility, there are opportunities.
GBP Futures
0.0001 = $6.25
0.001 = $62.50
0.01 = $625
0.1 = $6,250
1.1000 to 1.2000 = $6,250
Disclaimer:
• What presented here is not a recommendation, please consult your licensed broker.
• Our mission is to create lateral thinking skills for every investor and trader, knowing when to take a calculated risk with market uncertainty and a bolder risk when opportunity arises.
CME Real-time Market Data help identify trading set-ups in real-time and express my market views. If you have futures in your trading portfolio, you can check out on CME Group data plans available that suit your trading needs www.tradingview.com

-FVG Example This candle creates the -FVG high. Use the low of this candle and extend out.
This candle breaks market structure to the downside in the form of an impulse candle, bearish engulfing.
The high of the candle following the engulfing candle sets the low of the -FVG and the candle should not trade back above through the candle high that created the lo.
You can look for setups at the -FVG high @3716.70, middle @3713.70 and low @3710.70.

[Candlestick Patterns] Just need to know these three!#Candlestick #CandlePattern #Tocademy #Tutorial
Hello traders from all over the world, this is Tommy =)
I was unexpectedly surprised by many of you who liked and supported my last post about the basic concept of TA(Technical Analysis). Today I prepared a brief lecture about the Candlestick Pattern, one of the most fundamental phenomenon and behaviors that traders must be well-informed. In fact, we should be very familiar with these textbook contents and interpret it in a glimpse on the technical chart unconsciously. Just like we don't pay direct attention about each breathes when breathing, like we don't care each and all of the alphabets when we speak, or like we don’t perceive location of each keyboards every moment as we type, this very technique should be performed automatically and quickly by observing dominant formations of candlestick bars.
As a matter of fact, comprehending market trends and price actions only by referring to the candlesticks is yet too spurious. It should be used in such a way to weight on certain scenarios in a macroscopic view, rather than deriving precise and specific PRZ(Potential Reversal Zone)s and distinguish the accurate market trend. It’s never like ‘The price must go up because this pattern just appeared’. Furthermore, I strongly believe that the reliability of the candlestick pattern strategy is declining especially in recent financial market, where we encounter countless non-traditional and abnormal situations that were not very common in the past. Hence among the existing ‘Textbook’ candlestick pattern strategies that can easily be found on Google, there are particular patterns that are still very reliable on current market and there are ones that are not as reliable as it used to be. So here, I will organize everything very clearly for you guys.
The technical chart is well known as sort of a map tracing the mob-psychology of all the stakeholders in the market. Investors’ sentiments such as FUD(Fear, Uncertainty, and Doubt) and FOMO(Fear of Missing Out) that often cause panic buy/sell are visualized as data. Those with a clear understanding of the fundamental nature of how candlesticks are being formed, don’t even need to memorize these patterns one by one. As I emphasized at my previous post, candlesticks should be interpreted as a whole structure, unlike the line chart expressed in one-dimensional. Candlesticks are newly formed in each time interval and we can choose the timeframe for the chart that we are about to analyze. For instance, each candlestick in a daily chart is formed every day while each candlestick in a 5minute chart is formed every 5 minutes. Higher the timeframe of the chart is, longer-term the scope within the chart is. It is important as a TA analyst to start from macro-perspective with higher timeframe first, then go deeper to lower timeframe and find short-term factors.
There are four independent prices composing a candlestick: open, high, low and close price. Open price indicates the starting point while close price indicates the ending point of a candlestick. Just like the wording, high/low prices are formed at the highest/lowest price during the time period of candlestick being formed. A bullish candlestick is when the closing price is above the opening price (i.e., when the price rises), while a bearish candle is when the closing price is below the opening price (i.e., when the price is falling), and the two are expressed in different colors (green & red or red & blue). The thick part between the opening and closing price is called the ‘Body’, and the thin part is called the ‘Tail’ (Wick or Shadow).
Typically, the length of the body implies the strength of an ongoing trend. We learned from the textbook that the candlesticks with a longer body means stronger trend and those with shorter tails mean clearer trend. Back in the days, there was time when we could detect if whales are involved and deduct impulsiveness of ongoing trend when distinctly long bodied candlesticks with relatively high trading volumes take places. I am afraid to tell you that it is better to erase that memory. First of all, it is too obvious and cliché to announce that the long candlesticks with high volumes mean strong market trend. This criterion itself is quite vague and not 100% reliable to identify future trends or find insightful signals. Moreover, in recent days (especially in Crypto), whales like to deceive retail traders with a strong faith of trading volumes and since the future markets are becoming bigger, giving too much weight on trading volume paired to each candlestick is not as effective as it was when textbook used to work very well. I am not saying textbook is wrong. It just needs slight updates since the market we are dealing with keeps changing over time.
In TA world, closing price of a candlestick carries a great meaning and thus closing prices at higher timeframes should very well be monitored to become a successful trader. Sometimes whales even battle aggressively right before a major closing time often causing a weird ‘scam’ moves with a high volume. As shown below, we usually find the price and time when certain TA variables (such as top/bottom of trendline, channels, pivot levels, and other indicators) are broken, meaning if the price has penetrated those variables successfully, in order to find breakout entries, stoplosses, and target prices, etc. This whole concept of breaking above or below is quite vague, subjective, and relative idea. So, what we traders refer to as a reliable criterion is confirming whether the candle closed above and below the factors. For instance, let’s say that we are seeking and waiting for the breakout of the downward trendline. Well sometimes it’s not as easy as expected to precisely spot and determine whether the price has successfully pierced through the trendline. There are times when price breaks the trendline, but ends up coming back below leading close price of the candlestick to be formed below the trendline like the case 2 below. In this very case, it’s difficult to determine whether the breakout happened successfully or not. Nevertheless, like case 3, when both closing and high prices are formed above the trendline, we can clearly confirm and weight more on the breakout scenario, expecting more bullish rally.
Okay let's get to the point. In recent financial trading market, it's enough to know just these three.
1. Engulfing
2. Doji
3. Long Tailed Candlestick
As mentioned above, there’s nothing hard if you understand the essential concepts and principles of the above patterns and phenomena. The engulfing candlestick is a phenomenon in which the body of the previous candle is consumed by the body of the next candle, that is, a larger body than the previous one comes out. In other words, if a new bullish candle closes higher than the previous open price or if a new bearish candle closes lower than the previous open price, we say ‘the new candlestick engulfed the previous one’. If we look closely, this pattern implies the circumstance where the new candle completely overwhelms the trend of the previous candle and reverses it into a new trend despite closing the price from above or below. However, the appearance of an engulfing candle does not mean that the trend is unconditionally reversed. It is often the case that engulfing candles take place consecutively, with the second candle taking over the body of the first candle, the third’s taking over the second’s, the fourth’s taking over the third’s and so on. As the price fluctuates up and down, it creates a Widening or Broadening pattern also known as expanding sort of shapes, making it difficult for traders to figure out the current trend. In this circumstance, the entry prices, stop loss prices, target prices, or average prices of many participants in the market tend to be located relatively nearby. This price range or region is called a HVP(High Volume Profile or Peak) or an Orderblock and I will cover details about this concept later on another post. Anyway, there are numerous methods to derive Orderblock and one of them is to spot bodies of the consecutive engulfing candlesticks.
The tail(wick) of a candlestick can be interpreted as a sign of the fierce battle between the bulls are bears. Longer tail signifies bigger collision between buying and selling forces. The longer the upper tail, the more the bulls trying to raise the price up but the bears rejecting them eventually sellers ending up being dominant and vice versa for the longer the lower tail. Generally, when the long upper/lower tails are formed at a relative higher/lower part of the wave structure or at a distinctive pullback as a PRZ this can be a possible signal of trend reversal. Due to my personal trading experience, it doesn't matter much in recent TA market whether the long-tailed candlestick is a bullish or bearish. In other words, regardless of the color of Hammer or Shooting star (which are both long-tailed candlestick pattern), it’s better to check if the next following candlesticks are being formed opposite direction of the tail. Personally, I don't think the Inverted Hammer and Hanging Man are not as necessary as it used to be in the old days.
When the length of the candlestick’s body is relatively short meaning if the open and close prices are very close, forming a cross like shape, it’s called a Doji. Since Doji has a short body, the upper and lower tails tend to come out longer and thus can be considered as evidence of a tense confrontation between the bulls and bears that eventually ends up reaching a balance. Similar to the long-tailed candlestick, Doji is also known as a sign of a PRZ depending on the next appearing candlesticks. When Dojis are observed after swing high or low, it can be a possible indicator that the on-going trend is overheated and you might want to anticipate some pullbacks. However, it is too risky to directly assume that the top or bottom is near just because of Doji. Especially in the market these days, Dojis also appear frequently in sideways and sometimes confuses traders searching for a clear trend.
As emphasized above, as with other technical techniques, theories, and indicators, always remember to weight more to the emergence of patterns in higher timeframes and longer-term perspectives. The higher timeframe people globally refer to, the more the reliability the TA will be. Just think about it for a second. Which timeframe do you think that people consider more significantly about the closing price, a 5 minutes chart or a daily chart? I would obviously say that the price signals from the daily cart is relatively more representative and reflect longer-term than those of the 5 minutes chart. Keep in mind is that you also need to understand market trends from a macro perspective before approaching towards short-term perspective. It is always recommended to recognize long-term trends or situations in advance from the candlestick of a higher timeframe, and then look at more detailed and microscopic elements step by step.
All right. I will wrap up now. Thanks for reading my post.
Your subscriptions, likes, and comments are a huge inspiration for me to write more posts!

Engulfing Candlestick PatternEngulfing candlestick is formed when it completely engulfs the previous more than one candle but be considered an engulfing candlestick pattern because in Engulfing at least one candle must fully engulf.
Types of Engulfing Candlestick Pattern
Bullish Engulfing Pattern
Bearish Engulfing Pattern
#1 Bullish Engulfing Pattern
Bullish Engulfing pattern consists of two candle formations, the first candle is the small body and the second candle is the bigger. The second big candle should be fully engulfed than the previous small candle. This is called the bullish engulfing pattern.
#2 Bearish Engulfing Pattern
Bearish Engulfing pattern consists of two candle formations, the first candle is a small Bullish candle and the second is the bigger bearish Candle than the previous bullish candle. The Second big bearish candle should fully engulf the previous one or more small candles. This is called a bearish engulfing pattern.

ENGULFING CANDLE. Powerful reversal candlestick pattern🕯
✅Candlestick patterns trading is one of the oldest but most effective ways to analyze the foreign exchange market. The trader needs to find certain patterns, and based on them, decide where the price will go. Today we will talk about one of these candlesticks, which is called the "engulfing candle". There are two types of it: bullish and bearish. The appearance of such a model on the chart with a high probability indicates a possible reversal of the trend and is a signal to enter the market.
Types of engulfing and their features
⚠️So, we realized that there are two types of this candle:
🟢Bullish. It indicates that the trend is turning towards an increase in the value of an asset or currency pair. The candle must engulf the range of the previous bearish candle to be valid.
🟢Bearish. The same as with bullish, only the opposite. It indicates that the trend is turning towards a decrease in the value of the asset. In this case, the candle must engulf the range of the previous bullish candle.
✅The formation of the "Bullish engulfing" candle says that buyers have sat on the throne, and "Bearish" - sellers. Let's discuss the theoretical foundations of the pattern. In the case of the "bullish engulfing" pattern, everything will be the same, just the opposite.
Rules for the formation of the "bearish engulfing" pattern:
There should be a bullish trend in the market, and the price should be on a key level.
❗️A long-bodied bullish candle appears (that is, directed towards the trend). The opening of the second candle should be carried out with a gap relative to the closing of the first, and its body should be larger than that of the previous one. It seems to engulf the trend with its dimensions, and therefore it is necessary to sell (a bearish candle indicates the beginning of a downward trend).
❤️ Please, support our work with like & comment! ❤️

What are candlesticks in trading and how to use them?🕯
✅The price dynamics of an asset are displayed on the chart in different formats, including bars, lines, or candles. The latter format is most popular among traders and is often used in technical market analysis. What are candles and how to work with them?
🟢Candlesticks (Japanese candlesticks) are a graphical way of displaying price dynamics, in which vertical rectangles and lines are used. This method was invented on the rice exchanges of Japan in the 17th century, from where it got its name.
A price candle consists of two main elements:
1️⃣the body is a vertical rectangle that shows the opening and closing levels of trades;
2️⃣wicks (shadows, tails) - vertical lines from above and below the body of the candle, reflecting fluctuations in value in the interval between opening and closing.
❗️The main advantage of a candle over bars and a linear chart is that it allows you to get 4 important indicators for technical analysis at once:
High - the highest price for the period;
Low - the lowest price for the period;
Open - the opening price of the period;
Close - the closing price of the period.
🔴When using a linear graph to get the same information, 4 indicators would have to be displayed on the screen at once, which is inconvenient and complicates the perception of information.
At the same time, candles display the process of cost formation in a specific time interval, so the position and appearance of candles on the hourly and daily periods will differ significantly
Types of candles
⚠️Two main types of candlesticks correspond to market trends:
Bullish candle - formed when the closing price of the period was higher than the opening price. On the chart, such a candle is displayed in green (on b / w - white) and indicates the victory of buyers in this time.
A bearish candle - is formed if the period is closed at a price lower than it was opened. On the chart, bearish candlesticks have a red color (on b / w - black) and they show that sellers are dominating at the moment.
❤️ Please, support our work with like & comment! ❤️

CANDLESTICK PATTERNS BASICS | Engulfing Candle 📚
Hey traders,
In this educational post, I want to discuss with you one of the most accurate REVERSAL candlestick patterns - the engulfing candle.
On EURUSD chart, I spotted for you bullish & bearish examples of this pattern.
The logic behind this pattern is quite simple:
⭐️In a bullish trend, after a strong directional movement, the price reaches some important structure level. Growing steadily and forming a sequence of green bullish candles the price suddenly forms a strong bearish candle.
What is particular about that candle is the fact that its total range (distance from the wick high to wick low) & body range (distance from body open to body close) exceed the ranges of a previous bullish candle.
🔻Such a candle we will call a bearish engulfing candle.
Most of the time it signifies a strong spike in selling volumes and willingness of sellers to push.
With a high probability, such a formation leads to a pullback or even a trend reversal.
⭐️In a bearish trend, after a strong short rally, the price reaches some demand cluster. Instead of breaking that and going lower, the price forms a strong bullish candle.
That candle engulfs the range of the previous bearish candle & its body size exceeds the size of the previous candle.
🟢Such a candle we will call a bullish engulfing candle.
Quite often such a formation leads to a pullback or even a trend reversal.
🔔And there is just one single tip that will dramatically increase your performance trading the engulfing candle:
It is recommended to rely on this pattern ONLY IF it is formed on a key level:
❗️Bullish engulfing candle must strictly form on a strong support.
❗️Bearish engulfing candle must strictly form on a strong resistance.
Forming beyond key levels, the pattern occasionally will give false signals.
⏳Preferable time frames to trade engulfing candles are daily/4h.
Learn to spot this pattern & you will see how efficient it is.
What candlestick patterns do you want to learn in the next posts?
❤️Please, support this post with like and comment!❤️

How To Trade Support Resistance Levels with Price Action Signal Wait for a Price Action Signal to form at the following support resistance levels.
EMA 10 Level
EMA 20 Level
Fibonacci Level
Horizontal Level
Set Target at the next support resistance level. Set Stop Loss Below EMA 20 Price and Low Price of Price Action Signal Candlestick. Enter at close price of Price Action Candlestick.
Engulfing Candlestick at Support Resistance Levels

Candlestick patterns every beginners should know . ( part 2 )Hi friends ,
today i'll share with you the most famous
candlestick pattern everyone should know. part2
bullich engulfing and bullish harami appear in the downtrend , It indicates the possibility of a price reversal ( long )
bearich engulfing and bearich harami appear in the uptrend , It indicates the possibility of a price reversal ( short)

The Best & Most Reliable Candlestick Patterns To UseIn this video I explain my favourite candlestick patterns and how to use them in your own trading.
Here we describe:
Engulfing Candles
Doji Candles
Hammer Candles
And I explain how to use them with confluence & context of where on the chart they occur.
