How to Use Moving Averages in TradingViewMaster moving averages using TradingView's charting tools in this comprehensive tutorial from Optimus Futures.
Moving averages are among the most versatile technical analysis tools available, helping traders analyze trends, identify overbought/oversold conditions, and create tradeable support and resistance levels.
What You'll Learn:
Understanding moving averages: lagging indicators with multiple applications
Simple moving average basics: calculating price averages over set periods
Key configuration choices: lookback periods, price inputs, and timeframes
How to select optimal lookback periods (like 200-day) for different trading styles
Using different price inputs: close, open, high, or low prices
Applying moving averages across all timeframes from daily to 5-minute charts
Analyzing price relative to moving averages for trend identification
Using 50-day and 200-day moving averages for trend analysis on E-Mini S&P 500
Mean reversion trading: how price tends to return to moving averages
Trend direction analysis using moving average slopes
Famous crossover signals: "Death Cross" and "Golden Cross" explained
Trading moving averages as dynamic support and resistance levels
Advanced moving average types: weighted and exponential moving averages
Applying moving averages to other indicators like MACD and Stochastics
Balancing sensitivity vs. noise when choosing periods
This tutorial may benefit futures traders, swing traders, and technical analysts who want to incorporate moving averages into their trading strategies.
The concepts covered could help you identify trend direction, potential reversal points, and dynamic trading levels across multiple timeframes.
Learn more about futures trading with TradingView:
optimusfutures.com
Disclaimer:
There is a substantial risk of loss in futures trading. Past performance is not indicative of future results. Please trade only with risk capital. We are not responsible for any third-party links, comments, or content shared on TradingView. Any opinions, links, or messages posted by users on TradingView do not represent our views or recommendations. Please exercise your own judgment and due diligence when engaging with any external content or user commentary.
This video represents the opinion of Optimus Futures and is intended for educational purposes only. Chart interpretations are presented solely to illustrate objective technical concepts and should not be viewed as predictive of future market behavior. In our opinion, charts are analytical tools—not forecasting
Exponentialmovingaverage

How Can You Use a Break and Retest Strategy in Trading?How Can You Use a Break and Retest Strategy in Trading?
Trading strategies help traders navigate the financial markets with greater confidence. One such approach is the break and retest strategy, which focuses on key support and resistance levels. This article explores the break and retest strategy in detail, providing insights and practical examples to help traders apply it in their trading activities.
Understanding the Break and Retest Strategy
The break and retest strategy is popular among traders who aim to capitalise on clear market movements. At its core, this strategy revolves around identifying key support and resistance levels on a price chart.
Here’s how it works: When the price breaks through a support or resistance level, it signals a potential shift in market sentiment. For example, if a stock breaks above a resistance level, it suggests increasing buying interest. Traders then watch for the price to return to this newly broken level—known as a retest in trading. During the retest, the former resistance now acts as support, providing a potentially more attractive entry point for traders looking to join the trend.
This strategy aligns well with trending markets, where prices move consistently in one direction. It allows traders to take advantage of momentum while managing their entries potentially more effectively.
The Mechanics of Break and Retest Trading
Implementing the break and retest strategy involves a clear sequence of steps that traders follow to identify and act on potential market moves. Here’s a breakdown of how this strategy typically operates:
1. Identifying Key Levels
Traders begin by pinpointing significant support and resistance levels on their charts. Accurate identification is crucial, as these levels form the foundation of the strategy.
2. Monitoring for a Breakout
Once the key levels are established, traders watch for the price to break through one of these barriers, in line with a broader trend. A breakout occurs when the price moves decisively above resistance or below support, often accompanied by increased trading volume. This surge in volume indicates stronger market interest and can validate the breakout’s legitimacy.
3. Waiting for the Retest
After the breakout, the price typically retraces to test the broken level. For instance, if the price breaks above a resistance level, it may pull back to that same level, which now acts as support. This retest phase is critical as it offers a second confirmation of the breakout’s strength.
4. Confirming the Retest
During the retest, traders look for confirmation signals to ensure the breakout is genuine. These signals can include specific candlestick patterns, such as pin bars or engulfing candles, and continued high trading volume. Successful confirmation suggests that the new support or resistance level will hold, increasing the likelihood of a sustained trend.
5. Entering the Trade
With confirmation in place, traders often enter the market, aiming to ride the new trend. They may set stop-loss orders slightly below the new support (in the case of a breakout to the upside) or the new resistance (in case of a breakout to the downside) to manage potential risks.
6. Managing the Trade
Effective trade management involves setting target levels based on previous price action and adjusting stop-loss orders as the trade progresses. This helps to lock in potential returns and potentially protect against unexpected market reversals.
Break and Retest Example Strategy
Consider this EURUSD 15-minute chart, which displays a clear bearish trend. This trend is highlighted by the 50-period Exponential Moving Average (EMA) sloping downward, with the price generally staying below it. Recently, the price broke below a key support level on higher-than-average volume, signalling a potential opportunity for traders to apply the break and retest strategy.
In this scenario, there are two support levels to monitor. The first is a more significant support level. Trading at this level can allow traders to enter the market quickly, though it comes with a less favourable risk-reward ratio.
The second support level is found within the recent brief retracement. This level offers a better risk-reward ratio, but there's a chance the price may not retrace deeply enough, potentially causing traders to miss the trade.
The entry point is identified by a candle with a wick longer than its body (a pin-bar on the 30m chart), indicating rejection of higher prices as the market retests the second broken support level. Once this candle closes, traders can enter a market order.
Stop losses would typically be placed either above the last major swing high or above the 50-period EMA, depending on individual risk tolerance. Take-profit targets could be set at a 1:3 risk-reward ratio or at the next significant support level, where a price reversal may be anticipated.
Improving the Break and Retest Strategy
Enhancing the break and retest strategy involves integrating additional tools and techniques to refine trade decisions. Here are several methods to consider:
1. Incorporating Additional Indicators
Using break and retest indicators like the Relative Strength Index (RSI) or the Moving Average Convergence Divergence (MACD) can provide valuable insights. For instance, an RSI crossing below 70 during a bearish breakout may indicate weakening momentum, supporting the retest. Similarly, the MACD crossing above its signal line or the MACD histogram rising above 0 can confirm the uptrend’s strength, aiding in more precise entry points.
Explore these indicators and more than 1,200+ trading tools in FXOpen’s free TickTrader trading platform.
2. Multi-Timeframe Analysis
Examining charts across different timeframes helps in gaining a broader market perspective. A breakout observed on a 4-hour chart gains additional confirmation when a strong trend is also visible on a daily chart. This alignment across timeframes increases the reliability of the trade setup.
3. Utilising Fibonacci Retracements
After a breakout, prices often retrace deeper into the previous high-low range—not always to the most extreme point. Applying Fibonacci retracements to the high/low of the breakout (high in a bearish breakout and low in a bullish scenario) and the new low or high can help identify optimal retest points, particularly at the 38.2%, 50%, and 61.8% levels. These levels typically offer better risk-reward ratios compared to the extreme points.
4. Incorporating Fundamental Analysis
Supporting technical breakouts with fundamental factors, such as economic reports or news events, strengthens the strategy. For example, a breakout aligned with positive economic data may have a higher probability of sustaining the new trend, providing traders with greater confidence in their decisions.
Advantages of the Break and Retest Strategy
The break and retest strategy offers several advantages that can enhance a trader’s approach to the markets:
- Increased Confidence through Confirmation: The retest serves as an additional validation of the breakout, boosting trader confidence in their entry decision and reducing hesitation.
- Better Risk Management: Setting stop-loss orders based on the retest level provides a clear risk boundary. This structured approach aids in potentially managing losses.
- Alignment with Market Trends: This strategy naturally aligns trades with the prevailing market trend. By trading in the direction of the breakout, traders can take advantage of sustained movements.
- Versatility Across Markets: The breakout and retest strategy can be applied to various financial instruments, including forex, stocks, and commodities. Its adaptability makes it a valuable tool in diverse trading environments.
- Scalability and Flexibility: This strategy can be adapted to different timeframes and trading styles, making it suitable for both short-term and long-term traders seeking to implement a consistent approach.
Potential Challenges and Considerations
While the break and retest strategy can be a powerful tool, traders may face several challenges when implementing it:
- False Breakouts: Not every breakout leads to a sustained trend. Sometimes, the price moves beyond a support or resistance level only to reverse shortly after. Recognising these false signals is crucial to avoid entering trades that may quickly turn against expectations.
- Market Conditions: According to theory, this strategy performs best in trending markets. In sideways or highly volatile environments, breakouts can be less reliable, making it harder to distinguish genuine opportunities from random price movements.
- Timing the Retest: Accurately determining when the price will retest the broken level can be challenging. Entering too early may expose traders to unnecessary risk, while waiting too long might result in missed opportunities if the retest doesn't occur as anticipated.
- Reliance on Confirmation Signals: While additional indicators like RSI or MACD can enhance the strategy, over-reliance on these tools can complicate decision-making. Traders need to balance multiple signals without becoming overwhelmed or confused.
- Emotional Discipline: Maintaining discipline during retests is essential. Traders might feel pressured to act quickly if the market moves unexpectedly, leading to impulsive decisions that deviate from their trading plan.
The Bottom Line
The break and retest strategy offers a structured approach to navigating market movements, combining precise entry points with effective risk management. By understanding and applying this method, traders can potentially enhance their trading decisions and align with prevailing trends. To put this strategy into practice across more than 700 markets, consider opening an FXOpen account and gain access to four advanced trading platforms, low trading costs, and rapid execution speeds.
FAQ
What Is a Retest in Trading?
A retest occurs when the price returns to a broken support or resistance level after an initial breakout. It serves to confirm the strength of the breakout, helping traders decide whether the new trend will continue or if the breakout was false.
What Is the Break and Retest Strategy?
The break and retest strategy involves identifying a breakout of a key support or resistance level and then waiting for the price to return to that level. Traders use this retest as a confirmation to enter the market, aiming to follow the new trend with reduced risk.
What Is the Win Rate of the Break and Retest Strategy?
The win rate of the break and retest strategy varies depending on market conditions and how the strategy is applied. Consistent application and effective risk management are crucial for achieving better results.
How Many Times Should I Backtest My Strategy?
Backtesting should be done extensively across different market conditions and timeframes. According to theory, traders need to test a strategy on at least 100 trades to ensure its reliability and to understand how it performs in various scenarios.
Does the Market Always Retest?
No, the market does not always retest broken levels. While retests are common, they are not guaranteed. Traders should use additional confirmation signals and be prepared for both possibilities when applying the break and retest strategy.
This article represents the opinion of the Companies operating under the FXOpen brand only. It is not to be construed as an offer, solicitation, or recommendation with respect to products and services provided by the Companies operating under the FXOpen brand, nor is it to be considered financial advice.

📊 The 3 EMA Crossover StrategyThe 3 EMA (Exponential Moving Average) strategy is a popular trading strategy that uses three exponential moving averages of different time periods to identify potential buying and selling opportunities in the market. The three EMAs used in this strategy are the 10 EMA, 25 EMA, and 50 EMA.
🔹What is an EMA Crossover?
An EMA crossover occurs when two different EMA lines cross one another. The crossover doesn't predict future trends, but rather shows the ongoing direction of a trend. That being said, the crossover might actually give a signal that a trend could be ending and will soon be replaced by a new trend.
🔹Why Use 3 EMAs Together?
The three EMAs can give stronger confirmation than just two EMAs crossover. It can also give a better context to the price action in relation to the three EMA lines displayed on the chart. Three EMAs crossing above the price at the same time is a strong bullish signal, while three EMA crossing below the price at the same time is a strong bearish signal.
The crossover of the 10 EMA above the 25 EMA and the 25 EMA above the 50 EMA is used to identify a long position opportunity.
This is known as a bullish crossover, indicating that the trend is shifting from bearish to bullish.
When the 10 EMA crosses above the 25 EMA, it suggests that the short-term trend is beginning to turn bullish, and when the 25 EMA crosses above the 50 EMA, it suggests that the long-term trend is also becoming bullish.
This combination of short-term and long-term trends shifting in a bullish direction can be a powerful signal for traders to enter a long position.
👤 @AlgoBuddy
📅 Daily Ideas about market update, psychology & indicators
❤️ If you appreciate our work, please like, comment and follow ❤️

📊Moving Average(MA): Use Cases📍 What Is a Moving Average (MA)?
A Moving Average (MA) is a popular technical analysis tool used in finance to indicate the stock's average price over a certain time frame. Its purpose is to reduce price volatility by creating a continually updated average price based on the stock's historical data.
The computation of a moving average helps to minimize the influence of unpredictable and short-term price fluctuations on a stock over a designated period. Two types of moving averages are commonly used: simple moving averages (SMAs) that employ a straightforward arithmetic mean of prices over a particular timeframe, and exponential moving averages (EMAs) that prioritize recent prices over older ones by assigning them greater weight.
📍 Simple Moving Average(SMA)
A simple moving average (SMA) is a technical indicator that calculates the average of a range of prices over a specific number of time periods. It can help determine if an asset price will continue or reverse a bull or bear trend. It is an arithmetic moving average, calculated by adding recent prices and dividing by the number of time periods in the calculation. SMAs can be short-term or long-term, with short-term averages responding quickly to price changes and long-term averages being slower. Other types of moving averages include exponential moving averages (EMAs) and weighted moving averages (WMAs).
📍 What Is an Exponential Moving Average (EMA)?
The exponential moving average (EMA) is a moving average (MA) technique that assigns more weight to the most recent data points. It is also known as the exponentially weighted moving average. Compared to a simple moving average (SMA) that gives equal weight to all data points in the period, an EMA reacts more strongly to recent price changes.
👤 @AlgoBuddy
📅 Daily Ideas about market update, psychology & indicators
❤️ If you appreciate our work, please like, comment and follow ❤️

What if RSI and EMA produce similar results?█ What if RSI and EMA produce similar results?
In the world of trading , technical indicators play a crucial role in making informed decisions. One such indicator is the Relative Strength Index (RSI), and another is the Exponential Moving Average (EMA). Both of these indicators have been widely used by traders to analyze market trends and make predictions about future price movements. However, it has long been a topic of debate among traders as to which of these two indicators is better.
█ What if RSI and EMA produce similar results?
We wanted to determine the relationship* between the RSI and the EMA, specifically examining the hypothesis that when the RSI crosses above the value of 50, it returns similar results as when the price crosses above a certain length of an EMA. Similarly, when the RSI crosses below the value of 50, it returns similar results as when the price crosses below a certain length of an EMA. Our goal was to determine whether the RSI and EMA were related* in any way.
█ Our Simulations
We designed a series of simulations to compare the accuracy of the RSI and EMA in predicting market trends. The simulations were designed to test the assumption that the RSI and EMA were equal* in terms of accuracy in predicting price movements.
█ Our definition of "predict price movements."
If RSI crosses above the value of 50, there is a higher likelihood of a bullish move. If RSI crosses below the value of 50, there is a higher likelihood of a bearish move.
█ Our assumption for this study
When the RSI crosses above the value 50, it is equal* to when the price crosses above a certain EMA length, and when the RSI crosses below the value 50, it is equal* to when the price crosses below a certain EMA length. This assumption had never been tested until our team decided to put it to the test.
█ Results
To our surprise, we found a strong relationship* between the RSI and the EMA. We discovered that when the RSI crosses above the value of 50, it returns similar* results as when the price crosses above a certain length of an EMA. Conversely, when the RSI crosses below the value of 50, it returns similar* results as when the price crosses below a certain length of an EMA.
The assumption was accurate and that the correlation* between the RSI and EMA was 1, indicating that the results of both indicators were highly consistent. This means that there is an EMA length that performs exactly* the same as the RSI in terms of predicting market trends.
Validity Checks
We stored crossover values for both RSI and EMA in 2 different arrays, and by running the following tests, we could conclude our findings.
Correlation Check
The correlation between RSI and EMA provides insights into the relationship between the two arrays.
Array Size Checks
The "diff" tells us how different the sizes of the two arrays are. If the size of both arrays is the same, "diff" would be 0, indicating that the two arrays have the same number of elements.
Percentage Check
The percentage difference between RSI and EMA is a measure of the similarity between the two arrays. A percentage difference of 0 indicates that the two arrays are the same size, while a higher percentage difference indicates that the two arrays are different in size.
Ratio Check
The ratio represents the relationship between the two arrays, in terms of the sum of their elements. If the ratio is equal to 1, it means that the sum of the elements in the two arrays is the same. The higher the ratio, the more the elements in RSIa are relative to the elements in EMA. The lower the ratio, the less the elements in RSI are relative to the elements in EMA.
█ What is the exact relationship between the two indicators?
After further testing and analysis, we discovered that the length of the EMA that returns results similar* to the RSI is given by the formula: "2* RSI Period - 1". This formula provides traders with a clear, scientific method for determining the length of an EMA that will return results similar* to the RSI.
█ What does it mean for Traders?
The study has provided valuable insights into the accuracy of RSI and EMA. It has shown that both indicators are approximately equal in terms of accuracy and that traders can use either one without having to sacrifice accuracy. This means that traders can choose RSI or EMA, depending on their personal preferences and trading style.
█ Conclusion
Our study has shown that when the RSI crosses above the value of 50, it returns similar* results as when the price crosses above a certain length of an EMA. Similarly, when the RSI crosses below the value of 50, it returns similar* results as when the price crosses below a certain length of an EMA. Furthermore, we have discovered the exact* relationship between the RSI and EMA, given by the formula "2 * RSI Period - 1". These findings provide valuable insights for traders and demonstrate the potential for data-driven approaches in trading.
We showed that the RSI and EMA were highly correlated*, indicating that the results of both indicators were highly consistent*. This knowledge can save traders time and effort, as they can use one indicator to validate the results of the other.
-----------------
Disclaimer
*Our results are approximate. We encourage you to test the assumption yourself. We do not guarantee that you will get the same results. This is an educational study for entertainment purposes only. The findings/results may or may not be true.
The information contained in my Scripts/Indicators/Ideas/Algos/Systems does not constitute financial advice or a solicitation to buy or sell any securities of any type. I will not accept liability for any loss or damage, including without limitation any loss of profit, which may arise directly or indirectly from the use of or reliance on such information.
All investments involve risk, and the past performance of a security, industry, sector, market, financial product, trading strategy, backtest, or individual's trading does not guarantee future results or returns. Investors are fully responsible for any investment decisions they make. Such decisions should be based solely on an evaluation of their financial circumstances, investment objectives, risk tolerance, and liquidity needs.
My Scripts/Indicators/Ideas/Algos/Systems are only for educational purposes!

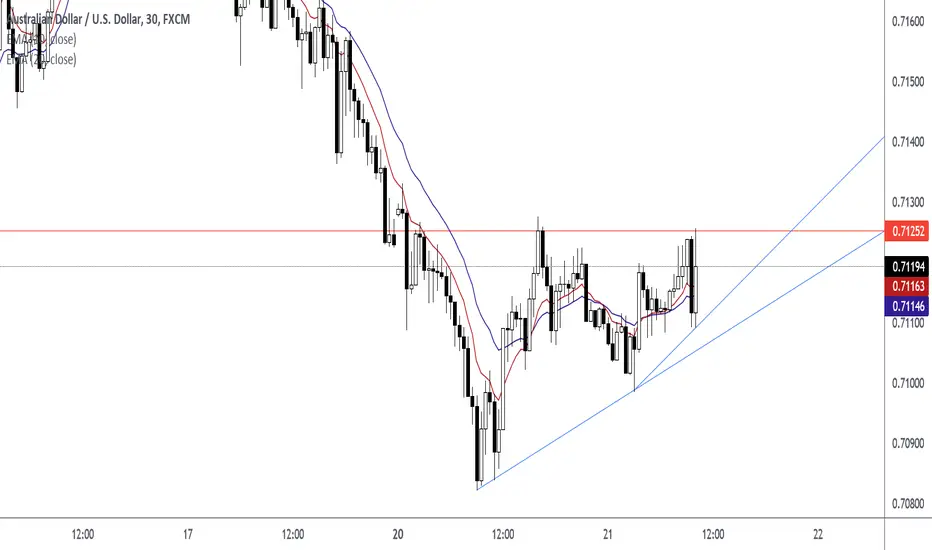
How To Trade The Ascending Triangle Before The BreakoutHow I Trade The Ascending Triangle
Engulfing Candle (Price Action Signal)
First Entry at 0.71194
Candlestick Closed Above Level
Second Entry at 0.71273
Retest Candlestick and Rejection Candlestick at 0.71295
Third Entry
Trade Pull Backs To The Trend Line And MeanEnter at 161.89
Exit at 170.29
Stop Loss at 159.00
EMA 10 Close Price: 162.57
EMA 20 Close Price: 161.01
Close Price: 161.89
Trend Line Price: 159.00

My Strategy Works On All Markets and All Time FramesPrice closed above EMA 20, EMA 10, Horizontal Support Resistance, and Trend Line. A pin bar formed on the retest and the pin bar candlestick wick protruded through the support levels. The support levels are EMA 20, EMA 10, Horizontal Support Resistance, and Trend Line.
In this example, there are three higher lows moving into a diagonal resistance level and a horizontal resistance level. Price broke through those two levels and retested those levels with a pin bar. After the break and close above the horizontal and diagonal level; those levels became support.
Entry is the closing price of the pin bar. Target price is the previous swing high.

How To Set Stop Losses And Take Profits using EMA StrategyWait for price to break and close below a level. In this example, price closed below support level and turned resistance. Next, wait for price to retest level as new resistance. The retest in this example formed a candlestick that created a wick which protruded through Horizontal Resistance Level, EMA 20 Resistance Level, and Diagonal Trend Resistance Level.
For short trade opportunity, set stop loss above EMA 20 Price Level and Rejection Candlestick High Price. Set take profit at previous swing low.

How To Enter A Pullback In A Trend
Enter when these confluence factors are present. There is a Trend, Level, and Signal.
Trend:
Up
Confluence Factors at the Support Resistance Level:
Close Price 96.31
EMA 10 Close Price 96.24
50% Fibonacci Retracement Price 96.15
Horizontal Support Price 95.99
EMA 20 Close Price 95.31
Signal:
Rejection Candlestick

A Deep Dive Into Moving AveragesMoving averages are inherent in the world of technical analysis and are present in the core calculations of many technical indicators. In this post, we take a deep dive into 3 types of moving averages used every day by traders: the Simple Moving Average (SMA), Exponential Moving Average (EMA) and the Weighted Moving Average (WMA).
The topics covered below can have practical applications while others are solely informative.
1. Introduction
Moving averages are trend indicators commonly used to smooth the closing prices by removing or attenuating certain variations and are able to estimate underlying trends. Their usage can be recorded as early as 1829 by John Finlaison for smoothing mortality rates (1).
In technical analysis moving averages are often essential for traders and can be found in every technical analysis software. However, they are not specific to this field as they often appear in Time Series Analysis and Digital Signal Processing (DSP).
Moving averages possess a single user setting that generally determines the degree of smoothness. This setting is often referred to as the moving average "length", "period" or less commonly "window size".
2. Curiosities About The Simple Moving Average
The Simple Moving Average abbreviated to "SMA", also known as the "Arithmetic Moving Average" or "Moving/Rolling Mean/Average" is certainly the most well-known moving average due to its simplicity and numerous applications in other domains. The SMA with period length is commonly calculated as follows:
SMA = (SUM C )/length, for i = 0 to length-1
= (C + C + ... + C )/length
Here all the weights w would be equal to 1/length (which is why we often state that a SMA has uniform weights).
2.1 Relationship With The Momentum Oscillator
Changes in a simple moving average with period length are equal to a momentum oscillator of the same period divided by length , that is:
SMA - SMA = (C - C )/length
This can be explained from the calculations of the changes in a Simple Moving Average:
change(SMA ) = SMA - SMA
= (C + C + ... + C )/length - (C + C + ... + C )/length
= (C - C )/length
The closing prices with the same lag cancel each other out, leaving only C(t) and C(t-length) divided by length in the final calculation.
As such you could tell whether a moving average of period length is rising or declining by simply comparing the current closing price to the closing price length bars ago. If the current closing price is higher; then the moving average is rising, else it is declining.
This relationship allows us to efficiently compute the SMA, allowing us to obtain a computation time independent of the moving average period which is very important for real-time high-frequency applications of the SMA.
2.2 Lag Of The SMA
Lag is defined as the effect moving averages have to return past price variations instead of new ones. For most moving averages this amount of lag can be quantified as the weighted sum between the moving average weights w(i) and the time lag associated with them. Higher weights given to more recent values would return a moving average with less lag.
All the weights of a simple moving average are equal to 1/length . The lag of a Simple Moving Average is thus given by:
Lag = SUM(1/length × i), for i = 1 to length-1
= 1/length + 1/length × 2 + ... + 1/length × (length-1)
= (length-1)/2
As such, the lag (in bars) of a Simple Moving Average is equal to its period minus 1, divided by 2.
Offsetting an SMA Lag bars in the past allows us to have it centered with the price.
2.3 Cascaded SMA's
Using an SMA as input for another SMA would return a smoother output; this process is known as cascading. In the case of the Simple Moving Average, cascading many SMAs of the same period would converge toward a Gaussian function.
The Irwin–Hall Probability Density Function can describe the result of cascading multiple SMAs using an impulse as input.
3. Curiosities About The Exponential Moving Average
The Exponential Moving Average; abbreviated as "EMA", also known as an "Exponentially Weighted Moving Average" or "Exponential Average" is a recursive moving average. That is, it uses a previous output for its computation.
This moving average is slightly more reactive than the Simple Moving Average due to its lower degree of filtering.
An EMA of period length is calculated as follows:
EMA = a × C + (1-a) × EMA
or:
EMA = EMA + a × (C - EMA )
with smoothing constant a = 2/(length+1) .
3.1 Traders Prefer The EMA Over The SMA
The trading community seems to have developed a preference for the EMA over the SMA. This might be explained by the superior reactivity of the EMA over the SMA.
The EMA is also more commonly used in the creation of technical indicators, sometimes for its superior reactivity, its computational efficiency, or sometimes simply by preference.
Several studies attempted to indicate which moving average (between the EMA and SMA) provided better performances. The conclusion can vary depending on the markets and methodology used. Dzikevičius & Šaranda found superior results of the EMA over the SMA (2), while Predipbhai found better results from an EMA-based MACD over an SMA-based one (3).
3.2 The EMA Helps Avoiding Division By Zero
In scenarios where we are required to perform a division with a moving average applied to a denominator, the EMA can help to avoid division by 0 as long as the smoothing factor is lower than 1 (EMA period superior to 1)
For a < 1, the EMA has an exponentially decaying infinite impulse response. The impulse response converges towards 0 but never reaches it.
This can be useful if we want to obtain the ratio between the average upward variations and average downward variations. In the event where there is a significant number of upward variations, an SMA of the downward variations might eventually be equal to 0; the EMA prevents this.
3.3 The EMA Has The Same Lag As An SMA
We previously mentioned that the EMA is more reactive than the SMA, but quantifying the lag of an EMA from the weighted sum between the EMA weights and their associated lag gives the same results as the lag of an SMA.
The weights of an EMA can be obtained from its impulse response, which is described as:
h = a × (1-a)^n, n ∈
The lag is then calculated as follows:
Lag = SUM i × (a × (1-a)^i), for i = 0 to infinity
= (1 - a)/a
= (1 - 2/(length+1))/(2/(length+1))
= 2/(length+1)
4. Curiosities About The Weighted Moving Average
The Weighted Moving Average; abbreviated as "WMA", also known as a Linearly Weighted Moving Average (LWMA), is the most reactive moving average when compared to the SMA and EMA. The WMA uses linearly decaying weights for its calculations, giving higher weights to more recent prices.
The WMA can be calculated as follows:
WMA = (SUM (length-i) × C )/(length*(length+1)/2), for i = 0 to length-1
4.1 Relationship With The SMA
It's interesting to observe how certain moving averages are related to each other. In the case of the WMA and SMA, the change of a WMA of period length can be given by the difference between the price and an SMA offset by 1 bar, divided by (length+1)/2 .
This equality is described as follows:
change(WMA ) = (1 - SMA )/((length+1)/2)
This also shows that the changes in a WMA with a period length-1 can indicate if the price is above or below an SMA of period length .
Like with the SMA, this relationship allows the calculation of the WMA efficiently allowing us to obtain a computation time independent of the moving average period.
4.2 Relationship With The Linear Regression
It can seem extremely surprising, but it is indeed possible to compute a simple Linear Regression of the price using linear combinations between a WMA and an SMA (under certain conditions).
The first point of a simple Linear Regression with coordinates (X1,Y1) fitted through the most recent length price observations can be obtained as follows:
X1 = t - length + 1
Y1 = 4 × WMA - 3 × SMA
While the last point with coordinates (X2,Y2) is given by:
X2 = t
Y2 = 3 × WMA - 2 × SMA
The periods of the WMA and SMA are both equal to length . Drawing a line using the above coordinates would return the simple Linear Regression fitted to the most recent length price observations. The slope of the linear regression is equal to:
m = ((3 × WMA - 2 × SMA ) - (4 × SMA - 3 × WMA ))/(length-1)
= 6*(WMA - SMA )/(length-1)
References
(1) Hoem, J. M. (1984). A contribution to the statistical theory of linear graduation. Insurance: Mathematics and Economics, 3(1), 1-17.
(2) Dzikevičius, A., & Šaranda, S. (2010). EMA Versus SMA usage to forecast stock markets: the case of S&P 500 and OMX Baltic Benchmark. Business: Theory and Practice, 11(3), 248-255.
(3) Predipbhai, N. P. (2013). Comparison between exponential moving average based MACD with simple moving average based MACD of technical analysis. International Journal of Scientific Research, 2(12), 189-197.

How To Find The Best Trend Line Break and RetestWait For Price To Break Trend Line. Wait For Price To Close Below Trend Line.
Watch For A Price Action Signal To Form On The Retest. Watch For A Rejection Candlestick or a Pin Bar. In the example below, the candlestick wick protrudes through EMA 10, EMA 20, Trend Line, and 50% Fibonacci Retracement Level.
Enter at the close price of rejection candlestick. Close Price is 188.13 in this example.
Note: The best trend lines has 4 or more touches.

How To Trade Support Resistance Levels with Price Action Signal Wait for a Price Action Signal to form at the following support resistance levels.
EMA 10 Level
EMA 20 Level
Fibonacci Level
Horizontal Level
Set Target at the next support resistance level. Set Stop Loss Below EMA 20 Price and Low Price of Price Action Signal Candlestick. Enter at close price of Price Action Candlestick.
Engulfing Candlestick at Support Resistance Levels

How To Trade Support Resistance Levels
Price closed above EMA 10, EMA 20, Trend Line, and Horizontal Support & Resistance Level. Enter at close price of rejection candlestick. Close price of rejection candlestick is 0.73150. Set Stop Loss below EMA 20 Close Price and Low Price. Set Target at next support resistance level.
Support and Resistance Levels are:
EMA 10
EMA 20
Horizontal Line
Diagonal Line
High Price 0.73195
Close Price 0.73150
Open Price 0.73046
EMA 20 Price 0.72939
Low Price 0.72921
Close Price 0.73150
EMA 10 Close Price 0.73045
EMA 20 Close Price 0.72939

How To Trade Pin Bar at the EMA 10, EMA 20, Trend Line, and GapThe confluence is:
1) Gap at 267.76
2) Trend Line
3) EMA 10
4) EMA 20
5) Pin Bar
Entry is at the closing price of the candlestick in the form of a Pin Bar. Pin Bar formed at EMA 10, EMA 20, Trend Line, and Gap.

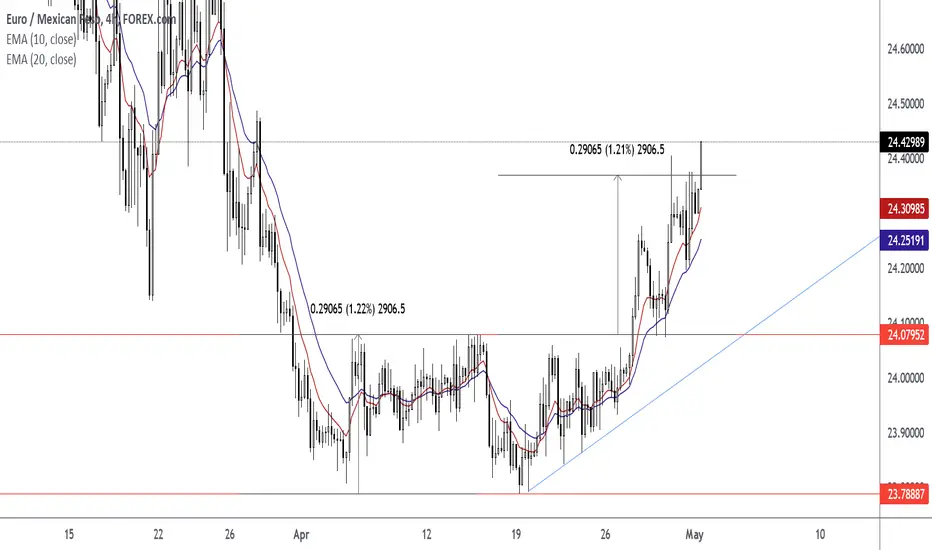
How To Trade The Ascending Triangle + Double Bottom ComboWait For The Close Above the Neckline at Horizontal Level 24.07952. After the close above level; resistance level turned support.
Wait For The Retest Of The Neckline At 24.07952. Watch For A Pin Bar or Rejection Candlestick to form at the horizontal neckline.
Enter Trade At The Closing Price Of Pin Bar or Rejection Candlestick.
Set Target Price Using Measured Objective Of Pattern. Measured Objective Is 24.37017. Measured Move Is 2906.5. Height Is 2906.5.
Exit Trade At Target Price.
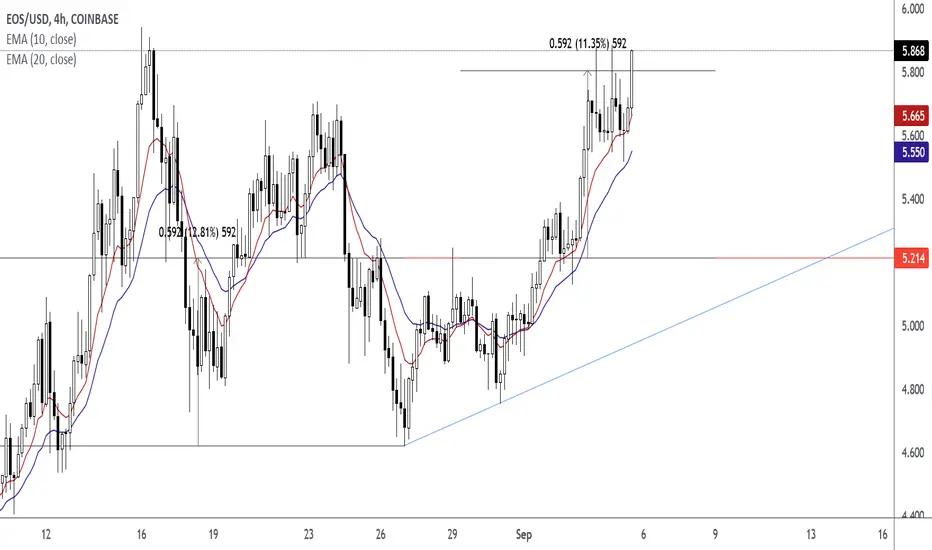
How To Trade The Ascending Triangle Trading The Ascending Triangle
Wait For The Close Above The Horizontal Level
Wait For The Retest in the form of a pin bar or rejection candlestick.
Enter At The Close Price of Pin Bar or Rejection Candlestick
Exit At The Measured Objective of Pattern. The Height of Pattern is 592.
How To Trade Quality Pin BarsAfter the Pin Bar Formed At The EMA 10 EMA 20, Do The Following Actions
Draw Your Fibonacci Retracement Levels
Draw Horizontal Support Levels
Enter At Pin Bar Close Price
Exit At The Previous Swing Low Level
The attributes that made this a quality Pin Bar:
Pin Bar Close Price is in the Fibonacci Retracement 50% and 38.2% Range Area
Pin Bar Close Price is in the EMA 10 EMA 20 Range Area
Pin Bar at Lower High
Downtrend
Technical Chart Of How To Trade The Pin Bar. Before and After Charts. Click on Charts.

How To Trade The Pin Bar With Support Resistance Levels 08-16-21This pin bar is in a pull back. The horizontal level was broken and the horizontal level was retested with a pin bar candlestick. In this case, the pin bar tail intersects the EMA 10 and horizontal support level. Price closed above the horizontal level. Entry for this strategy is at the pin bar close. The Target is the previous swing high.
DOGEUSD Target Price 0.16500000 Pin Bar DOGEUSD closed below 0.21380000 price level and retested that level in the form of a Pin Bar. Pin formed on the horizontal support resistance line and exponential moving average period 10 exponential moving average period 20.
Three factors for this trade strategy is Trend Level Signal. 1 Downtrend 2 Horizontal Level 3 Pin Bar.
The target is the previous swing low.

Using the Moving Average Convergence Divergence (MACD)MACD – What it is
The Moving Average Convergence Divergence (MACD) is the momentum indicator that shows the relationship between two different moving averages:
1. The 12 period exponential moving average – On Tradingview it is the Fast Length.
2. The 26 periods exponential moving average –On Tradingview it is the Slow Length.
The MACD line is calculated by subtracting the 26 period EMA from the 12 period EMA.
The Signal line is the 9 period exponential moving average.
These two lines are then plotted on top of each other. These are the two lines you see when you turn on the MACD indicator.
Additionally, there is a histogram that shows the distance between the two lines. Larger bars tell us that the MACD and Signal are further apart.
When it comes to candles, size matters. The larger the candle the more momentum the trend has.
The histogram will turn green when the MACD line is above 0 (bullish) and it will turn red when the MACD line is below 0 (bearish).
Very bearish momentum is shown above. Photo was taken May 23, 2021.
How to use the MACD
The most important thing to know about the MACD is how to read the relationship between the two lines.
I’ve found that the best timeframe to use the MACD with is daily. This is because the MACD is a lagging indicator and using daily data prevents a lot (not all) of false buy and sell signals.
These signals are:
• When the MACD line crosses above the signal line it is a buy signal
• When the MACD line crosses below the signal line it is a sell signal
Additionally, it is best to use the MACD in a trending market; a market with a clearly defined up or down trend.
Using the MACD with trend lines is a very powerful combination.
The reason for this is that if the market is moving sideways, you can see small fluctuations where the MACD and Signal Line cross but the price does not really go anywhere. These are false breakouts.
Therefore, these signals are not automatic buys and sells.
There are ways of confirming the indications from the MACD chart.
One way is a strategy that uses the RSI and MACD together (which is beyond the scope of this text, but I will discuss in my next article).
Another way is to use the MACD with the current trend. So, if you are in an uptrend and then you see a bullish cross, then this is confirmation that you are likely to go higher.
The same is true in reverse.
Also, please note that the cross over happens well after the price either stabilizes or rises. Again, this is because the MACD is a lagging indicator.
Leading Indicator?
Since the MACD and Signal lines are lagging indicators is there something that can be used in a predictive way?
Some traders use the histogram as a way to predict when a reversal will occur.
Since the MACD is a momentum indicator it can show us when sell pressure is alleviating. Meaning it might be a good time to buy.
This doesn’t always work of course, but with good risk management (stop losses) you can often get into a position well before its breakout.
Conversely, it can show you when your long position is running out of steam and can warn you when to get out.
MACD Divergence
Another useful way to use the MACD is to spot divergences.
A bullish divergence, very similar to the RSI, is when the short-term price trend is going down but, the MACD is going up.
Bearish divergence, also very similar to the RSI, is when the price trend is going up but, the MACD is going down.
Trading this way is sometimes not a good idea because you are trading against the trend. Please practice good risk management if you are trading reversals.
Also, notice the buy signal right before the sell signal that is circled. I really want to hammer home the point that the signals are not automatic buys and sells.
Price action is a great way to confirm the reversal (to the up or down side) of a trend. Because simply spotting a divergence does not guarantee the price will follow.
Final thoughts
As you can see there are different ways of successfully using the MACD. I hope I’ve made a few of these ways clear in this beginner guide.
Please let me know if you have any questions and if you like it, please hit the thumbs up and be sure to follow for more.
Links to my Fibonacci Retracement and RSI guides are below.
Thanks for reading!

Symmetrical Triangle Traded On AUDCHF Currency Pair (2021 April)AUDCHF Symmetrical Triangle. Target Price 0.70167.

Symmetrical Triangle Traded On EURCHF Currency Pair (2021APR29)Trading the Symmetrical Triangle on EURCHF Currency Pair using the H4 Chart. Wait for a close below diagonal support level. After the candlestick closed below the level, diagonal support turned resistance. Next, wait for price pull back to the resistance line for the retest. Watch for a pin bar or rejection candle to form. The ideal condition is to have a pin bar form on the retest of the diagonal resistance line. The pin bar will form on the EMA 10, EMA 20, and diagonal resistance line for perfect ideal condition.
Here are the three ways to enter.
Enter at closing price of the pin bar, break of the pin bar nose with a sell stop order, or 50% Fibonacci Retracement of the pin bar with a sell limit order.
Stop Loss is place 5-10 pips above the pin bar tail. Or stop loss is placed above the break out candle.
Take Profit is the first point of the trend line. In this case, the take profit level is 1.09756
Pin Bar is date 29 April 2021 time 16:00.
