Gann Pressure Dates – Understanding Market Time CyclesPrice is only one dimension of market behavior.
Time plays an equally important role in understanding market structure.
This idea is a conceptual and educational explanation of Gann Pressure Dates, a time-based principle introduced by W.D. Gann, which highlights periods when markets may experience increased activity, balance shifts, or momentum changes.
⏳ What Are Gann Pressure Dates?
Gann Pressure Dates are time-cycle reference points derived from:
Natural market rhythms
Calendar harmonics
Time symmetry principles
The Law of Vibration
Rather than predicting direction, these dates help traders observe when markets are statistically more sensitive to change.
📊 How Pressure Dates Are Used
Pressure dates are studied to:
Identify potential acceleration or deceleration phases
Observe trend continuation vs. exhaustion
Align time with existing price structure
Combine time cycles with support/resistance or geometric levels
They are observation tools, not trade signals.
🧠 Important Concept
Markets often move in rhythmic cycles, not random patterns.
Gann’s work emphasized that time cycles often precede price movement, making time analysis a powerful secondary confirmation tool.
📌 Educational Focus
This idea is shared to explain:
The role of time cycles in market analysis
How traders historically studied pressure dates
Why time-based analysis remains relevant even in modern markets
Disclaimer:
This content is shared strictly for educational and analytical purposes only. It does not constitute financial advice, forecasts, or trading recommendations.
Gann

Natural Time Cycle (NTC) & Gann Pressure Dates – March 2024 Markets often react not only to price levels, but also to time-based cycles.
This idea presents an educational case study of how Natural Time Cycle (NTC) dates, also known as Gann Pressure Dates, aligned with market behavior during March 2024.
⏳ Understanding Natural Time Cycle Dates
Natural Time Cycles are time reference points derived from:
Calendar harmonics
Market rhythm & symmetry
Gann’s Law of Vibration
Time–price relationship principles
These dates are not directional signals.
They are used to observe periods when market sensitivity often increases.
📅 March 2024 – Time Cycle Observations
The following Natural Time Cycle dates were studied for March 2024:
6 & 8 March → Since 8 March was a non-trading day, the nearest active session was observed
20 March → Regular trading session
23 & 24 March → Weekend dates, with the prior trading session observed
These adjustments follow standard time-cycle alignment practices used in historical Gann studies.
📊 Market Behaviour (Post-Event Observation)
After these time references:
Market structure showed a clear change in momentum
Volatility expanded near the observed dates
A notable shift in trend behaviour occurred later in April, aligning with time-cycle symmetry
This highlights how time often acts as a trigger, while price confirms the structure.
🧠 Why This Matters
W.D. Gann emphasized that:
“Time is the most important factor in determining market movements.”
Natural Time Cycles help traders:
Prepare mentally for potential changes
Avoid emotional decision-making
Combine time with price & structure, instead of relying on price alone
📌 Educational Note
This study is shared strictly to explain:
How time cycles are observed
How non-trading dates are adjusted
How time and price interact in real markets
Disclaimer:
This content is for educational and analytical purposes only.
It does not constitute financial advice, trade recommendations, or future predictions.

DABUR INDIA | Gann Square of 9 – 45° Reaction | 28 Mar 2022This idea presents a historical intraday case study demonstrating the application of WD Gann’s Square of 9 (Normal Case) to observe structured price behavior.
On 28 March 2022, Dabur India Ltd began the session from a calculated 0° reference level and moved lower in a controlled manner before reacting from a key geometric zone.
📐 Gann Degree Levels
0° Level: ₹524.15
45° Level: ₹513
⏱️ Time–Price Observation
Price declined from the 0° level and reached the 45° level before 2:30 PM, satisfying the classical Gann “Normal Case” condition.
At the 45° zone:
Price showed stabilization
Downside momentum slowed
A clear upward reaction followed
Throughout the session, the day’s range remained contained within the 45° structure, confirming a balanced intraday movement without extension toward the 90° level.
🧠 Key Insight
This session illustrates how:
45° rotations often act as primary reaction zones
Time confirmation enhances level reliability
Gann’s geometric structure helps filter emotional decision-making
📌 Conclusion
The Gann Square of 9 offers a rule-based framework for understanding intraday market structure by aligning price movement with time symmetry, rather than relying on random indicators.
Disclaimer:
This idea is shared strictly for educational and analytical purposes only. It is not a trading recommendation or investment advice.

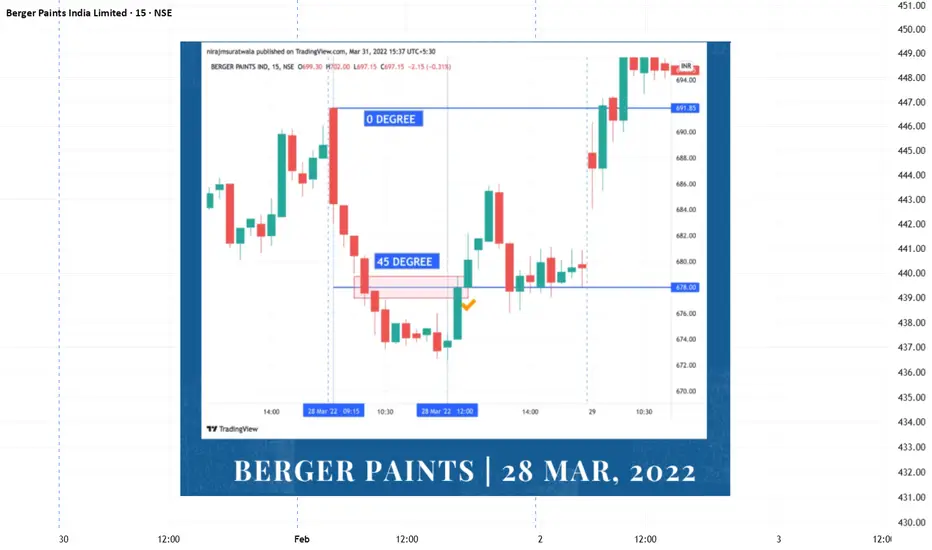
BERGER PAINTS | Gann Square of 9 – 45° Reaction | 28 Mar 2022This idea shares a historical intraday case study demonstrating how the Gann Square of 9 (Normal Case) can be used to observe price reactions at geometric levels.
On 28 March 2022, Berger Paints Ltd displayed a structured intraday decline followed by a precise reaction from a calculated Gann degree level.
📐 Gann Degree Reference
0° Level: ₹691.85
45° Level: ₹678
⏱️ Price & Time Behavior
After opening below the 0° reference, price moved lower and reached the 45° level before 2:30 PM.
At this 45° zone, the market showed a clear stabilization and reversal, respecting the classical Gann “Normal Case” time–price relationship.
For the remainder of the session:
Price remained contained within the 45° range
Intraday volatility stayed balanced
No extension toward the 90° level occurred
🧠 Key Observation
This session highlights how:
45° levels can act as primary reaction zones
Time validation increases the reliability of price levels
Range-bound days can still offer structured intraday behavior
📌 Conclusion
The Gann Square of 9 provides a disciplined framework to analyze intraday market structure, helping traders focus on measurable price–time relationships rather than subjective interpretation.
Disclaimer:
This idea is shared strictly for educational and analytical purposes only. It does not constitute investment or trading advice.
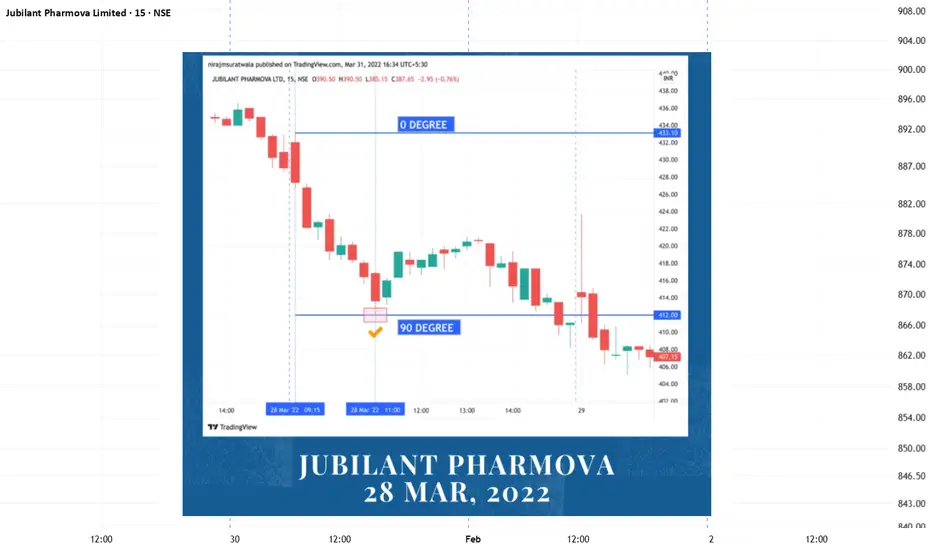
JUBILANT PHARMOVA | Gann Square of 9 – 90° Reaction | 28 Mar 202This post presents a historical intraday case study illustrating how the Gann Square of 9 (Normal Case) can be used to study price reactions through geometric levels.
On 28 March 2022, Jubilant Pharmova Ltd showed a structured intraday move where price respected predefined Gann degree levels derived from the Square of 9.
📐 Gann Degree Reference
0° Level: ₹433
45° Level: ₹423
90° Level: ₹412
⏱️ Price & Time Behavior
After the initial decline from the 0° reference, price continued lower and completed the 90° distance before 2:45 PM.
At the 90° level near ₹412, the market displayed a clear reaction, temporarily stabilizing and bouncing from this mathematically derived zone.
In classical Gann intraday studies:
45° and 90° levels act as balance points
Time plays a critical role in validating reactions
Moves often remain contained within calculated degree ranges
🧠 Key Observation
This session demonstrated how:
Price respects predefined geometric boundaries
Intraday volatility becomes structured when viewed through angles
Reactions occur due to price–time alignment, not randomness
📌 Conclusion
The Gann Square of 9 offers a rule-based framework to observe intraday market behavior with clarity and discipline, allowing traders to focus on reaction zones rather than prediction.
Disclaimer:
This idea is shared strictly for educational and analytical purposes only. It does not constitute investment or trading advice.
UNITED SPIRITS | Gann Square of 9 – 45° Reaction | 28 Mar 2022This is a historical intraday case study explaining how the Gann Square of 9 helps identify measured reaction zones using price geometry and time discipline.
On 28 March 2022, United Spirits Ltd (McDowell’s) opened with upward momentum. The intraday high near ₹891.80 was considered the 0° reference point as per the Gann Square of 9 method.
📐 Gann Degree Structure
0° (Reference Level): ₹891.80
45° (Normal Reaction Zone): ₹876
90° (Extended Move Zone): ₹861
⏱️ Price–Time Observation
Price moved lower from the 0° reference and completed the 45° distance well before 2:30 PM.
At this level, the market responded with a clear upward reaction, showing respect for the Gann geometric boundary.
According to classical Gann intraday studies:
45° levels act as equilibrium zones
Reactions at these levels often occur when price and time align harmonically
🧠 Key Learning
This case demonstrates that:
Market moves often remain contained within calculated degree ranges
Reversals emerge from mathematical structure, not randomness
Discipline comes from observing reaction, not prediction
📌 Conclusion
The Gann Square of 9 provides traders with a logical framework to analyze intraday price behavior, allowing structured decisions instead of emotional interpretation.
Disclaimer:
This idea is shared for educational and analytical purposes only. It does not constitute trading or investment advice.

Unlocking Currency Derivatives: A Complete Guide1. What Are Currency Derivatives?
Currency derivatives are financial contracts whose value is derived from an underlying currency pair, such as USD/INR, EUR/USD, or GBP/JPY. Instead of exchanging physical currencies immediately, these contracts allow parties to lock in, hedge, or bet on future exchange rates.
They are primarily used by:
Importers and exporters
Multinational corporations
Banks and financial institutions
Hedge funds and traders
Central banks (indirectly)
At their core, currency derivatives transfer foreign exchange risk from those who want to avoid it to those willing to take it.
2. Why Currency Derivatives Exist
Currency markets are influenced by:
Interest rate differentials
Inflation expectations
Trade balances
Capital flows
Geopolitical events
Central bank policies
These forces can cause sharp and unpredictable currency swings. For example, a sudden rate hike by the US Federal Reserve can weaken emerging market currencies overnight.
Currency derivatives exist to:
Hedge risk – protect against adverse currency movements
Speculate – profit from expected currency changes
Arbitrage – exploit price inefficiencies between markets
Enhance returns – optimize cash flow and balance sheet exposure
Without derivatives, global trade would be slower, costlier, and far riskier.
3. Types of Currency Derivatives
3.1 Currency Futures
Currency futures are standardized contracts traded on exchanges. They obligate the buyer and seller to exchange a fixed amount of currency at a predetermined rate on a future date.
Key features:
Exchange-traded
Transparent pricing
Daily mark-to-market
Margin-based trading
Example:
An Indian importer expecting to pay USD in three months buys USD/INR futures to lock the exchange rate.
3.2 Currency Forwards
Currency forwards are customized over-the-counter (OTC) contracts between two parties to exchange currencies at a future date.
Advantages:
Flexible size and maturity
Tailor-made hedging
Disadvantages:
Counterparty risk
Less liquidity
No daily settlement
Forwards are widely used by corporations for precise hedging needs.
3.3 Currency Options
Currency options give the holder the right but not the obligation to buy or sell a currency at a specified rate before or on a certain date.
Two types:
Call option – right to buy currency
Put option – right to sell currency
Why options are powerful:
Limited downside risk
Unlimited upside potential
Flexible hedging
Trade-off:
Options require paying a premium, which can be expensive during volatile periods.
3.4 Currency Swaps
Currency swaps involve exchanging principal and interest payments in different currencies over time.
They are used mainly by:
Large corporations
Banks
Governments
Swaps help manage long-term funding and interest rate exposure across currencies.
4. Hedging with Currency Derivatives
Hedging is the most important real-world use of currency derivatives.
Example: Exporter Hedging
An Indian exporter expecting USD inflows fears INR appreciation (which reduces rupee revenue). By selling USD futures or buying USD put options, the exporter locks in profitability regardless of market movements.
Key Hedging Goals:
Protect margins
Stabilize cash flows
Improve financial planning
Reduce earnings volatility
Effective hedging is not about predicting markets—it’s about reducing uncertainty.
5. Speculation and Trading Opportunities
Currency derivatives are also popular among traders due to:
High liquidity
Leverage
Macro-driven price movements
Speculators use:
Interest rate expectations
Central bank commentary
Inflation data
Risk-on / risk-off sentiment
However, leverage magnifies both gains and losses. Without discipline, currency trading can quickly become destructive.
6. Pricing and Valuation Basics
Currency derivatives pricing is driven by:
Spot exchange rate
Interest rate differential between two currencies
Time to maturity
Volatility (especially for options)
For futures and forwards:
Forward Rate ≈ Spot Rate ± Interest Rate Differential
For options:
Volatility is the most critical variable
Time decay (theta) erodes value
Implied volatility reflects market expectations
Understanding pricing helps traders avoid overpaying for risk.
7. Risks Involved in Currency Derivatives
Despite their usefulness, currency derivatives carry risks:
Market risk – adverse currency movements
Leverage risk – amplified losses
Liquidity risk – inability to exit positions
Counterparty risk – especially in OTC contracts
Model risk – incorrect pricing assumptions
Risk management is not optional—it is the foundation of survival.
8. Role of Currency Derivatives in the Global Economy
Currency derivatives:
Enable international trade
Stabilize corporate earnings
Improve capital allocation
Enhance market efficiency
Reflect global macro expectations
They act as a bridge between monetary policy and real economic activity. When central banks move rates, currency derivatives react instantly—often before spot markets.
9. Currency Derivatives in Emerging Markets (Like India)
In emerging markets:
Volatility is higher
Regulatory oversight is stronger
Hedging demand is structural
India’s currency derivatives market has grown rapidly due to:
Rising exports and imports
Liberalized capital flows
Sophisticated corporate treasuries
Retail participation in futures and options
Regulators aim to balance market development with systemic stability.
10. Unlocking the True Power of Currency Derivatives
To truly unlock currency derivatives:
Use them with a clear objective
Understand the macro context
Respect leverage
Prioritize risk over returns
Choose the right instrument for the right exposure
Currency derivatives are not gambling tools—they are precision instruments. In skilled hands, they reduce risk and unlock opportunity. In careless hands, they magnify mistakes.
Final Thought
Currency derivatives sit at the intersection of economics, finance, and geopolitics. Mastering them means understanding how money moves across borders—and how power, policy, and psychology shape exchange rates. Those who unlock this knowledge gain not just trading tools, but a global financial lens.

Consumer Price Index (CPI) Reports: A Complete Breakdown1. Purpose and Importance of CPI Reports
CPI reports serve several critical functions:
Inflation Measurement: CPI is the primary gauge of inflation, reflecting how prices for goods and services change over time. Inflation impacts monetary policy, interest rates, and economic planning.
Policy Decisions: Central banks use CPI data to adjust interest rates. Rising inflation may prompt tighter monetary policy (higher rates), while low inflation may encourage stimulus or rate cuts.
Cost-of-Living Adjustments (COLA): CPI data is used to adjust wages, pensions, and social security payments to maintain purchasing power.
Economic Analysis: Investors and economists analyze CPI trends to predict economic cycles, asset prices, and consumption behavior.
2. CPI Calculation Methodology
CPI is calculated by selecting a basket of goods and services representing average consumer spending. The steps typically involve:
Selection of Goods and Services: The basket includes categories like food, housing, transportation, clothing, healthcare, education, and entertainment.
Price Collection: Prices are collected periodically (monthly or quarterly) from various urban and rural locations.
Weight Assignment: Each category is assigned a weight based on its share in total consumer spending. For example, housing may have a higher weight than clothing.
Index Calculation: The index measures price changes relative to a base period. The formula is generally:
𝐶
𝑃
𝐼
=
Cost of Basket in Current Period
Cost of Basket in Base Period
×
100
CPI=
Cost of Basket in Base Period
Cost of Basket in Current Period
×100
Seasonal Adjustments: Some CPI reports are seasonally adjusted to account for predictable fluctuations like holiday shopping or agricultural harvests.
3. Components of CPI
CPI reports are broken down into major components that provide deeper insight into inflation drivers:
Food and Beverages: Includes groceries, dining out, beverages, and packaged foods. Food prices are volatile due to seasonal production, supply chain disruptions, and commodity price changes.
Housing: Covers rent, homeownership costs, utilities, and maintenance. Housing often carries the largest weight in CPI.
Transportation: Includes fuel, vehicle purchases, public transport, and maintenance. Transportation costs are sensitive to global oil prices.
Apparel/Clothing: Clothing and footwear prices, generally less volatile but important for understanding discretionary spending.
Medical Care/Healthcare: Includes hospital services, prescription drugs, and insurance premiums. Healthcare costs tend to rise faster than general inflation in many countries.
Education and Communication: Tuition fees, textbooks, internet, and mobile services. Education costs impact long-term household budgets.
Recreation and Entertainment: Sports, hobbies, vacations, and media subscriptions.
Miscellaneous Goods and Services: Personal care products, tobacco, alcohol, and other consumer items.
Some CPI reports also separate Core CPI, which excludes food and energy, as these categories are highly volatile. Core CPI provides a clearer view of underlying inflation trends.
4. Types of CPI Measures
CPI can be reported in various ways depending on purpose and methodology:
Headline CPI: Includes all categories of goods and services. It reflects the actual inflation experienced by consumers.
Core CPI: Excludes food and energy due to their volatility. Core CPI is often preferred by central banks for policy decisions.
CPI-U and CPI-W (U.S. Example): CPI-U measures inflation for all urban consumers, while CPI-W focuses on urban wage earners and clerical workers. Different indices help target specific population segments.
Regional CPI: CPI can also be reported at regional or state levels to capture geographic inflation differences.
5. Reading a CPI Report
A typical CPI report provides:
Monthly/Quarterly Change: The percentage change from the previous month or quarter.
Year-over-Year (YoY) Change: The percentage change compared to the same period in the previous year.
Component Breakdown: Contribution of each category to overall CPI. For instance, energy may drive headline inflation if fuel prices surge.
Core vs. Headline: Comparison between core CPI and headline CPI to understand underlying inflation trends.
Historical Comparisons: Some reports provide trends over months or years to contextualize current changes.
Example Interpretation:
A headline CPI of 6% YoY indicates that overall consumer prices have increased by 6% compared to the previous year.
A Core CPI of 4% YoY suggests that excluding volatile items, inflation is moderate.
If energy prices contributed 2% to headline inflation, it signals that energy markets are influencing overall inflation significantly.
6. Economic Implications of CPI Reports
CPI reports have far-reaching implications for different stakeholders:
Central Banks: High CPI readings may lead to interest rate hikes to control inflation, while low CPI may encourage rate cuts.
Government Policy: Policymakers adjust subsidies, taxes, or welfare programs based on CPI trends to maintain affordability for citizens.
Investors: Rising CPI often leads to expectations of higher interest rates, which can affect bond yields, stock valuations, and currency markets.
Businesses: Companies adjust pricing, wages, and supply chain strategies based on CPI trends. High inflation may lead to higher operating costs and reduced consumer demand.
Households: CPI affects purchasing power, household budgets, and long-term financial planning.
7. Limitations of CPI Reports
While CPI is a key inflation measure, it has some limitations:
Substitution Bias: CPI may not fully account for consumers switching to cheaper alternatives when prices rise.
Quality Changes: Improvements in product quality can make CPI overstate inflation if adjustments are not made.
Exclusion of Certain Items: CPI may not include some luxury items or new technology products immediately, which can skew representation.
Regional Variations: National CPI may not capture inflation accurately at local or regional levels.
Lag in Data: CPI reports are often released with a delay, meaning they reflect past price trends, not real-time inflation.
8. Global Variations in CPI Reporting
Different countries use varying methodologies and basket compositions:
United States: Bureau of Labor Statistics publishes CPI-U monthly, using a fixed basket of over 200 categories.
India: Ministry of Statistics publishes Consumer Price Index for Industrial Workers (CPI-IW) and CPI for Rural/Urban households monthly.
European Union: Eurostat publishes Harmonized Index of Consumer Prices (HICP) for cross-country comparison.
China: National Bureau of Statistics publishes CPI and PPI (Producer Price Index) to track both consumer and wholesale inflation.
Global investors often track CPI across major economies to anticipate central bank moves and currency fluctuations.
9. Trends and Analysis in CPI Reports
Analysts often look beyond headline CPI numbers:
Core Inflation Trends: Rising core inflation signals sustained price pressures beyond temporary shocks.
Volatility in Food and Energy: Sharp movements in these categories often explain short-term inflation spikes.
Month-over-Month Patterns: Seasonal patterns, such as holiday price increases or agricultural cycles, affect CPI monthly data.
Comparative Analysis: Comparing CPI to wage growth helps assess real income changes.
10. Conclusion
CPI reports are vital instruments for understanding inflation, consumer behavior, and economic health. They provide insights not just into price changes but into the structure of consumption, cost-of-living adjustments, and the effectiveness of monetary policy. While headline CPI shows the immediate impact on households, core CPI helps policymakers make long-term decisions. Despite limitations, CPI remains the benchmark for economic analysis, financial planning, and global comparisons.
Understanding CPI reports allows governments, investors, businesses, and households to make informed decisions, adapt strategies, and anticipate economic trends. It reflects the pulse of an economy, highlighting areas of inflationary pressure, consumer resilience, and market adjustments.

Emerging Markets and Capital FlowsEmerging markets (EMs) are economies that are in the process of rapid growth and industrialization. Unlike developed economies, they are characterized by structural transformations, rising productivity, increasing integration with the global economy, and improving financial markets. Examples include countries like Brazil, India, China, South Africa, and Mexico, among others. These markets often offer higher potential returns for investors due to their growth trajectories but come with higher risks, including political instability, currency volatility, and lower levels of financial market development.
Capital flows refer to the movement of money for the purpose of investment, trade, or business production. These flows can be broadly categorized into foreign direct investment (FDI), portfolio investment, and other flows like loans or trade credits. Capital flows play a pivotal role in emerging markets because they provide the financial resources necessary for investment, economic expansion, and development. Conversely, sudden reversals of these flows can lead to crises, as seen in the 1997-98 Asian Financial Crisis and the 2008 Global Financial Crisis.
Types of Capital Flows in Emerging Markets
Foreign Direct Investment (FDI):
FDI refers to long-term investments by a foreign entity into a country’s productive assets, such as factories, infrastructure, or technology. Emerging markets often attract FDI because they offer lower labor costs, access to raw materials, and growing domestic markets. FDI is considered relatively stable compared to portfolio flows because it reflects a long-term commitment and is less susceptible to sudden withdrawals. For example, India’s IT and manufacturing sectors have attracted substantial FDI over the last two decades.
Portfolio Investment:
Portfolio flows include investments in stocks, bonds, and other financial instruments. These flows are often more volatile than FDI because they can be quickly withdrawn in response to changes in interest rates, exchange rates, or market sentiment. Emerging markets are particularly sensitive to portfolio flows because large inflows can boost stock and bond prices, while sudden outflows can trigger liquidity crises. For instance, during the COVID-19 pandemic in 2020, EMs experienced sharp outflows of portfolio capital, causing currency depreciation and market stress.
Other Flows:
Other capital flows include loans, trade credits, and official financing from multilateral institutions like the IMF or World Bank. These flows are crucial for infrastructure projects, budgetary support, and financial stability. Emerging markets often rely on these flows to fund development projects, especially in sectors like energy, transport, and social infrastructure.
Drivers of Capital Flows to Emerging Markets
Several factors determine why investors move capital to emerging markets:
Economic Growth Prospects:
Rapid GDP growth is a major attractor for foreign investors. High growth rates signal expanding markets and higher potential returns on investment. For instance, China’s double-digit growth in the 2000s drew massive foreign investment across manufacturing, real estate, and technology sectors.
Interest Rate Differentials:
When developed countries maintain low interest rates, investors search for higher yields elsewhere, often in EMs. This “carry trade” involves borrowing in low-interest currencies and investing in high-yielding assets in EMs. For example, after the global financial crisis, investors poured capital into emerging market bonds due to low returns in the US and Europe.
Exchange Rate Expectations:
Investors are often attracted to countries where they expect the currency to appreciate. Capital inflows can strengthen the local currency, which can boost returns for foreign investors. Conversely, fears of currency depreciation can trigger rapid outflows.
Global Risk Appetite:
The global financial environment significantly impacts capital flows. In periods of optimism, investors are willing to take higher risks, leading to surges in capital to emerging markets. During times of global uncertainty or crises, these flows often reverse sharply.
Structural Reforms and Policy Credibility:
Emerging markets that implement reforms—such as improving corporate governance, liberalizing financial markets, and ensuring policy stability—tend to attract more stable capital flows. Investors value predictability, transparency, and regulatory clarity.
Impacts of Capital Flows on Emerging Markets
Capital flows can have profound economic, financial, and social impacts on emerging markets:
Positive Impacts:
Economic Growth: Capital inflows provide funding for investment in infrastructure, technology, and industry, supporting economic growth.
Financial Market Development: Inflows can deepen capital markets, increase liquidity, and encourage innovation in financial products.
Exchange Rate Stabilization: Moderate inflows can help strengthen the local currency and reduce financing costs for imports and debt.
Job Creation and Skills Transfer: FDI, in particular, brings technology, managerial know-how, and employment opportunities.
Negative Impacts:
Volatility and Risk: Sudden surges or reversals in capital flows can destabilize markets. For example, speculative inflows may inflate asset prices, while rapid outflows can cause financial crises.
Currency Appreciation: Large inflows can overvalue the local currency, making exports less competitive and potentially leading to trade imbalances.
Debt Vulnerability: Borrowing from foreign sources exposes EMs to exchange rate and refinancing risks, especially if the debt is short-term.
Challenges and Risks in Managing Capital Flows
Emerging markets face unique challenges in managing capital flows effectively:
Macroeconomic Management:
Rapid inflows can lead to overheating, inflationary pressures, and asset bubbles, while sudden outflows can trigger recessions. Policymakers often rely on monetary policy tools, such as interest rate adjustments, to manage these pressures.
Exchange Rate Stability:
Many EMs operate in partially liberalized currency regimes. Sudden inflows can lead to excessive currency appreciation, hurting exporters. Conversely, outflows can devalue the currency, increasing foreign debt burdens.
Capital Controls and Regulation:
Some countries use capital controls, taxes on short-term flows, or restrictions on certain types of investments to reduce volatility. However, these measures can deter long-term investment if not implemented carefully.
Global Interdependence:
EMs are highly sensitive to global financial conditions. Changes in US Federal Reserve policy, geopolitical tensions, or global commodity prices can trigger large-scale inflows or outflows, complicating domestic policy.
Recent Trends in Emerging Market Capital Flows
In the past decade, several trends have shaped capital flows to EMs:
Rise of Institutional Investors:
Pension funds, sovereign wealth funds, and mutual funds increasingly invest in EMs, providing relatively stable capital compared to retail or speculative investors.
Digital Financial Integration:
Fintech and digital platforms have eased cross-border investments, increasing portfolio flows and retail participation in EM markets.
Diversification from Developed Markets:
Low yields and sluggish growth in developed economies have driven investors toward EM equities and bonds, particularly in Asia and Latin America.
Geopolitical and Economic Shocks:
Events like the COVID-19 pandemic, US-China trade tensions, and energy price fluctuations have caused periods of volatile inflows and outflows, highlighting the sensitivity of EMs to external shocks.
Policy Implications for Emerging Markets
To maximize the benefits of capital flows while minimizing risks, policymakers in EMs need a balanced approach:
Macroprudential Regulation:
Developing strong regulatory frameworks for banks, capital markets, and foreign exchange can mitigate systemic risks.
Monetary and Fiscal Coordination:
Coordinated policies can reduce inflationary pressures and maintain stability during periods of volatile inflows.
Encouraging Long-term Investment:
Favorable incentives for FDI and stable, predictable regulations can attract long-term capital that contributes to sustainable growth.
Building Reserves:
Maintaining adequate foreign exchange reserves provides a buffer against sudden capital outflows and currency shocks.
Regional Cooperation:
EMs can benefit from regional arrangements, such as swap lines, to enhance financial resilience.
Conclusion
Emerging markets represent dynamic opportunities for growth, but they also come with challenges in managing capital flows. Inflows of foreign capital can finance development, stimulate economic activity, and deepen financial markets. However, volatility, speculative flows, and dependence on external financing can amplify risks. Effective policy management, regulatory oversight, and structural reforms are essential for ensuring that capital flows contribute to sustainable growth rather than financial instability. As globalization deepens and financial markets become more interconnected, understanding the nuances of capital flows is critical for both policymakers and investors seeking to navigate the complexities of emerging market economies.

Axis Bank | Gann Square of 9 – 45° Reaction Zone | 12 Apr 2022This idea highlights a historical intraday case study on Axis Bank Ltd, demonstrating how Gann Square of 9 price-degree mapping helps identify logical reaction zones.
On 12 April 2022, Axis Bank showed a textbook example of degree-based price behavior using Gann’s geometric framework.
📈 Price–Degree Structure
0° reference: ₹777.80
45° projection: ₹791.81
90° projection: ₹805.94
Price advanced from the 0° base and completed the 45° distance well within the intraday time window.
⏱️ Gann Time Principle
As per Gann’s intraday methodology:
When 45° is reached before 2:30 PM, it often acts as a reaction or resistance zone
In this session, price touched the 45° level and showed a clear reaction, validating the relevance of degree-based price geometry.
📐 Key Observation
Although price later moved toward the 90° level, it remained confined between the 45°–90° range, illustrating how Gann degrees often act as natural market boundaries rather than arbitrary levels.
🧠 Conclusion
This case demonstrates how converting price into degrees using the Gann Square of 9 allows traders to:
Anticipate logical reaction zones
Avoid emotional decision-making
Understand structure instead of chasing momentum
Disclaimer:
This idea is shared strictly for educational and analytical purposes only. It does not constitute any investment advice or trade recommendation.

The Real Reason You Miss Good TradesThe Real Reason You Miss Good Trades
“You didn’t miss the trade.
You avoided the discomfort.”
Every trader knows this feeling.
You see the level.
You see the setup.
You even mark the zone.
And then price moves…
without you.
Later, you ask:
“Why didn’t I take that trade?”
The answer is rarely technical.
Why Most Traders Think They Miss Trades
They blame:
• Late entries
• Fast markets
• News
• Platform issues
• “Bad timing”
But those are excuses that feel safer than the truth.
The Real Reason
You miss good trades because they make you uncomfortable.
Good trades often:
• Look risky before they work
• Require waiting without certainty
• Enter near fear, not excitement
• Force you to accept possible loss
Your mind hesitates not because the setup is unclear —
but because the outcome is uncertain.
And uncertainty feels threatening.
Why Bad Trades Are Easier to Take
Bad trades feel comfortable.
They:
• Happen after momentum
• Come with confirmation overload
• Feel “obvious”
• Reduce fear in the moment
That’s why many traders take weak trades quickly
and hesitate on strong ones.
Comfort feels safe.
But safety rarely pays.
The Missed-Trade Pattern
It usually looks like this:
• You wait for “one more confirmation”
• Price moves slightly without you
• You hesitate again
• The trade runs
• You feel frustration — or chase late
The problem wasn’t speed.
It was self-trust.
How Professionals Don’t Miss Good Trades
Professionals don’t feel less fear.
They respect it differently.
They:
• Accept uncertainty before entry
• Execute when criteria is met — not when it feels good
• Size positions so fear doesn’t control them
• Trust repetition, not individual outcomes
They don’t wait to feel ready.
They act when conditions are ready.
A Simple Self-Check
Ask yourself:
“If this trade loses, am I okay with that?”
If the answer is no,
your size — not the setup — is the problem.
Good trades are often quiet, uncomfortable, and easy to miss.
Discipline is learning to step in anyway.
📘 Shared by @ChartIsMirror
What usually stops you from taking good trades —
fear, hesitation, or waiting for certainty? Comment honestly.

The Resources Commodity Super CycleA commodity super cycle refers to a long-term period—often lasting one to three decades—during which commodity prices remain well above their historical averages. Unlike short commodity booms driven by temporary supply disruptions or speculative demand, a super cycle is powered by structural changes in the global economy, especially rapid industrialization, urbanization, technological shifts, and large-scale infrastructure development. When such forces emerge simultaneously across regions, they create sustained demand that outpaces supply growth, pushing prices higher for an extended time.
The resources commodity super cycle mainly involves energy (oil, gas, coal), metals (copper, iron ore, aluminum, nickel), and agricultural resources. These resources are the backbone of economic development, making their demand closely tied to long-term global growth patterns.
Origins and Concept of the Super Cycle
The idea of a commodity super cycle gained prominence in the early 2000s, particularly during the rapid rise of China as a manufacturing and infrastructure powerhouse. Economists observed that commodity prices were not just experiencing cyclical rebounds but entering a prolonged uptrend supported by deep structural forces.
Historically, super cycles have coincided with major global transformations:
The Industrial Revolution in the 19th century
Post-World War II reconstruction in Europe and Japan
Rapid industrialization of East Asian economies
China’s urbanization and infrastructure boom after 2000
Each phase involved massive consumption of raw materials, leading to long-lasting pressure on global supply chains.
Key Drivers of a Resources Commodity Super Cycle
1. Rapid Industrialization and Urbanization
Industrial growth requires enormous quantities of steel, copper, cement, and energy. Urbanization further accelerates demand through housing, transport networks, power generation, and consumer goods. When large populations move from rural to urban areas—as seen in China, India, and parts of Africa—the demand for commodities expands exponentially.
2. Infrastructure Development
Governments often invest heavily in roads, railways, ports, power plants, and digital infrastructure during growth phases. Infrastructure projects are resource-intensive and typically span many years, creating stable, long-term demand for commodities like iron ore, copper, aluminum, and energy fuels.
3. Energy Transition and Technology Shifts
The global transition toward renewable energy and electric mobility has added a new dimension to the commodity super cycle. Technologies such as electric vehicles, solar panels, wind turbines, and battery storage require large quantities of critical minerals like lithium, cobalt, nickel, rare earths, and copper. This structural shift is expected to keep demand elevated for decades.
4. Supply Constraints and Underinvestment
Commodity supply is often slow to respond to rising demand. Mining, oil exploration, and agricultural capacity expansion require long lead times and significant capital. Periods of low prices typically result in underinvestment, which later causes supply shortages when demand recovers—fueling a super cycle.
5. Monetary Policy and Inflation
Loose global monetary policies, low interest rates, and currency depreciation can amplify commodity prices. Since commodities are priced globally, inflation and a weakening reserve currency can make physical resources more attractive as a store of value, reinforcing price uptrends.
Phases of a Commodity Super Cycle
A resources super cycle generally unfolds in four distinct phases:
Recovery Phase
Prices begin rising from depressed levels as demand improves and inventories decline. Investment remains cautious during this phase.
Acceleration Phase
Demand surges strongly while supply struggles to keep up. Prices rise rapidly, profitability improves, and capital flows into resource sectors.
Peak Phase
High prices encourage aggressive investment and new capacity. Speculation increases, and marginal projects become viable. Eventually, supply growth catches up.
Decline Phase
Oversupply, slowing economic growth, or technological substitution leads to falling prices. Investment collapses, setting the stage for the next cycle.
Super cycles differ from normal cycles mainly in duration and magnitude, often spanning decades rather than years.
Impact on Global Economies
Commodity-Exporting Countries
Countries rich in natural resources—such as Australia, Brazil, Canada, Russia, and parts of Africa—benefit significantly. Higher export revenues strengthen currencies, improve fiscal balances, and boost economic growth. However, excessive reliance on commodities can also lead to volatility and the risk of “resource curse” if revenues are mismanaged.
Commodity-Importing Countries
Nations dependent on imports face higher production costs, inflationary pressures, and trade deficits. For emerging economies, rising energy and metal prices can strain government finances and household budgets.
Corporations and Industries
Mining, energy, and agribusiness firms experience strong profitability and expansion opportunities. Downstream industries, however, may see margin pressure due to rising input costs.
Investment Implications of a Super Cycle
For investors, a resources commodity super cycle presents both opportunities and risks:
Equities: Mining, energy, and infrastructure companies often outperform during upcycles.
Commodities: Direct exposure through futures or ETFs can provide diversification and inflation protection.
Currencies: Commodity-linked currencies may strengthen.
Volatility: Sharp price swings are common, requiring strong risk management.
Long-term investors typically benefit more than short-term traders, as timing peaks and troughs is extremely challenging.
Risks and Challenges
Despite its appeal, a commodity super cycle is not guaranteed to continue indefinitely. Key risks include:
Global economic slowdowns or recessions
Technological innovation reducing commodity intensity
Policy changes, such as environmental regulations
Substitution and recycling reducing primary demand
Geopolitical disruptions altering supply chains
These factors can shorten or disrupt even the strongest cycles.
The Future of the Resources Commodity Super Cycle
Many analysts believe the world may be entering or already experiencing a new form of commodity super cycle, driven by energy transition, digital infrastructure, and emerging market growth. Unlike past cycles dominated by fossil fuels and steel, this one is more focused on critical minerals and sustainable resources.
However, the future cycle is likely to be more complex and uneven, with strong demand for certain commodities and structural decline for others. Sustainability, environmental concerns, and technological efficiency will play a bigger role than in previous cycles.
Conclusion
The resources commodity super cycle is a powerful economic phenomenon shaped by long-term structural forces rather than short-term market noise. It reflects the deep connection between natural resources and human development. Understanding its drivers, phases, and implications is essential for policymakers, businesses, and investors alike. While super cycles bring immense opportunities for growth and wealth creation, they also demand disciplined planning, prudent investment, and sustainable resource management to ensure long-term benefits for the global economy.

Axis Bank | Gann Square of 9 – No Trade Day Case StudyThis idea shares a historical intraday case study on Axis Bank Ltd, demonstrating how Gann Square of 9 degree + time rules help traders identify sessions with no valid trading opportunity.
On 11 April 2022, Axis Bank presented two separate Gann reference structures, yet neither fulfilled the conditions required for a high-probability trade.
📈 Upside Structure
0° reference: ₹786.05
Projected 45° level: ₹800.13
Price moved upward from the 0° base but failed to reach the 45° level within the intraday time window, resulting in no valid sell-side setup.
📉 Downside Structure
0° reference: ₹794.25
Projected 45° level: ₹780
Later in the session, price declined from the new 0° base, but once again did not complete the 45° downside move, eliminating any valid buy-side opportunity.
⏱️ Gann Time Rules Applied
As per Gann’s intraday principles, a tradable setup generally forms when:
45° is reached before 2:30 PM, or
90° is reached before 2:45 PM
Neither condition was met during this session.
🧠 Conclusion
April 11, 2022 stands out as a clear “No Trade Day”.
This chart reinforces a core Gann principle:
Capital protection begins with patience.
Not every session offers opportunity — and recognizing that is a skill.
Disclaimer:
This idea is shared strictly for educational and analytical purposes only. It does not constitute any trading advice or recommendation.

Axis Bank | Gann Square of 9 – No-Trade Case Study This idea presents a historical intraday case study on Axis Bank Ltd, highlighting how Gann Square of 9 degree rules help traders identify non-tradable sessions with clarity.
On 8 April 2022, Axis Bank initiated an upward move from the 0° reference near ₹789.
Using Gann Square of 9 calculations, the next key projection was the 45° level near ₹803.
Throughout the session, price failed to complete the 45° movement within the intraday time window, and no meaningful interaction occurred at the projected degree level.
As per Gann’s methodology, when price does not reach the expected degree within time, the session is classified as a no-trade day.
📐 Observed Gann Levels
0° → ₹789
45° → ₹803
🧠 Key Learning
Gann theory is not only about finding trades — it is equally about avoiding low-probability conditions.
This chart demonstrates:
Respect for degree boundaries
Absence of forced entries
Importance of patience and structure
Sometimes, no trade is the best trade.
Disclaimer:
This chart is shared strictly for educational and analytical purposes. It does not represent any trading recommendation.

Why Forex Reserves Matter1. Foundation of Currency Stability
One of the most important reasons forex reserves matter is their role in maintaining currency stability. Exchange rates are influenced by supply and demand in the foreign exchange market. During periods of stress—such as capital outflows, geopolitical tensions, or global financial shocks—a country’s currency may come under severe depreciation pressure.
Forex reserves allow the central bank to intervene in currency markets by selling foreign currency (usually US dollars) and buying the domestic currency. This intervention helps smooth excessive volatility, prevent panic-driven depreciation, and maintain orderly market conditions. Without sufficient reserves, a country becomes vulnerable to speculative attacks and sharp currency crashes, which can quickly spill over into inflation and financial instability.
2. Shield Against External Shocks
Global economies are interconnected. External shocks such as oil price spikes, global recessions, sudden stops in capital flows, or financial crises can severely impact a country’s balance of payments. Forex reserves act as a financial buffer during such times.
When export revenues decline or foreign capital dries up, reserves help meet external payment obligations like imports, debt servicing, and foreign liabilities. Countries with healthy reserves can absorb shocks more effectively, avoiding abrupt policy measures such as import restrictions, capital controls, or emergency borrowing at unfavorable terms.
3. Ensuring Smooth International Trade
International trade relies heavily on stable access to foreign currencies. Countries need forex to pay for imports such as crude oil, machinery, technology, medicines, and essential commodities. Adequate forex reserves ensure that a nation can continue importing critical goods even if export earnings temporarily fall.
This is particularly important for import-dependent economies. If reserves are low, even short-term disruptions can lead to shortages, rising prices, and economic stress. Strong reserves, on the other hand, reassure global suppliers and trading partners that payments will be honored on time, strengthening trade relationships.
4. Boosting Investor Confidence
Forex reserves are closely watched by foreign investors, rating agencies, and international financial institutions. High and stable reserves signal economic strength, prudent macroeconomic management, and financial discipline.
When investors see that a country has ample reserves, they feel more confident investing in its equity markets, bonds, and infrastructure projects. This confidence reduces the country’s risk premium, lowers borrowing costs, and attracts long-term capital inflows. Conversely, declining or critically low reserves often raise red flags, triggering capital flight and currency depreciation.
5. Supporting Monetary and Fiscal Policy
Forex reserves enhance the effectiveness of monetary policy. Central banks use reserves to manage liquidity, control inflationary pressures arising from currency depreciation, and stabilize interest rates during volatile periods.
In addition, reserves provide flexibility to the government during fiscal stress. While reserves are not meant to fund regular government spending, their presence allows policymakers more room to maneuver during crises—such as pandemics or financial meltdowns—without immediately resorting to external bailouts or austerity measures.
6. Meeting External Debt Obligations
Many countries borrow in foreign currencies. Servicing this external debt—interest and principal repayments—requires reliable access to forex. Reserves ensure that debt obligations can be met even if market access becomes constrained or refinancing becomes expensive.
Countries with weak reserves may face higher default risks, currency mismatches, and rising debt servicing costs. In contrast, strong reserves lower sovereign risk and improve credit ratings, which further reduces borrowing costs in international markets.
7. Crisis Prevention and Crisis Management
History provides many examples where inadequate forex reserves triggered or worsened economic crises. Currency crises in Asia (1997), Latin America, and other emerging markets were often linked to weak reserves relative to short-term external liabilities.
Adequate reserves serve as insurance. They deter speculative attacks because markets know the central bank has enough firepower to defend the currency. Even if reserves are not fully used, their presence alone can prevent crises by anchoring expectations and calming markets.
8. Enhancing Global Standing and Negotiating Power
Forex reserves also influence a country’s global economic standing. Nations with large reserves have greater influence in international forums, stronger bargaining power in trade negotiations, and more credibility in global financial discussions.
They are also better positioned to support regional stability, extend swap lines, or assist neighboring economies during crises. This enhances geopolitical and economic influence beyond domestic borders.
9. Indicator of Economic Health
Forex reserves are a key macroeconomic indicator. Analysts track metrics such as import cover (how many months of imports reserves can pay for), reserves-to-GDP ratio, and reserves relative to short-term external debt. These indicators help assess a country’s vulnerability to external risks.
While extremely high reserves may raise questions about opportunity costs, insufficient reserves are almost universally viewed as a serious economic weakness.
10. Balancing Costs and Benefits
It is important to note that holding forex reserves is not cost-free. Reserves are usually invested in low-risk, low-return assets like US Treasury bonds. This means there is an opportunity cost compared to investing in domestic infrastructure or social development.
However, most economists agree that the benefits of adequate reserves—stability, confidence, and resilience—far outweigh the costs, especially in a volatile global financial environment.
Conclusion
Forex reserves matter because they sit at the crossroads of stability, confidence, and sovereignty in the global financial system. They protect a country from external shocks, stabilize the currency, support trade, reassure investors, and strengthen policy effectiveness. In an era marked by rapid capital flows, geopolitical uncertainty, and frequent economic disruptions, strong forex reserves are not a luxury—they are a necessity.
For policymakers, investors, traders, and citizens alike, understanding the importance of forex reserves provides deeper insight into a nation’s economic strength and its ability to navigate uncertainty with confidence.

Central Bank Digital Currencies in the Global Market1. Understanding CBDCs in the Global Context
A CBDC is a digital version of a country’s fiat currency, backed by the central bank and considered legal tender. Unlike cryptocurrencies such as Bitcoin, CBDCs are centralized, regulated, and designed to maintain monetary sovereignty. Countries like China (Digital Yuan), the Bahamas (Sand Dollar), Nigeria (eNaira), and pilot projects in the European Union, India, and the United States illustrate the global momentum toward CBDC adoption.
In the global market, CBDCs act as a bridge between traditional financial systems and the digital economy, offering a state-backed alternative to private digital payment platforms and stablecoins.
2. Enhancing Payment Efficiency and Financial Infrastructure
One of the most immediate roles of CBDCs in the global market is improving payment efficiency. Traditional cross-border payments are often slow, expensive, and dependent on multiple intermediaries. CBDCs can enable faster, cheaper, and more transparent transactions, especially in international trade and remittances.
For example, CBDC-based settlement systems can reduce reliance on correspondent banking networks, lowering transaction costs for businesses engaged in global trade. This efficiency can be particularly beneficial for emerging markets, where high remittance costs and limited access to banking infrastructure hinder economic growth.
3. Strengthening Monetary Policy Transmission
CBDCs provide central banks with a more direct channel to implement and transmit monetary policy. In the global market, this capability enhances macroeconomic stability. By issuing digital currency directly to citizens or financial institutions, central banks can respond more quickly to economic crises, stimulate demand, or control inflation.
In times of global financial stress, such as pandemics or recessions, CBDCs could enable instant fiscal transfers, targeted stimulus, or negative interest rate policies if required. This improved policy precision strengthens confidence in national currencies and stabilizes global financial markets.
4. Promoting Financial Inclusion Worldwide
Financial inclusion is a key objective behind many CBDC initiatives. In the global market, billions of people remain unbanked or underbanked, particularly in developing economies. CBDCs, accessible through mobile phones or digital wallets, can provide basic financial services without requiring traditional bank accounts.
This inclusion expands participation in the global economy, allowing individuals and small businesses to engage in digital commerce, cross-border transactions, and formal financial systems. Over time, greater inclusion can lead to higher productivity, increased consumption, and stronger global economic integration.
5. Impact on Cross-Border Trade and Currency Settlement
CBDCs have the potential to reshape global trade settlement mechanisms. Currently, the U.S. dollar dominates international trade and reserves. With CBDCs, countries may seek alternatives to dollar-based systems, reducing dependency on a single reserve currency.
Multi-CBDC platforms, where different national digital currencies interact seamlessly, could simplify cross-border settlements and reduce foreign exchange risks. This shift may encourage regional trade blocs and bilateral trade agreements using CBDCs, altering global currency dynamics and enhancing monetary sovereignty for participating nations.
6. Competition with Cryptocurrencies and Stablecoins
The rise of cryptocurrencies and private stablecoins has challenged traditional monetary systems. CBDCs play a crucial role in counterbalancing this trend in the global market. By offering a secure, regulated, and stable digital currency, central banks can maintain control over money supply and payment systems.
CBDCs also reduce risks associated with private digital currencies, such as volatility, lack of consumer protection, and regulatory uncertainty. In this sense, CBDCs act as a stabilizing force, ensuring trust and reliability in digital finance at a global scale.
7. Financial Stability and Risk Management
From a global market perspective, CBDCs can enhance financial stability by reducing systemic risks. Digital currencies issued by central banks can lower dependence on commercial banks for payments, reducing the risk of bank runs during crises.
However, CBDCs also require careful design to avoid unintended consequences, such as excessive capital flows or disintermediation of banks. International coordination among central banks becomes essential to manage these risks and maintain global financial stability.
8. Geopolitical and Strategic Implications
CBDCs are not just economic tools; they carry geopolitical significance. Countries leading in CBDC development may gain strategic advantages in global finance. For example, China’s Digital Yuan is often viewed as a means to increase its influence in international trade and reduce reliance on Western-dominated payment systems.
In the global market, CBDCs could reshape financial power structures, influence sanctions enforcement, and redefine how countries interact economically. As more nations adopt CBDCs, global standards and interoperability frameworks will become critical to avoid fragmentation.
9. Regulatory Harmonization and Global Cooperation
The success of CBDCs in the global market depends heavily on international cooperation. Regulatory alignment, data privacy standards, cybersecurity frameworks, and anti-money laundering (AML) measures must be coordinated across borders.
Institutions such as the Bank for International Settlements (BIS), International Monetary Fund (IMF), and World Bank play a vital role in fostering collaboration and setting global guidelines. Harmonized standards ensure that CBDCs enhance, rather than disrupt, the global financial ecosystem.
10. Future Outlook of CBDCs in the Global Market
Looking ahead, CBDCs are likely to coexist with cash, commercial bank money, and private digital assets. Their role in the global market will continue to evolve as technology advances and adoption expands. Over time, CBDCs may become a cornerstone of digital global finance, supporting trade, investment, and economic stability.
While challenges remain—such as privacy concerns, cybersecurity risks, and technological complexity—the potential benefits of CBDCs are substantial. By modernizing money itself, CBDCs can foster a more efficient, inclusive, and resilient global financial system.
Conclusion
CBDCs represent a transformative shift in how money functions within the global market. By enhancing payment efficiency, strengthening monetary policy, promoting financial inclusion, and reshaping cross-border trade, CBDCs are poised to play a central role in the future of global finance. As countries continue to experiment and implement these digital currencies, their collective impact will redefine economic interactions, monetary sovereignty, and financial stability on a global scale.

Globalization and Deglobalization An Evolving Economic NarrativeUnderstanding Globalization
Globalization refers to the process through which countries, businesses, and people become increasingly interconnected and interdependent across borders. This integration occurs through the movement of goods, services, capital, technology, information, and labor. The roots of globalization can be traced back centuries through trade routes like the Silk Road, but its modern form accelerated significantly after World War II.
Key drivers of globalization include advances in technology, reductions in trade barriers, liberalization of financial markets, and the rise of multinational corporations. Innovations in transportation, such as container shipping, and communication technologies, like the internet and mobile connectivity, have drastically reduced the cost and time required to conduct cross-border activities. Institutions such as the World Trade Organization (WTO), International Monetary Fund (IMF), and World Bank have also played a crucial role by promoting free trade, financial stability, and economic cooperation.
Economically, globalization has allowed countries to specialize based on comparative advantage, leading to more efficient production and lower costs. Consumers benefit from a wider variety of goods at competitive prices, while businesses gain access to global markets, capital, and talent. Emerging economies, particularly in Asia, leveraged globalization to accelerate industrialization, lift millions out of poverty, and integrate into global value chains.
Beyond economics, globalization has had profound cultural and social impacts. Ideas, values, lifestyles, and entertainment now flow rapidly across borders, contributing to cultural exchange and, in some cases, cultural homogenization. Education, tourism, and migration have expanded global exposure, fostering cross-cultural understanding but also sparking debates about identity and tradition.
Benefits and Criticisms of Globalization
Despite its benefits, globalization has faced significant criticism. One major concern is inequality. While globalization has increased global wealth, the gains have not been evenly distributed. Developed countries and large corporations often benefit more than developing nations or small businesses. Within countries, high-skilled workers and capital owners tend to gain, while low-skilled workers may face job displacement due to outsourcing and automation.
Another criticism relates to labor and environmental standards. Companies operating across borders may shift production to countries with lower wages, weaker labor protections, or lax environmental regulations, leading to exploitation and environmental degradation. Additionally, globalization can reduce national policy autonomy, as governments may feel constrained by global markets, trade agreements, and investor expectations.
Financial globalization has also increased vulnerability to global shocks. Crises such as the 2008 global financial crisis demonstrated how deeply interconnected financial systems can transmit instability rapidly across borders.
The Emergence of Deglobalization
Deglobalization refers to the slowing, reversal, or reconfiguration of global integration. It does not necessarily imply a complete withdrawal from global trade or cooperation but reflects a shift away from hyper-globalization toward more localized or regional systems. Deglobalization gained prominence after the global financial crisis and intensified further due to geopolitical tensions, trade wars, the COVID-19 pandemic, and rising nationalism.
Several factors have contributed to deglobalization. Politically, there has been a resurgence of nationalist and populist movements advocating for domestic industries, border controls, and economic sovereignty. Trade policies such as tariffs, sanctions, and reshoring initiatives reflect growing skepticism toward free trade. The US–China trade tensions are a prominent example of how strategic rivalry can disrupt global supply chains.
Economically, firms and governments have reassessed the risks of over-reliance on complex global supply chains. The pandemic exposed vulnerabilities in just-in-time production systems, leading many countries to prioritize supply chain resilience, strategic stockpiles, and domestic manufacturing, especially in critical sectors like semiconductors, pharmaceuticals, and energy.
Technological and security concerns have also fueled deglobalization. Control over data, technology transfer, and national security has become a priority, resulting in restrictions on foreign investment, technology exports, and cross-border data flows.
Impacts of Deglobalization
Deglobalization has mixed consequences. On one hand, it can enhance national resilience, protect strategic industries, and create local employment opportunities. It allows governments greater control over economic policy and reduces exposure to external shocks. Regionalization of trade, where countries trade more within geographic blocs, can also strengthen regional cooperation.
On the other hand, deglobalization can increase costs, reduce efficiency, and limit innovation. Protectionist policies may lead to higher prices for consumers, retaliatory trade measures, and slower economic growth. Developing countries that depend on export-led growth may face reduced opportunities, potentially widening global inequality.
Deglobalization also risks fragmenting the global system into competing blocs, increasing geopolitical tensions and reducing collaboration on global challenges such as climate change, public health, and financial stability.
Globalization vs. Deglobalization: A False Dichotomy?
Rather than viewing globalization and deglobalization as absolute opposites, many analysts argue that the world is entering a phase of “re-globalization” or “selective globalization.” In this model, countries remain globally connected but with greater emphasis on resilience, sustainability, and strategic autonomy. Global supply chains are being restructured rather than dismantled, with diversification, nearshoring, and friend-shoring becoming common strategies.
Digital globalization continues to expand even as physical trade growth slows. Cross-border data flows, digital services, and remote work are creating new forms of global integration that differ from traditional manufacturing-led globalization.
Conclusion
Globalization and deglobalization are not static or mutually exclusive processes but part of a dynamic continuum shaped by economic, political, technological, and social forces. Globalization has driven growth, innovation, and interconnectedness, while deglobalization reflects a corrective response to its excesses and vulnerabilities. The future is likely to be defined not by complete globalization or isolation, but by a more balanced and adaptive global system—one that seeks efficiency alongside resilience, openness alongside sovereignty, and growth alongside inclusivity.

Positional TradingIntroduction to Positional Trading
Positional trading is a trading style where positions are held for an extended period—ranging from a few weeks to several months—to benefit from medium- to long-term price movements. Unlike intraday trading, which focuses on short-term price fluctuations within a single trading session, positional trading is designed for traders who want to participate in larger market trends without the need to monitor markets constantly. This approach is especially popular among working professionals and investors who prefer a balance between active trading and long-term investing.
At its core, positional trading combines elements of both technical and fundamental analysis. Traders aim to identify strong trends, enter at favorable price levels, and hold their positions patiently until the trend shows signs of exhaustion or reversal.
Key Characteristics of Positional Trading
One of the defining features of positional trading is the holding period. Positions are not closed quickly; instead, traders allow enough time for the underlying trend to fully develop. This reduces the impact of daily market noise and minor price fluctuations.
Another important characteristic is relatively lower trading frequency. Since trades are fewer, transaction costs such as brokerage fees and taxes are generally lower compared to intraday or high-frequency trading. This makes positional trading more cost-efficient over time.
Risk management is also central to positional trading. Because positions are held overnight and across market events, traders must account for gap-ups and gap-downs. Wider stop-loss levels are typically used, but position sizing is adjusted to keep overall risk under control.
Positional Trading vs Other Trading Styles
Positional trading sits between swing trading and long-term investing. Swing traders usually hold positions for a few days to a couple of weeks, focusing on short-term momentum. Long-term investors, on the other hand, may hold assets for years based primarily on fundamentals.
Positional traders bridge this gap by using technical setups to enter trades while aligning with broader fundamental or macroeconomic trends. This hybrid nature allows traders to capture meaningful price moves without committing capital for very long durations.
Role of Technical Analysis in Positional Trading
Technical analysis plays a crucial role in positional trading. Traders use higher time-frame charts such as daily, weekly, and sometimes monthly charts to identify trends and key levels. Commonly used tools include moving averages, trendlines, support and resistance levels, and chart patterns like triangles, flags, and head-and-shoulders formations.
Indicators such as Relative Strength Index (RSI), Moving Average Convergence Divergence (MACD), and Average Directional Index (ADX) help traders assess momentum and trend strength. In positional trading, indicators are used more for confirmation than for frequent entry and exit signals.
Importance of Fundamental Analysis
While technicals help with timing, fundamental analysis provides conviction. Positional traders often analyze company earnings, growth prospects, sector performance, and macroeconomic factors such as interest rates, inflation, and government policies.
For example, a trader may take a positional long trade in a stock showing strong technical breakout while also benefiting from improving earnings visibility or sector-wide tailwinds. This alignment between fundamentals and technicals increases the probability of trade success.
Risk Management and Position Sizing
Risk management is one of the most critical aspects of positional trading. Since stop-losses are generally wider, traders must reduce position size to maintain a fixed percentage risk per trade. A common approach is to risk only 1–2% of total trading capital on a single position.
Trailing stop-losses are frequently used to lock in profits as the trend progresses. This allows traders to stay in winning trades longer while protecting accumulated gains. Discipline in following stop-loss rules is essential, as emotional decisions can quickly erode profits.
Psychological Aspects of Positional Trading
Positional trading requires patience and emotional stability. Traders must be comfortable with short-term drawdowns and periods when the market moves sideways. The ability to stick to a trading plan without reacting impulsively to daily price fluctuations is a key success factor.
Because trades last longer, positional traders are also exposed to news events and market sentiment shifts. Managing fear during temporary corrections and avoiding greed when prices move favorably are constant psychological challenges.
Advantages of Positional Trading
One major advantage of positional trading is time efficiency. Traders do not need to watch the market continuously, making it suitable for those with full-time jobs. The focus on larger trends also offers the potential for higher reward-to-risk ratios compared to short-term trading.
Additionally, positional trading reduces stress caused by rapid decision-making. By relying on higher time frames and well-defined setups, traders can approach the market in a calmer and more structured manner.
Limitations and Risks
Despite its advantages, positional trading is not without risks. Overnight positions expose traders to unexpected news, geopolitical events, and earnings surprises. Market gaps can lead to losses beyond predefined stop-loss levels.
Another limitation is capital lock-in. Since trades remain open for weeks or months, capital cannot be easily redeployed into other opportunities. This requires careful planning and portfolio diversification.
Conclusion
Positional trading is a disciplined and strategic approach aimed at capturing substantial market trends over medium- to long-term horizons. By combining technical analysis for precise entries and exits with fundamental insights for broader context, traders can improve their probability of success. Effective risk management, emotional control, and patience are essential pillars of this trading style.
For traders seeking a balanced method that avoids the intensity of intraday trading while remaining more active than long-term investing, positional trading offers a practical and rewarding path—provided it is executed with consistency, discipline, and a well-defined trading plan.

Risks Arising from Market Volatility1. Price Uncertainty and Capital Erosion
The most direct risk of market volatility is price uncertainty. Sharp and unpredictable price movements can lead to rapid capital erosion, especially for investors with concentrated positions. When markets swing aggressively, asset prices may deviate significantly from their intrinsic or fundamental value, causing temporary or permanent losses. For retail investors, this uncertainty can result in panic-driven decisions such as selling at market bottoms or chasing prices at unsustainable highs.
In highly volatile phases, even fundamentally strong assets can witness steep drawdowns. This creates mark-to-market losses that may not reflect long-term value but still affect portfolio net worth, margin requirements, and investor confidence.
2. Increased Risk of Emotional and Behavioral Biases
Volatile markets amplify emotional reactions such as fear, greed, anxiety, and overconfidence. Behavioral finance studies show that investors are more prone to cognitive biases during periods of high volatility. Fear can lead to premature exits, while greed can result in over-leveraging or entering trades without adequate risk assessment.
Common behavioral risks include:
Loss aversion: Investors hold losing positions too long, hoping for a reversal.
Herd behavior: Following market trends without independent analysis.
Overtrading: Excessive buying and selling, leading to higher transaction costs and poor performance.
These emotional responses often worsen outcomes rather than mitigate risk.
3. Liquidity Risk and Market Disruptions
During periods of extreme volatility, market liquidity can deteriorate rapidly. Bid-ask spreads widen, trading volumes become uneven, and certain assets may become difficult to buy or sell without significant price impact. This liquidity risk is especially pronounced in small-cap stocks, corporate bonds, derivatives, and emerging market assets.
In stressed conditions, market participants may rush to exit positions simultaneously, leading to disorderly price movements and flash crashes. Even large institutional investors can face challenges in unwinding positions without incurring substantial losses.
4. Leverage and Margin-Related Risks
Volatility poses heightened risks for leveraged positions. Instruments such as futures, options, and margin trading magnify both gains and losses. In volatile markets, sudden adverse price movements can trigger margin calls, forcing investors to either inject additional capital or liquidate positions at unfavorable prices.
For traders and hedge funds, leverage combined with volatility can lead to rapid drawdowns and, in extreme cases, insolvency. Historical market crises have repeatedly shown that excessive leverage during volatile phases is one of the primary causes of systemic failures.
5. Portfolio Correlation Breakdown
One of the less obvious risks of market volatility is the breakdown of diversification benefits. During normal market conditions, asset classes such as equities, bonds, commodities, and currencies may exhibit low or negative correlations. However, in periods of stress, correlations often converge toward one, meaning many assets fall simultaneously.
This phenomenon reduces the effectiveness of diversification strategies and exposes portfolios to higher-than-expected losses. Investors who rely heavily on historical correlation patterns may find their risk models inadequate during volatile regimes.
6. Volatility Drag and Compounding Risk
High volatility can reduce long-term returns through a phenomenon known as volatility drag. Even if an asset experiences equal positive and negative percentage moves over time, the cumulative effect may be negative due to compounding.
For example, a 20% loss requires a 25% gain to break even. Frequent large swings can therefore erode portfolio value, particularly for long-term investors who do not actively rebalance or manage risk exposure.
7. Derivatives and Model Risk
In volatile markets, pricing models used for derivatives may become unreliable. Assumptions such as constant volatility, normal distribution of returns, or stable correlations often break down during market stress. This can lead to mispricing of options, incorrect hedging strategies, and unexpected losses.
Additionally, sudden spikes in implied volatility can sharply increase option premiums, affecting both buyers and sellers. Sellers face unlimited risk if volatility expands beyond expectations, while buyers risk rapid time decay if volatility collapses.
8. Systemic and Macro-Economic Risks
Extreme market volatility can spill over into the broader financial system and real economy. Large drawdowns may weaken investor confidence, reduce consumption, delay corporate investments, and tighten credit conditions. Financial institutions exposed to volatile assets may face balance-sheet stress, increasing systemic risk.
Central banks and regulators often intervene during such periods through liquidity injections, rate adjustments, or regulatory measures. However, policy uncertainty itself can add another layer of volatility, creating a feedback loop between markets and macroeconomic conditions.
9. Strategic and Planning Challenges
Volatility complicates long-term financial planning. Retirement planning, asset-liability matching, and capital allocation decisions become more difficult when future returns are highly uncertain. Businesses may postpone expansion plans, while investors may struggle to set realistic return expectations.
For fund managers, performance evaluation during volatile periods becomes challenging, as short-term results may not reflect skill but rather exposure to market swings.
10. Opportunity Cost and Missed Gains
While volatility creates opportunities, it also introduces the risk of missed gains. Investors who exit markets entirely due to fear may fail to participate in subsequent recoveries. Historically, some of the strongest market rallies have followed periods of extreme volatility.
Staying on the sidelines for too long can lead to significant opportunity costs, especially for long-term investors relying on compounding returns.
Conclusion
Market volatility is an inherent feature of financial markets, reflecting changing information, expectations, and risk perceptions. While it can offer opportunities for skilled traders, it also introduces substantial risks ranging from capital loss and liquidity stress to behavioral errors and systemic instability. Effective risk management—through diversification, disciplined position sizing, prudent use of leverage, and emotional control—is crucial to navigating volatile markets successfully.

Understanding the Ongoing Shift in the World EconomyGlobal Markets at a Turning Point:
The global financial markets are undergoing one of the most significant transitions seen in decades. What was once a predictable, liquidity-driven environment dominated by low interest rates and globalization has evolved into a complex, fragmented, and structurally changing landscape. This shift is being driven by a combination of macroeconomic, geopolitical, technological, and policy-related forces. Investors, traders, governments, and businesses are all being compelled to adapt to a new reality where old assumptions no longer hold true.
1. From Easy Money to Tight Liquidity
For more than a decade after the 2008 global financial crisis, markets thrived on abundant liquidity. Central banks maintained ultra-low interest rates and injected massive stimulus through quantitative easing. Asset prices across equities, bonds, real estate, and even speculative assets surged.
Today, that era has decisively ended. Persistent inflation forced central banks—especially the US Federal Reserve, European Central Bank, and Bank of England—to raise interest rates aggressively. Higher borrowing costs have reshaped capital flows, equity valuations, and risk appetite. Liquidity is no longer cheap or abundant, making capital allocation far more selective. Markets now reward profitability, cash flow strength, and balance-sheet discipline rather than pure growth narratives.
2. Inflation Has Changed Market Behavior
Inflation is no longer viewed as a temporary phenomenon. Structural factors such as deglobalization, supply-chain reconfiguration, higher wage pressures, and energy transition costs have made inflation more persistent. As a result, bond markets have become more volatile, real yields have turned positive, and equity investors have shifted focus toward pricing power and margin sustainability.
This inflationary backdrop has revived interest in real assets like commodities, infrastructure, and inflation-linked securities. Traditional 60:40 portfolios (equities and bonds) are being questioned, as correlations between asset classes behave differently during inflationary regimes.
3. Geopolitics and the Fragmentation of Globalization
One of the most defining aspects of the current market shift is geopolitical realignment. The world is moving away from hyper-globalization toward a multipolar structure. Trade wars, sanctions, supply-chain security concerns, and regional alliances are reshaping global commerce.
The US–China strategic rivalry has forced companies to rethink production bases, leading to “China+1” strategies that benefit countries like India, Vietnam, and Mexico. Energy security concerns following geopolitical conflicts have altered global energy markets, increasing volatility in oil, gas, and power prices. Markets now react not only to economic data but also to diplomatic statements, elections, and military developments.
4. The Rise of India and Emerging Markets Selectivity
Emerging markets are no longer treated as a single block. Investors are increasingly selective, favoring economies with strong domestic demand, political stability, reform momentum, and demographic advantages. India stands out as a major beneficiary of this shift due to its manufacturing push, digital infrastructure, and expanding middle class.
At the same time, countries with high external debt, weak currencies, or political instability face capital outflows. This differentiation marks a clear departure from earlier cycles when global liquidity lifted all emerging markets together.
5. Technology as a Structural Market Driver
Technological disruption remains a powerful force, but the market narrative has matured. Artificial intelligence, automation, semiconductors, cloud computing, and data centers are no longer speculative themes—they are becoming core infrastructure of the global economy.
Unlike past tech cycles, current investments are capital-intensive and energy-dependent, linking technology markets closely with commodities, power, and industrial supply chains. This has created new cross-sector correlations, where chipmakers, utilities, and metals move together based on AI-driven demand expectations.
6. Capital Rotation and Sectoral Shifts
Global markets are witnessing continuous capital rotation rather than broad-based rallies. Leadership shifts frequently between sectors such as technology, energy, defense, financials, and healthcare depending on macro conditions.
Defensive sectors gain favor during growth slowdowns, while cyclicals outperform during recovery phases. Value investing has regained relevance, as higher interest rates penalize long-duration growth assets. This environment favors active management, tactical allocation, and shorter investment cycles.
7. Currency Markets and the Strong-Dollar Effect
Currency markets play a crucial role in the current global shift. A strong US dollar, driven by higher interest rates and safe-haven demand, impacts global trade, commodity prices, and emerging-market capital flows. Countries with dollar-denominated debt face added pressure, while export-oriented economies experience mixed effects.
At the same time, some nations are attempting to reduce reliance on the dollar for trade settlements, signaling long-term changes in the global monetary system—even if the dollar remains dominant for now.
8. Investor Psychology and Market Volatility
Perhaps the most understated shift is psychological. Markets have moved from complacency to constant recalibration. Volatility is no longer an exception but a feature. News cycles are faster, algorithmic trading amplifies moves, and sentiment shifts rapidly based on data and narratives.
Retail participation, social media influence, and real-time information flow have made markets more reflexive. This demands stronger risk management, disciplined position sizing, and a focus on probability rather than certainty.
9. Sustainability and Energy Transition Repricing Assets
Climate policy and energy transition are no longer fringe considerations. Investments in renewable energy, electric vehicles, carbon markets, and grid infrastructure are reshaping capital expenditure globally. However, the transition is uneven, keeping fossil fuels relevant longer than expected.
This dual-track energy system creates both risks and opportunities, leading to structural repricing across utilities, metals, mining, and energy sectors.
Conclusion: Adapting to the New Market Regime
The global market shift underway is not a temporary cycle—it represents a change in regime. Higher interest rates, geopolitical complexity, technological transformation, and selective globalization are redefining how markets function. The key takeaway for investors and traders is adaptability.
Success in this environment requires deeper macro understanding, sectoral awareness, risk discipline, and flexibility. Rather than relying on one-directional trends, market participants must navigate rotations, volatility, and structural changes. Those who recognize and adapt to this new global market reality will be better positioned to manage risk and capture long-term opportunities in a rapidly evolving world.

Cross-Asset Correlation Trades: A Comprehensive Guide1. Understanding Correlation in Financial Markets
Correlation measures the degree to which two assets move in relation to each other. It ranges from +1 (perfect positive correlation) to –1 (perfect negative correlation), with 0 indicating no linear relationship.
Positive correlation: Assets move in the same direction (e.g., equities and high-yield bonds during risk-on phases).
Negative correlation: Assets move in opposite directions (e.g., equities and government bonds during risk-off periods).
Low or unstable correlation: Assets move independently or relationships change over time.
In cross-asset trading, correlation is not treated as a fixed constant. It is dynamic, influenced by macroeconomic conditions, liquidity cycles, monetary policy, and geopolitical events.
2. Why Cross-Asset Correlation Trades Matter
Traditional single-asset strategies often fail during regime shifts—such as financial crises or rapid policy changes. Cross-asset correlation trades help traders:
Identify macro themes earlier than price-based signals alone
Hedge portfolio risk by balancing exposures across asset classes
Exploit dislocations when historical correlations temporarily break down
Improve risk-adjusted returns through relative-value positioning
For example, when equities rally but bond yields fail to rise (breaking the usual equity–yield correlation), it may signal hidden economic stress or central bank intervention—creating a trading opportunity.
3. Key Asset Class Relationships
a) Equities and Bonds
One of the most important cross-asset relationships.
In risk-off environments, equities fall while bonds rise (negative correlation).
In inflationary or tightening cycles, both may fall together as yields rise.
Traders exploit this by positioning in equity indices versus bond futures, or through spread trades based on expected changes in correlation.
b) Currencies and Commodities
Commodity-exporting countries often see their currencies correlated with commodity prices.
Example: Oil prices and currencies like CAD or NOK
Gold often shows an inverse relationship with the US dollar
Correlation trades here may involve going long a commodity while shorting or longing the related currency.
c) Equities and Volatility (VIX)
Equity markets typically have a strong negative correlation with volatility.
Falling markets → rising volatility
Stable or rising markets → falling volatility
Traders use this relationship for hedging, tail-risk strategies, or mean-reversion trades when volatility misprices equity risk.
d) Rates and Equities
Interest rate expectations influence equity valuations.
Rising rates can pressure growth stocks
Falling rates often support risk assets
Cross-asset traders watch yield curves and rate futures to anticipate equity sector rotations.
4. Types of Cross-Asset Correlation Trades
a) Relative Value Trades
These trades bet on the convergence or divergence of correlated assets.
Example: Long equities and short bonds if growth is accelerating faster than priced in
The focus is not absolute direction but relative performance.
b) Correlation Breakdown Trades
When a historically strong correlation weakens or reverses, traders may position for normalization.
Example: Gold falling despite a weakening dollar may signal temporary market distortion
These trades require strong risk management because correlations can structurally change.
c) Risk-On / Risk-Off Trades
Global markets often move in synchronized “risk-on” or “risk-off” regimes.
Risk-on: Equities up, commodities up, bonds down, safe-haven currencies weaken
Risk-off: Equities down, bonds up, gold up, safe-haven currencies strengthen
Traders position baskets of assets rather than single instruments.
d) Hedging and Overlay Strategies
Institutional investors use cross-asset correlations to hedge portfolios.
Equity exposure hedged with bond duration or volatility
Currency risk hedged based on macro correlations
These trades are defensive but critical for capital preservation.
5. Tools and Models Used
Rolling correlation analysis to track how relationships evolve over time
Principal Component Analysis (PCA) to identify dominant macro drivers
Regression models linking asset returns to macro variables
Intermarket charts comparing ratios (e.g., equity index vs bond futures)
Quantitative models are often combined with discretionary macro judgment, as pure statistics can fail during regime shifts.
6. Risks in Cross-Asset Correlation Trading
Despite their appeal, these trades carry unique risks:
Correlation instability: Relationships that held for years can suddenly break
Policy intervention risk: Central bank actions can distort natural market linkages
Crowded trades: Popular correlation bets can unwind violently
Timing risk: Correlation may be correct, but the trade may be early
Successful traders treat correlations as probabilities, not certainties.
7. Role of Macro Cycles and Regimes
Cross-asset correlations are highly regime-dependent:
Low inflation, accommodative policy: Strong equity–bond negative correlation
High inflation: Bonds and equities may fall together
Crisis periods: Correlations often spike toward 1 as liquidity dries up
Understanding the macro regime is more important than relying on long-term historical averages.
8. Who Uses Cross-Asset Correlation Trades?
Hedge funds: Global macro and relative-value funds
Proprietary trading desks
Large institutional investors managing multi-asset portfolios
Advanced retail traders with access to derivatives and global markets
These participants view markets as a single interconnected system, not isolated silos.
9. Conclusion
Cross-asset correlation trades represent a sophisticated approach to navigating modern financial markets. By focusing on the relationships between asset classes rather than individual price movements, traders gain deeper insight into macroeconomic forces, risk sentiment, and structural market shifts. While correlations are powerful tools, they are not static laws. Success in cross-asset trading requires continuous monitoring, strong risk management, and an understanding of the broader economic regime.

Global Economic Indicators and Macro Data Trading1. Key Global Economic Indicators
Gross Domestic Product (GDP):
GDP measures the total economic output of a country and is one of the most widely tracked indicators. It reflects the health of an economy by capturing consumption, investment, government spending, and net exports. Traders closely monitor quarterly GDP releases to gauge economic growth trends, predict central bank policy moves, and assess equity, bond, and currency market reactions. For instance, a higher-than-expected GDP growth can strengthen a country’s currency and boost risk assets, while weaker growth may trigger rate cuts or quantitative easing.
Inflation Metrics (CPI, PPI, Core Inflation):
Inflation, particularly measured via the Consumer Price Index (CPI) and Producer Price Index (PPI), is central to monetary policy decisions. Core inflation, which excludes volatile items like food and energy, is often used by central banks to determine interest rate trajectories. High inflation can signal the need for tightening monetary policy, leading to stronger currencies and potentially lower bond prices. Conversely, low inflation may prompt stimulus, boosting equities and credit markets. Traders react instantly to inflation surprises, especially when these deviate from consensus forecasts.
Employment Data:
Employment statistics, including the unemployment rate, non-farm payrolls (NFP) in the U.S., and participation rates, provide insight into the labor market’s health. Strong employment growth suggests robust consumer spending potential, which can influence equity indices, commodity demand, and currency valuations. In contrast, rising unemployment often indicates economic slowdown, prompting central bank interventions. Traders often look at NFP and jobless claims as high-impact events, driving short-term volatility in forex, equities, and interest rate derivatives.
Interest Rates and Central Bank Policy:
Central banks play a decisive role in the financial ecosystem through interest rate adjustments, forward guidance, and quantitative easing programs. Key central banks like the U.S. Federal Reserve, European Central Bank (ECB), Bank of England, Bank of Japan, and Reserve Bank of India influence global liquidity and capital flows. Traders analyze rate decisions, policy statements, and economic projections to forecast currency movements, bond yields, and equity valuations. Unexpected policy changes often trigger sharp market reactions, creating both risks and opportunities for macro traders.
Trade Balance and Current Account:
Trade-related indicators, such as the balance of trade, exports, and imports, provide insights into a country’s external sector health. A trade surplus typically supports the local currency, while a deficit may weaken it. Additionally, current account figures reflect the broader cross-border capital flows, guiding investors on sovereign debt sustainability and FX risk. Macro traders monitor these indicators to anticipate currency trends, particularly in export-driven economies like Germany, China, and Japan.
Manufacturing and Service Sector Activity (PMI):
Purchasing Managers’ Index (PMI) for manufacturing and services sectors is a forward-looking economic indicator. PMIs above 50 signify expansion, while values below 50 indicate contraction. Traders use PMI data to assess business confidence, anticipate GDP trends, and estimate monetary policy responses. Sector-specific PMI can also guide equity sector rotation strategies, such as overweighting industrials or financials based on economic momentum.
Consumer and Business Sentiment Surveys:
Sentiment surveys like the University of Michigan Consumer Sentiment Index, Conference Board Consumer Confidence Index, and business outlook surveys provide a qualitative assessment of economic expectations. These metrics are closely watched because they often foreshadow spending and investment behavior, influencing equity, bond, and commodity markets. Positive sentiment generally fuels risk-on trades, while pessimistic sentiment drives safe-haven flows.
2. Macro Data Trading Strategies
Macro data trading involves analyzing and interpreting these economic indicators to make informed trading decisions. Traders use a combination of fundamental analysis, technical setups, and sentiment monitoring to capture opportunities created by macroeconomic releases.
Event-Driven Trading:
Traders position themselves ahead of scheduled macroeconomic events, such as central bank meetings, GDP releases, or employment reports. Strategies include straddles in forex markets, interest rate futures trading, or options hedging to manage risk while profiting from high volatility.
Trend Following Based on Macro Themes:
Long-term macro traders identify structural economic trends, such as rising interest rates, demographic shifts, or commodity cycles, and align their positions accordingly. For instance, a prolonged period of U.S. rate hikes may strengthen the dollar against emerging market currencies, prompting traders to adopt directional positions in forex or sovereign bonds.
Relative Value Trades:
Macro traders often exploit discrepancies between countries’ economic performance or central bank policies. For example, if the Eurozone shows weak growth while the U.S. exhibits robust GDP and inflation, a trader might go long on USD/EUR. These trades rely on comparative analysis of macro indicators and yield differentials.
Cross-Asset Macro Trading:
Macroeconomic data can impact multiple asset classes simultaneously. Traders use correlations across equities, bonds, commodities, and currencies to implement diversified strategies. For instance, rising inflation may depress bond prices, strengthen commodity markets, and create sector rotation in equities from growth to value stocks.
3. Risks and Challenges
Macro data trading is inherently challenging due to the complexity and unpredictability of economic events. Key risks include:
Data Revisions: Initial releases of macro data are often revised, which can reverse market reactions.
Market Expectations vs. Reality: The market reacts not to raw data but to deviations from consensus forecasts, making sentiment and positioning crucial.
Geopolitical and External Shocks: Trade wars, conflicts, pandemics, or unexpected policy decisions can override fundamental indicators, creating sudden volatility.
Liquidity Risks: During high-impact macro events, spreads widen, and slippage increases, especially in less liquid currencies or bond markets.
Successful macro traders mitigate these risks through disciplined risk management, diversification, scenario analysis, and constant monitoring of global economic trends.
4. Technological and Analytical Tools
Modern macro data trading relies heavily on technology. Traders use:
Economic Calendars: To track upcoming releases and consensus forecasts.
Quantitative Models: To simulate scenarios, price assets, and forecast market reactions.
Sentiment Analytics: Leveraging news, social media, and data feeds to gauge market psychology.
Algorithmic Trading Systems: For rapid execution during high-volatility macro events, especially in forex and interest rate markets.
Machine learning and artificial intelligence are increasingly applied to identify patterns in macro data and predict market responses more efficiently, reducing reliance on human interpretation alone.
5. Conclusion
Global economic indicators are the lifeblood of financial markets, providing a roadmap for understanding macroeconomic conditions, monetary policy, and investor sentiment. Macro data trading is a sophisticated discipline that combines analytical rigor, strategic positioning, and real-time responsiveness to navigate market volatility. By interpreting GDP, inflation, employment, trade, and sentiment data, traders can anticipate market trends, hedge risks, and exploit arbitrage opportunities across asset classes. However, success requires not only technical skills and economic knowledge but also adaptability, patience, and disciplined risk management in an ever-evolving global financial landscape. As globalization deepens and markets become increasingly interconnected, macro data trading will remain an indispensable tool for achieving informed, strategic, and profitable trading decisions.

Unlocking Long-Term Wealth Through Worldwide Opportunities🌍 Invest Globally for Growth:
In an increasingly interconnected world, investing globally has moved from being an optional diversification strategy to a powerful engine for long-term growth. Limiting investments to a single country exposes portfolios to concentrated economic, political, and currency risks. By contrast, global investing allows investors to participate in innovation, demographic expansion, and economic cycles across multiple regions, significantly enhancing growth potential while reducing overall risk. “Invest Globally for Growth” is not just a strategy—it is a mindset that recognizes wealth creation as a worldwide phenomenon.
1. Why Global Investing Matters
Economic growth does not occur evenly across the globe. While developed markets such as the United States, Europe, and Japan offer stability and innovation, emerging and frontier markets often deliver faster growth driven by urbanization, rising middle classes, technological leapfrogging, and favorable demographics. By investing globally, investors can access these growth engines rather than relying solely on domestic opportunities.
Global investing also mitigates country-specific risks. Political instability, regulatory changes, economic slowdowns, or sectoral downturns in one nation can severely impact domestic-only portfolios. Exposure to multiple economies ensures that weaknesses in one region may be offset by strength in another.
2. Developed Markets: Stability and Innovation
Developed economies remain the backbone of global portfolios due to their mature financial systems, strong corporate governance, and global market leaders. The United States, for example, dominates in technology, artificial intelligence, pharmaceuticals, and capital markets. Europe offers strengths in luxury goods, renewable energy, and industrial automation, while Japan excels in robotics, precision manufacturing, and automotive technology.
Investing in developed markets provides:
Lower volatility compared to emerging markets
Reliable earnings growth
Strong shareholder protections
Exposure to global multinational corporations
These markets are particularly suitable for core portfolio holdings aimed at steady long-term compounding.
3. Emerging Markets: High Growth Potential
Emerging markets are the growth engines of the global economy. Countries such as India, China, Brazil, Indonesia, and Vietnam are experiencing rapid economic expansion fueled by young populations, rising consumption, digital transformation, and infrastructure development.
Key growth drivers include:
Expanding middle-class consumption
Digital payments, e-commerce, and fintech adoption
Manufacturing shifts due to global supply-chain diversification
Government-led infrastructure and industrial policies
While emerging markets come with higher volatility, currency fluctuations, and political risks, they also offer superior long-term growth potential. Strategic allocation to emerging markets can significantly enhance portfolio returns when managed with discipline.
4. Sector-Based Global Growth Opportunities
Global investing is not only about geography—it is also about accessing the world’s most promising sectors. Certain industries are global by nature and grow regardless of national boundaries.
Key global growth sectors include:
Technology & AI: Silicon Valley, China, Israel, and South Korea
Renewable Energy & EVs: Europe, China, and the US
Healthcare & Biotechnology: US, Switzerland, and Germany
Semiconductors: Taiwan, South Korea, and the US
Infrastructure & Industrials: India, Southeast Asia, and the Middle East
By investing globally, investors can own the best companies in each sector, rather than being limited to domestic champions.
5. Currency Diversification: A Hidden Advantage
Currency exposure is often overlooked but plays a crucial role in global investing. Holding assets denominated in different currencies provides a natural hedge against domestic currency depreciation. For investors in emerging economies, global investing—particularly in USD or EUR assets—can help preserve purchasing power over the long term.
Currency diversification:
Reduces dependence on one currency
Protects against inflation and devaluation
Enhances risk-adjusted returns over long horizons
While short-term currency movements can add volatility, long-term global exposure often proves beneficial.
6. Investment Vehicles for Global Exposure
Modern investors have multiple ways to invest globally without complexity:
Global Mutual Funds & ETFs: Easy access to diversified international portfolios
Country-Specific Funds: Targeted exposure to high-growth regions
Sectoral Global ETFs: Focus on themes like AI, clean energy, or healthcare
Direct Equity Investing: For experienced investors seeking specific opportunities
International REITs & Bonds: Income and diversification beyond equities
Choosing the right vehicle depends on risk appetite, investment horizon, and expertise.
7. Risk Management in Global Investing
While global investing enhances growth potential, risk management is essential. Key risks include geopolitical tensions, regulatory changes, liquidity constraints, and market volatility. A disciplined approach involves:
Diversifying across regions and sectors
Avoiding overexposure to any single country
Rebalancing portfolios periodically
Maintaining a long-term investment horizon
Using staggered investments (SIP or phased allocation)
Successful global investing is not about timing markets but about time in the market.
8. Role of Global Investing in Long-Term Wealth Creation
Historically, some of the world’s most successful companies and investment themes have emerged outside investors’ home countries. Investors who embraced global exposure early benefited from trends such as US tech dominance, China’s manufacturing boom, and global renewable energy adoption.
Global investing aligns perfectly with long-term goals such as:
Retirement planning
Inflation-beating wealth creation
Intergenerational wealth transfer
Capital preservation with growth
It transforms portfolios from locally dependent to globally resilient.
9. The Future of Global Growth Investing
The future will be shaped by cross-border innovation, digital economies, climate transition, and shifting geopolitical alliances. Supply chains are becoming more diversified, opening new opportunities across Asia, Africa, and Latin America. Technological adoption is accelerating globally, narrowing gaps between developed and emerging markets.
Investors who think globally will be better positioned to capture these evolving opportunities, while those who remain domestically focused may miss out on transformational growth trends.
10. Conclusion: Think Global, Grow Global
“Invest Globally for Growth” is a forward-looking strategy that recognizes the world as a single investment universe. By combining stability from developed markets with the dynamism of emerging economies and global sectors, investors can build resilient, high-growth portfolios suited for the future.
