Why Consistency Beats Talent in TradingWelcome all to another post! In today's post we will review the difference between Talented trading and consistent trading.
Why Consistency Beats Talent in Trading
Many new traders usually enter trading believing that success belongs to the most intelligent individuals, the most analytical, or the most “naturally gifted.” In any field.
When in reality, the market only rewards something that is far less glamorous, and that is.. consistency.
Talent can help you understand charts faster and/or grasp concepts a lot quicker, but it is consistency that determines and shows whether you survive long enough to become profitable and make a positive return.
Talent Creates Potential | Consistency Creates Results
Talent shows up early, like in the first week or two.
You might spot patterns instantly, win a few trades, or feel like trading “just makes sense” to you.
Consistency shows up later and it’s far rarer.
The market does not care how smart you are.
It only responds to:
- How often you follow your rules and system.
- How well you manage risk ( or gamble it. )
- How disciplined you are under pressure and stress
- A talented trader who trades emotionally will eventually lose, ( always lose. )
- A consistent trader with average skills can compound them steadily over time.
Why Talented Traders Often Struggle
Ironically, talent can be a disadvantage ( keep on reading )
Talented traders often:
- Rely on intuition instead of their own rules or the games rules ( or common sense. )
- Take trades outside their plan ( like above, not following their rules. )
- Increase risk after a few wins ( again, not following RM rules. )
- Ignore data because “ they feel confident ”
This leads to inconsistency big wins followed by bigger losses. ( Gambling )
The market eventually punishes anyone who treats probability like certainty.
Consistency Turns Probability into an Edge
Trading is not about being right it’s about commencing the same process over and over.
Consistency means:
- Taking only the setups you’ve defined. (Defined what A+ is)
- Risking the same amount per trade. (Risk Management)
- Accepting losses without deviation. (Moving on after a loss)
- Following your plan even after losing streaks. (Maintaining consistency)
One trade means nothing.
A hundred trades executed the same way reveal your edge.
Consistency allows probability to work for you, not against you.
The Market Rewards Discipline, Not Brilliance
The best traders in the world are not constantly trying to outsmart the market.
They:
- Trade fewer setups
- Keep their approach simple
- Protect capital first
- Let time and repetition do the work
- They understand that survival is the first goal.
- You can’t compound an account you’ve blown.
Consistency Is Boring and That’s the Point
Consistencty lacks excitement.
There are no adrenaline rushes, no heroic trades, no all-in moments.
Just repetition, patience, and restraint. This is why most people fail.
The market filters out those who chase excitement and rewards those who treat trading like a business, not entertainment.
Talent Without Consistency Is Temporary
Many traders experience early success.
Very few maintain it.
Short-term success often comes from:
- Favorable market conditions
- Random luck
- Overconfidence
Long-term success comes from:
- Process
- Risk control
- Emotional discipline
Consistency is what turns a good month into a sustainable career.
How to Build Consistency as a Trader
Consistency is a skill not a personality trait.
You build it by:
- Defining clear trading rules
- Using fixed risk per trade
- Journaling every trade honestly
- Reviewing performance regularly
- Trading less, not more
Your goal isn’t to be impressive.
Your goal is to be repeatable.
Final Thoughts
Talent may get you interested in trading.
Consistency keeps you in the game.
In a profession driven by uncertainty, the trader who shows up the same way every day will always outperform the one chasing brilliance.
In trading, consistency doesn’t just beat talent > it replaces it.
Thank you all so much for reading, I hope everyone enjoys it and that it benefits you all!
Let me know in the comments below if you have any questions or requests.
Learning
Reading institutional intentions through Volume ProfileReading institutional intentions through Volume Profile
Price moves where money flows. Simple truth that most traders overlook the most obvious source of money information: volume.
Volume Profile shows where trading happened. Not when, but where. The histogram on the side reveals which levels attracted buyers and sellers. While beginners draw support lines by candle wicks, money flows elsewhere.
Value zones versus noise zones
Point of Control (POC) marks the price level with maximum trading volume for the period. Price spent most time here. Buyers and sellers agreed on this price. Fair value at this moment.
Value Area covers 70% of traded volume. Boundaries of this zone show where the market considers the asset undervalued or overvalued. Price gravitates back to Value Area like a magnet.
Look at the practice. Price broke the high, everyone expects growth. Check Volume Profile—volume on the breakout is tiny. Big players didn't participate. Fake breakout. Price will return.
High Volume Node and Low Volume Node
HVN appears as thick sections on the profile. Many transactions, lots of liquidity. Price slows down at HVN, reverses, consolidates. These are market anchors.
LVN shows as thin sections. Few transactions, little liquidity. Price flies through LVN like a hot knife through butter. Nothing to grab onto there.
Traders often place stops behind HVN. Big players know this. Sometimes price deliberately hits those stops to accumulate positions. Called stop hunt .
Profile types and their meaning
P-shaped profile: one wide POC in the middle, volume distributed evenly. Market in balance. Breaking boundaries of such profile produces strong moves.
b-shaped profile: volume shifted to the bottom. Buyers active at low levels. Accumulation before growth.
D-profile: volume at the top. Distribution before decline. Big players exit positions.
Using profile in trading
Find areas with low volume between zones of high volume. LVN between two HVNs creates a corridor for fast price movement. Enter at HVN boundary, target the next HVN.
When price moves outside Value Area boundaries and volume appears there—trend gains strength. New value zone forms. Old levels stop working.
If price returns to old Value Area after strong movement—look for reversal. Market rejects new prices.
Session profiles versus weekly ones
Daily profile shows where trading happened today. Weekly shows where positions accumulated all week. Monthly gives the picture of big money distribution.
Profiles of different periods overlay each other. Daily profile POC can match weekly Value Area boundary. Strong zone. Price will react here.
On futures, account for session times:
Asian session forms its profile
European forms its own
American forms its own, with heavier volume weight
Profile rotation
Price migrates between value zones. Old Value Area becomes support or resistance for the new one. Last week's POC works as a magnet on current week.
When profiles connect—market consolidates. When they separate—trend begins.
Volume and volatility
Low volume at some level means price didn't linger there. Passed quickly. On return to this level, reaction will be weak.
Volume grows at range boundaries. Battle of buyers and sellers happens there. Winner determines breakout direction.
Composite profile
Built from several trading days. Shows where main battle happened over the period. Removes noise of individual days. Picture becomes clearer.
Composite profile helps find long-term support and resistance zones. Monthly composite shows levels institutional traders will work from all next month.
Many traders build Volume Profile directly on Trading View charts. Adjust the period, watch volume distribution, plan trades.

Trading Seasonality: When the Calendar Matters More Than NewsTrading Seasonality: When the Calendar Matters More Than News
Markets move not just on news and macroeconomics. There are patterns that repeat year after year at the same time. Traders call this seasonality, and ignoring it is like trading blindfolded.
Seasonality works across all markets. Stocks, commodities, currencies, and even cryptocurrencies. The reasons vary: tax cycles, weather conditions, financial reporting, mass psychology. But the result is the same — predictable price movements in specific months.
January Effect: New Year, New Money
January often brings growth to stock markets. Especially for small-cap stocks.
The mechanics are simple. In December, investors lock in losses for tax optimization. They sell losing positions to write off losses. Selling pressure pushes prices down. In January, these same stocks get bought back. Money returns to the market, prices rise.
Statistics confirm the pattern. Since the 1950s, January shows positive returns more often than other months. The Russell 2000 index outperforms the S&P 500 by an average of 0.8% in January. Not a huge difference, but consistent.
There's a catch. The January effect is weakening. Too many people know about it. The market prices in the pattern early, spreading the movement across December and January. But it doesn't disappear completely.
Sell in May and Go Away
An old market saying. Sell in May, come back in September. Or October, depending on the version.
Summer months are traditionally weaker for stocks. From May to October, the average return of the US market is around 2%. From November to April — over 7%. Nearly four times higher.
There are several reasons. Trading volumes drop in summer. Traders take vacations, institutional investors reduce activity. Low liquidity amplifies volatility. The market gets nervous.
Plus psychology. Summer brings a relaxed mood. Less attention to portfolios, fewer purchases. Autumn brings business activity. Companies publish reports, investors return, money flows back.
The pattern doesn't work every year. There are exceptions. But over the past 70 years, the statistics are stubborn — winter months are more profitable than summer.
Santa Claus Rally
The last week of December often pleases the bulls. Prices rise without obvious reasons.
The effect is called the Santa Claus Rally. The US market shows growth during these days in 79% of cases since 1950. The average gain is small, about 1.3%, but stable.
There are many explanations. Pre-holiday optimism, low trading volumes, purchases from year-end bonuses. Institutional investors go on vacation, retail traders take the initiative. The mood is festive, no one wants to sell.
There's interesting statistics. If there's no Santa Claus rally, the next year often starts poorly. Traders perceive the absence of growth as a warning signal.
Commodities and Weather
Here seasonality works harder. Nature dictates the rules.
Grain crops depend on planting and harvest. Corn prices usually rise in spring, before planting. Uncertainty is high — what will the weather be like, how much will be planted. In summer, volatility peaks, any drought or flood moves prices. In autumn, after harvest, supply increases, prices fall.
Natural gas follows the temperature cycle. In winter, heating demand drives prices up. In summer, demand falls, gas storage fills, prices decline. August-September often give a local minimum. October-November — growth before the heating season.
Oil is more complex. But patterns exist here too. In summer, gasoline demand rises during vacation season and road trips. Oil prices usually strengthen in the second quarter. In autumn, after the summer peak, correction often follows.
Currency Market and Quarter-End
Forex is less seasonal than commodities or stocks. But patterns exist.
Quarter-end brings volatility. Companies repatriate profits, hedge funds close positions for reporting. Currency conversion volumes surge. The dollar often strengthens in the last days of March, June, September, and December.
January is interesting for the yen. Japanese companies start their new fiscal year, repatriate profits. Demand for yen grows, USD/JPY often declines.
Australian and New Zealand dollars are tied to commodities. Their seasonality mirrors commodity market patterns.
Cryptocurrencies: New Market, Old Patterns
The crypto market is young, but seasonality is already emerging.
November and December are often bullish for Bitcoin. Since 2013, these months show growth in 73% of cases. Average return is about 40% over two months.
September is traditionally weak. Over the past 10 years, Bitcoin fell in September 8 times. Average loss is about 6%.
Explanations vary. Tax cycles, quarterly closings of institutional funds, psychological anchors. The market is young, patterns may change. But statistics work for now.
Why Seasonality Works
Three main reasons.
First — institutional cycles. Reporting, taxes, bonuses, portfolio rebalancing. Everything is tied to the calendar. When billions move on schedule, prices follow the money.
Second — psychology. People think in cycles. New year, new goals. Summer, time to rest. Winter, time to take stock. These patterns influence trading decisions.
Third — self-fulfilling prophecy. When enough traders believe in seasonality, it starts working on its own. Everyone buys in December expecting a rally — the rally happens.
How to Use Seasonality
Seasonality is not a strategy, it's a filter.
You don't need to buy stocks just because January arrives. But if you have a long position, seasonal tailwind adds confidence. If you plan to open a short in December, seasonal statistics are against you — worth waiting or looking for another idea.
Seasonality works better on broad indices. ETFs on the S&P 500 or Russell 2000 follow patterns more reliably than individual stocks. A single company can shoot up or crash in any month. An index is more predictable.
Combine with technical analysis. If January is historically bullish but the chart shows a breakdown — trust the chart. Seasonality gives probability, not guarantee.
Account for changes. Patterns weaken when everyone knows about them. The January effect today isn't as bright as 30 years ago. Markets adapt, arbitrage narrows.
Seasonality Traps
The main mistake is relying only on the calendar.
2020 broke all seasonal patterns. The pandemic turned markets upside down, past statistics didn't work. Extreme events are stronger than seasonality.
Don't average. "On average, January grows by 2%" sounds good. But if 6 out of 10 years saw 8% growth and 4 years saw 10% decline, the average is useless. Look at median and frequency, not just average.
Commissions eat up the advantage. If a seasonal effect gives 1-2% profit and you pay 0.5% for entry and exit, little remains. Seasonal strategies work better for long-term investors.
Tools for Work
Historical data is the foundation. Without it, seasonality is just rumors.
Backtests show whether a pattern worked in the past. But past doesn't guarantee future. Markets change, structure changes.
Economic event calendars help understand the causes of seasonality. When quarterly reports are published, when dividends are paid, when tax periods close.
Many traders use indicators to track seasonal patterns or simply find it convenient to have historical data visualization right on the chart.

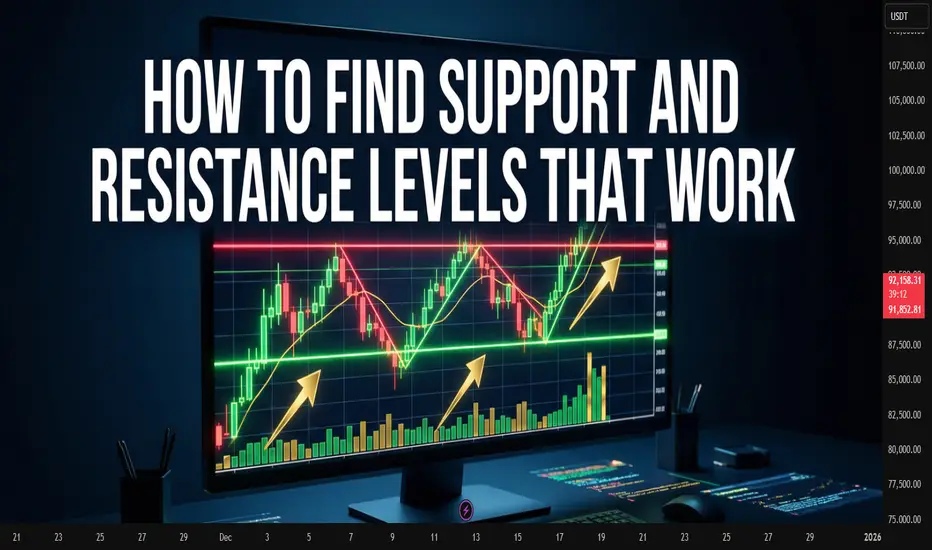
How to Find Support and Resistance Levels That Actually WorkHow to Find Support and Resistance Levels That Actually Work
Price never moves in a straight line. It bounces off invisible barriers, pauses, reverses. These barriers are called support and resistance levels.
Sounds simple. But traders often draw lines where they don't exist. Or miss truly strong zones. Let's figure out how to find levels where price reacts again and again.
What Support and Resistance Are
Imagine a ball thrown in a room. It hits the floor and ceiling. The floor is support, the ceiling is resistance.
Support works from below. When price falls to this zone, buyers activate. They consider the asset cheap and start buying. The decline slows or stops.
Resistance works from above. Price rises, reaches a certain height, and sellers wake up. Some lock in profits, others think the asset is overvalued. Growth slows down.
Why Levels Work at All
Thousands of traders look at the same chart. Many see the same reversal points in the past.
When price approaches this zone again, traders remember. Some place pending buy orders at support. Others prepare to sell at resistance. It becomes a self-fulfilling prophecy.
The more people noticed the level, the stronger it is.
Where to Look for Support and Resistance
Start with weekly or daily charts. Zoom out to see history for several months or years.
Look for places where price reversed multiple times. Not one bounce, but two-three-four. The more often price reacted to a level, the more reliable it is.
Look at round numbers. Trader psychology works so that levels like 100, 1000, 50 attract attention. Orders cluster around these marks.
Look for old highs and lows. A 2020 peak can become resistance in 2025. A crisis bottom turns into support a year later.
Drawing Levels Correctly
A level is not a thin line. It's a zone several points or percent wide.
Price rarely bounces from an exact mark. It can break through a level by a couple of points, collect stop-losses and return. Or stop a bit earlier.
Draw a horizontal line through candle bodies, not through wicks. Wicks show short-term emotional spikes. The candle body is where price closed. Where traders agreed on a compromise.
Don't clutter your chart with a hundred lines. Keep 3-5 most obvious levels. If you drew 20 lines, half of them don't work.
How to Check Level Strength
Count touches. Three bounces are more reliable than one. Five bounces - that's a powerful zone.
Look at volume. If there's lots of trading at a level, it confirms its significance. Large volume shows major players are active here.
Pay attention to time. A level that worked five years ago may lose strength. Fresh levels are usually stronger than old ones.
When a Level Breaks
A breakout happens when price closes beyond the level. Not just touched with a wick, but closed.
After a breakout, support becomes resistance. And vice versa. This is called polarity shift. Traders who bought at old support now sit in losses and wait for return to entry point to exit without losses.
A breakout must be confirmed. One candle beyond the level is not a breakout yet. Wait for the day to close, check volume, verify price didn't return.
False breakouts happen all the time. Major players deliberately knock out stops to collect liquidity.
Common Mistakes
Traders draw levels on small timeframes. A five-minute chart is full of noise. Levels from hourly or daily charts work better.
Traders ignore context. Support in an uptrend is stronger than in a downtrend. Resistance in a falling market breaks easier.
Traders enter exactly at the level. Better to wait for a bounce and confirmation. Price can break through a level by several points, knock out your stop, then reverse.
Diagonal Levels
Support and resistance aren't only horizontal. Trendlines work as dynamic levels.
In an uptrend, draw a line through lows. Price will bounce from this line upward.
In a downtrend, connect highs. The line becomes dynamic resistance.
Trendlines break just like horizontal levels. A trendline break often signals a trend reversal.
Combining with Other Tools
Levels don't work in isolation. Their strength grows when they coincide with other signals.
A level at a round number + cluster of past bounces + overbought zone on an oscillator - this is a powerful combination for finding reversals.
Traders often add technical indicators to their charts to help confirm price reaction at levels. This makes analysis more reliable and reduces false signals.
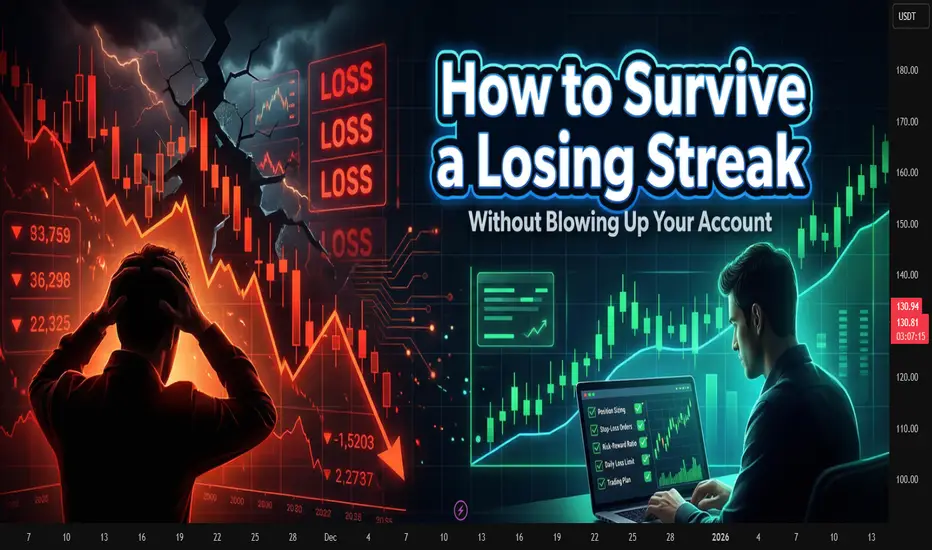
How to survive a losing streak without blowing up your accountHow to survive a losing streak without blowing up your account
Drawdown hits the account, but the real damage lands in your head.
A real trading career always includes stretches of pure red. Five, seven, even ten losses in a row can appear without anything "being wrong" with the setup. At that point the market stops looking like candles and levels, and starts looking like a personal enemy. Without a plan written in advance, the usual reaction is to increase size and "win it back."
The drawdown itself is not the main threat. The danger sits in what happens inside the drawdown: revenge trades, oversized positions, random entries just to feel in control again.
Turn the losing streak into numbers
The feeling "everything goes wrong" is vague and dangerous. Numbers are less emotional.
Simple tracking is enough:
Current drawdown in percent from the equity peak
Number of losing trades in a row
Total hit of the streak in R (risk units per trade)
Example: risk per trade is 1%, and you take five consecutive stops. That is -5%. With a personal limit of 10% drawdown, the account is still alive, but the mind is already tense. At that point the numbers matter more than mood. They show whether there is still room to act or time to stop and regroup.
Why losing streaks bend your thinking
The market does not change during a streak. The trader does.
Typical thoughts:
"The strategy is dead" after only a few stops
Desire to prove to the market that you were right
Sudden shift from clear setups to anything that "might move"
In reality it is normal distribution at work. Losses cluster. Most traders know that in theory, but very few accept it in advance and prepare a plan for that specific phase.
Build a risk frame for bad runs
Risk rules for streaks should live in writing, not in memory.
For example:
Define 1R as 0.5–1% of account size
Daily loss limit in R
Weekly loss limit in R
Conditions for a mandatory trading pause
A simple version:
1R = 1%
Stop trading for the day once -3R is reached
Stop trading for the week once -6R is reached
After a weekly stop, take at least two market sessions off from active trading
This does not make performance look pretty. It simply keeps one emotional spike from turning into a full account blow-up.
A protocol for losing streaks
Rules are easier to follow when they read like a checklist, not a philosophy.
Sample protocol:
After 3 consecutive losses: cut position size in half for the rest of the day
After 4 consecutive losses: stop trading for that day
After 5 or more consecutive losses: take at least one full day off and do only review and backtesting
Return to normal size only after a small series of well-executed trades where rules were respected
Printed rules next to the monitor work better than "mental promises." In stress the brain does not recall theory, it reads whatever sits in front of the eyes.
A drawdown journal
A regular trade log tracks entries and exits. During drawdowns you need an extra layer dedicated to the streak.
For each drawdown period, you can record:
Start date and equity at the beginning
Maximum drawdown in percent and in R
Main source of damage: risk, discipline, setup quality, or flat market conditions
Any mid-streak changes to the original plan
Outside factors such as sleep, stress, or heavy workload
After some months, the journal starts to show patterns. Many discover that the deepest drawdowns came not from the market, but from trading while tired, distracted, or under pressure outside the screen.
Coming back from a drawdown
The drawdown will end. The key part is the exit from it. Jumping straight back to full size is an easy way to start a new streak of losses.
You can describe the return process in stages:
Stage 1. One or two days off from live trading. Only review, markups, statistics.
Stage 2. Half-size positions, only the cleanest setups, strict cap on trade count.
Stage 3. Back to normal risk after a short series of trades where rules were followed, even if the profit is modest.
The drawdown is over not when the equity line prints a new high, but when decisions are again based on the plan instead of the urge to "get it all back."
Where tools and indicators help
A big part of the pressure in a streak comes from the mental load: levels, trend filters, volatility, news, open positions. That is why many traders rely on indicator sets that highlight key zones, measure risk to reward, send alerts when conditions line up, and reduce the need to stare at the screen all day. These tools do not replace discipline, but they take some of the routine off your plate and give more energy for the hard part: staying calm while the equity curve is under water.
A daily trading plan: stop trading your moodA daily trading plan: stop trading your mood and start trading your system
Most traders think they need a new strategy. In many cases they need a clear plan for the day.
Trading without a plan looks very similar across accounts. The platform opens, eyes lock onto a bright candle, the button gets pressed. Then another one. The mind explains everything with words like “intuition” or “feel for the market”, while the journal in the evening shows a pile of unrelated trades.
A daily plan does not turn trades into perfection. It removes chaos. The plan covers charts, risk, loss limits, number of trades and even the trader’s state. With that in place, the history starts to look like a series of experiments instead of casino slips.
Skeleton of a daily plan
A practical way is to split the day into five blocks:
market overview from higher timeframes
watchlist for the session
risk and limits
scenarios and entry checklist
post-session review
The exact form is flexible. The important part is to write it down instead of keeping it in memory.
Market overview: higher timeframe sets the background
The day starts on the higher chart, not on the one-minute screen. H4, D1 or even W1. That is where major swings, large reaction zones and clear impulses live.
A small template helps:
main asset of the day, for example BTC or an index
current phase: directional move or range
nearest areas where a larger player has strong reasons to act
Descriptions work best when they are concrete. Not “bullish market”, but “three higher lows in a row, shallow pullbacks, buyers defend local demand zones”. A month later these notes show how thinking about trend and risk evolved.
Watchlist: stop chasing every ticker
Next layer is a focused list of instruments. With less experience, a shorter list often works better. Two or three names are enough for the day.
Selection can rely on simple filters:
recent activity instead of a dead flat chart
structure that is readable rather than random noise
enough liquidity for clean entries and exits
Once the list is fixed, outside movement loses some emotional grip. Another coin can fly without you, yet the plan keeps attention on the few markets chosen for that day.
Risk and limits: protection from yourself
This block usually appears only after a painful streak. Until then the brain likes the story about “just this one time”.
Minimal set:
fixed percentage risk per trade
daily loss limit in R or percent
cap on number of trades
For example, 1% per trade, daily stop at minus 3R, maximum of 5 trades. When one of these lines is crossed, trading stops even if the chart shows a beautiful setup. That stop is not punishment. It is a guardrail.
Breaking such rules still happens. With written limits, each violation becomes visible in the journal instead of dissolving in memory.
Scenarios and entry checklist
After the bigger picture and limits are set, the plan moves to concrete scenarios. Clarity beats variety here.
For every instrument on the list, write one or two scenarios:
area where a decision on price is expected
direction of the planned trade
SEED_ALEXDRAYM_SHORTINTEREST2:TYPE of move: breakout, retest, bounce
[*stop and targets in R terms
Example: “ETHUSDT. H4 in an uptrend, H1 builds a range under resistance. Plan: long on breakout of the range, stop behind the opposite side, target 2–3R with partial exit on fresh high.”
An entry checklist keeps emotions in check.
$ trade goes with the higher-timeframe narrative
$ stop stands where the scenario breaks, not “somewhere safer”
$ position size matches the risk rules
$ trade is not revenge for a previous loss
If at least one line fails, entry is postponed. That small pause often saves the account from “just testing an idea”.
Post-session review: where real learning sits
The plan lives until the terminal closes. Then comes the review. Not a long essay, more like a short debrief.
Screenshots help a lot: entry, stop, exit marked on the chart, with a short note nearby.
was there a scenario beforehand
did the market behave close to the plan
which decisions looked strong
where emotions took over
Over several weeks, this archive turns into a mirror. Profitable setups repeat and form a core. Weak habits step into the light: size jumps after a loss, early exits on good trades, stop removal in the name of “room to breathe”.
Where indicators fit into this routine
None of this strictly requires complex tools. A clean chart and discipline already move the needle. Many traders still prefer to add indicators that highlight trend, zones, volatility and risk-to-reward, and ping them when price enters interesting regions. That kind of automation cuts down on routine work and makes it easier to follow the same checklist every day. The decision to trade still stays with the human, while indicators quietly handle part of the heavy lifting in the background.

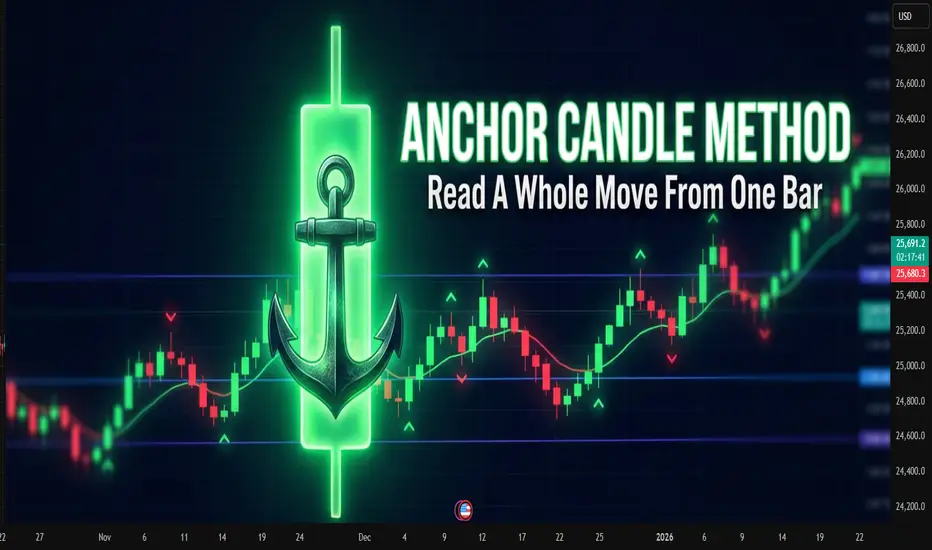
Anchor Candle MethodAnchor Candle Method: How To Read A Whole Move From One Bar
Many traders drown in lines, zones, patterns. One simple technique helps simplify the picture: working around a single “anchor candle", the reference candle of the pulse.
The idea is simple: the market often builds further movement around one dominant candle. If you mark up its levels correctly, a ready-made framework appears for reading the trend, pullbacks and false breakouts.
What is an anchor candle
Anchor candle is a wide range candle that starts or refreshes an impulse. It does at least one of these:
Breaks an important high or low
Starts a strong move after a tight range
Flips local structure from “choppy” to “trending”
Typical traits:
Range clearly larger than nearby candles
Close near one edge of the range (top in an up impulse, bottom in a down impulse)
Comes after compression, range or slow grind
You do not need a perfect definition in points or percent. Anchor candle is mostly a visual tool. The goal is to find the candle around which the rest of the move “organizes” itself.
How to find it on the chart
Step-by-step routine for one instrument and timeframe:
Mark the current short-term trend on higher timeframe (for example 1H if you trade 5–15M).
Drop to the working timeframe.
Find the last strong impulse in the direction of that trend.
Inside this impulse look for the widest candle that clearly stands out.
Check that it did something “important”: broke a range, cleared a local high/low, or started the leg.
If nothing stands out, skip. The method works best on clean impulses, not on flat, overlapping price.
Key levels inside one anchor candle
Once the candle is chosen, mark four levels:
High of the candle
Low of the candle
50% of the range (midline)
Close of the candle
Each level has a function.
High
For a bullish anchor, the high acts like a “ceiling” where late buyers often get trapped. When price trades above and then falls back inside, it often marks a failed breakout or liquidity grab.
Low
For a bullish anchor, the low works as structural invalidation. Deep close under the low tells that the original impulse was absorbed.
Midline (50%)
Midline splits “control”. For a bullish anchor:
Holding above 50% keeps control with buyers
Consistent closes below 50% shows that sellers start to dominate inside the same candle
Close
Close shows which side won the battle inside that bar. If later price keeps reacting near that close, it confirms that the market “remembers” this candle.
Basic trading scenarios around a bullish anchor
Assume an uptrend and a bullish anchor candle.
1. Trend continuation from the upper half
Pattern:
After the anchor candle, price pulls back into its upper half
Pullback holds above the midline
Volume or volatility dries up on the pullback, then fresh buying appears
Idea: buyers defend control above 50%. Entries often come:
On rejection from the midline
On break of a small local high inside the upper half
Stops usually go under the low of the anchor or under the last local swing inside it, depending on risk tolerance.
2. Failed breakout and reversal from the high
Pattern:
Price trades above the high of the anchor
Quickly falls back inside the range
Subsequent candles close inside or below the midline
This often reveals exhausted buyers. For counter-trend or early reversal trades, traders:
Wait for a clear close back inside the candle
Use the high of the anchor as invalidation for short setups
3. Full loss of control below the low
When price not only enters the lower half, but closes below the low and stays there, the market sends a clear message: the impulse is broken.
Traders use this in two ways:
Exit remaining longs that depended on this impulse
Start to plan shorts on retests of the low from below, now as resistance
Bearish anchor: same logic upside-down
For a bearish anchor candle in a downtrend:
Low becomes “trap” level for late sellers
High becomes invalidation
Upper half of the candle is “shorting zone”
Close and midline still help to judge who controls the bar
The structure is mirrored, the reading logic stays the same.
Practical routine you can repeat every day
A compact checklist many traders follow:
Define higher-timeframe bias
On working timeframe, find the latest clear impulse in that direction
Pick the anchor candle that represents this impulse
Mark high, low, midline, close
Note where price trades relative to these levels
Decide: trend continuation, failed breakout, or broken structure
This method does not remove uncertainty. It just compresses market noise into a small set of reference points.
Common mistakes with anchor candles
Choosing every bigger-than-average candle as anchor, even inside messy ranges
Ignoring higher timeframe bias and trading every signal both ways
Forcing trades on each touch of an anchor level without context
Keeping the same anchor for days when the market already formed a new impulse
Anchor candles age. Fresh impulses usually provide better structure than old ones.
A note about indicators
Many traders prefer to mark such candles and levels by hand, others rely on indicators that highlight wide range bars and draw levels automatically. Manual reading trains the eye, while automated tools often save time when many charts and timeframes are under review at once.
New Year rally: a seasonal move without the fairy taleNew Year rally: a seasonal move without the fairy tale
The “New Year rally” sounds like free money on holidays. In reality it is just a seasonal pattern that sometimes helps and sometimes only pushes traders into random entries.
The point is to understand what qualifies as a rally, when it usually appears, and how to plug it into an existing system instead of trading by calendar alone.
What traders call a New Year rally
A New Year rally is usually described as a sequence of trading sessions with a clear bullish bias in late December and in the first days of January.
Typical features:
several days in a row with closes near daily highs
local highs on indexes and leading names get taken out
stronger appetite for risk assets
sellers try to push back but fail to create real follow-through
On crypto the picture is less clean, but the logic is similar: toward year end, demand for risk often increases.
Why markets tend to rise into year end
The drivers are very down to earth.
Funds and year-end reports
Portfolio managers want their performance to look better on the final statement. They add strong names and trim clear losers.
Tax and position cleanup
In markets where taxes are tied to the calendar year, some players close losing trades earlier, then come back closer to the holidays with fresh positioning.
Holiday mood
With neutral or mildly positive news flow, participants are more willing to buy. Any positive surprise on rates, inflation, or earnings gets amplified by sentiment.
Lower liquidity
Many traders and funds are away. Order books are thinner and big buyers can move price more easily.
When it makes sense to look for it
On traditional stock markets, traders usually watch for the New Year rally:
during the last 5 trading days of December
during the first 2–5 trading days of January
On crypto there is no strict calendar rule. It helps to track:
behavior of major coins
dominance shifts
whether the trend is exhausted or still fresh
A practical trick: mark the transition from December to January for several past years on the chart and see what your market actually did in those windows.
How to avoid turning it into a lottery
A simple checklist before trading a “seasonal” move:
higher timeframes show an uptrend or at least a clear pause in the prior selloff
main indexes or key coins move in the same direction instead of diverging
no fresh, heavy supply zone sitting just above current price
risk per trade is fixed in advance: stop, position size, % of equity
exit plan exists: partial take-profit levels and a clear invalidation point
If one of these items fails, it is better to treat the move as market context, not an entry signal.
Common mistakes in New Year rallies
entering just because the calendar says “late December”
doubling position size “to catch the move before holidays”
buying right at the end of the impulse when distribution has already started
skipping the stop because “they will not dump the market into New Year”
Seasonal patterns never replace risk management. A setup that does not survive March will not magically improve in December.
A note on indicators and saving time
Many traders prefer not to redraw the whole market every December. It is convenient when an indicator highlights trend, key zones and momentum, and the trader only has to read the setup. In that case New Year rallies become just one more pattern inside a consistent framework, not a separate holiday legend.

Crypto diversification checklist for your portfolioCrypto diversification checklist for your portfolio
When the market runs hot, it feels tempting to dump all capital into one coin that moves right now. The story usually ends the same way. Momentum fades, the chart cools down, and the whole account depends on one or two tickers. Diversification does not make every decision perfect. It simply keeps one mistake from breaking the account.
What a diversified crypto portfolio really means
Many traders call a mix of three alts and one stablecoin a diversified basket. For crypto it helps to think in a few clear dimensions:
asset type: BTC, large caps, mid and small caps, stablecoins
role in the portfolio: capital protection, growth, high risk
sector: L1, L2, DeFi, infrastructure, memecoins and niche themes
source of yield: spot only, staking, DeFi, derivatives
The more weight sits in one corner, the more the whole portfolio depends on a single story.
Checklist before adding a new coin
1. Position size
One coin takes no more than 5–15% of total capital
The total share of high risk positions stays at a level where a drawdown does not knock the trader out emotionally
2. Sector risk
The new coin does not fully copy risk you already have: same sector, same ecosystem, same news driver
If the portfolio already holds many DeFi names, another similar token rarely changes the picture
3. Liquidity
Average daily volume is high enough to exit without massive slippage
The coin trades on at least two or three major exchanges, not on a single illiquid venue
The spread stays reasonable during calm market hours
4. Price history
The coin has lived through at least one strong market correction
The chart shows clear phases of accumulation, pullbacks and reactions to news, not only one vertical candle
Price does not sit in a zone where any small dump is enough to hurt the whole account
5. Counterparty risk
Storage is clear: centralized exchange, self-custody wallet, DeFi protocol
Capital is not concentrated on one exchange, one jurisdiction or one stablecoin
There is a simple plan for delisting, withdrawal issues or technical outages
6. Holding horizon
The time frame is defined in advance: scalp, swing, mid term, long term build
Exit rules are written: by price, by time or by broken thesis, not only “I will hold until it goes back up”
Keeping the structure stable
Diversification helps only when the rules stay in place during noise and sharp moves. A simple base mix already gives a frame:
core: BTC and large caps, 50–70%
growth: mid caps and clear themes, 20–40%
experiments: small caps and new stories, 5–10%
cash and stablecoins for fresh entries
Then the main routine is to rebalance back to these ranges every month or quarter instead of rebuilding the whole portfolio after each spike.
A short note on tools
Some traders keep this checklist on paper or in a spreadsheet. Others rely on chart tools that group coins by liquidity, volatility or correlation and highlight weak spots in the structure. The exact format does not matter. The key is that the tool makes it easy to run through the same checks before each trade and saves time on charts instead of adding more noise. Many traders simply lean on indicators for this routine work because it feels faster and more convenient.
Chasing the last train: how late entries ruin good trendsChasing the last train: how late entries ruin good trends
The picture is familiar.
The asset has already made a strong move, candles line up in one direction, chats are full of profit screenshots.
Inside there is only one thought: "I am late".
The buy or sell button is pressed not from a plan, but from fear of missing out.
This is how a classic "last train" entry is born.
This text breaks down how to spot that moment and how to stop turning each impulse into an expensive ticket without a seat.
How the last train looks on a chart
This situation has clear signs.
Long sequence of candles in one direction with no healthy pullback.
Acceleration of price and volatility compared to previous swings.
Entry happens closer to a local high or low than to any level.
Stop is placed "somewhere below" or moved again and again.
The mind focuses on other people’s profit, not on the original plan.
In that state the trader reacts to what already happened instead of trading a prepared setup.
Why chasing the move hurts the account
The problem is not just "bad luck".
Poor risk-reward .
Entry sits near an extreme. Upside or downside left in the move is small, while a normal stop needs wide distance. In response there is a temptation to push the stop further just to stay in.
Large players often exit there .
For them the trend started earlier. Where retail opens first positions, they scale out or close a part of the move.
Strategy statistics get distorted .
A system can work well when entries come from levels and follow a plan. Once late emotional trades appear in the mix, the math changes even if the historical chart still looks nice.
How to notice that the hand reaches for the last train
Knowing your own triggers helps.
This symbol was not in the morning watchlist, attention appeared only after a sharp spike.
The decision comes from news or chat messages, not from calm chart work.
There is no clear invalidation level, the stop sits "somewhere here".
Many timeframes blink at once, the view jumps from 1 minute to 15 minutes and back.
Inner talk sounds like "everyone is already in, I am the only one outside".
If at least two of these points match, the trade is most likely not part of the core system.
Simple rules against FOMO
Work goes not with the emotion itself, but with the frame around trades.
No plan, no trade .
A position opens only if the scenario existed before the spike. Fresh "brilliant" ideas during the impulse are placed into the journal, not into the order book.
Move distance limit .
Decide in advance after what percentage move from a key zone the setup becomes invalid.
For example: "if price travels more than 3–4 percent away from the level without a retest, the scenario is cancelled, next entry only after a pause and new base".
Trade from zones, not from the middle of the impulse .
Plans are built around areas where a decision makes sense, not around the fastest part of a candle.
Time filter .
After a sharp move, add a small pause.
Five to fifteen minutes with no new orders, only observation and notes.
What to do when the move has already gone
The smart choice is not "grab at least something".
Better to:
save a screenshot of the move;
mark where the trend started to speed up;
write down whether this symbol was in the plan and why;
prepare a setup for a pullback or the next phase, where entry comes from a level, not from the middle of noise.
Then the missed move turns into material for the system instead of three revenge trades in a row.
A short checklist before pressing the button
Was this symbol in the plan before the run started.
Do I see the exact point where the idea breaks and is the stop parked there.
Is the loss size acceptable if this trade repeats many times.
Can I repeat the same entry one hundred times with the same rules.
If any line sounds weak, skipping this "train" often saves both money and nerves.
The market will send new ones. The task is not to jump into every car, but to board the ones that match the timetable of the trading plan.

How to choose what to invest inHow to choose what to invest in: a practical checklist for traders and investors
Many beginners start with the question “What should I buy today?” and skip a more important one: “What role does this money play in my life in the next years?”
That is how portfolios turn into random collections of trades and screenshots.
This text gives you a compact filter for picking assets. Not a magic list of tickers, just a way to check whether a coin, stock or ETF really fits your time horizon, risk and skill level.
Start from your life, not from the chart
Asset selection starts before you open a chart. First, you need to see how this money fits into your real life.
Three simple points help:
When you might need this money: in a month, in a year, in five years.
How painful a 10, 30 or 50 % drawdown feels for you.
How many hours per week you truly give to the market.
Example. Money is needed in six months for a mortgage down payment. A 15 % drawdown already feels terrible. Screen time is 2 hours per week. In this case, aggressive altcoins or heavy leverage look more like a stress machine than an investment tool.
Another case. Ten-year horizon, regular contributions, stable income from a job, 30 % drawdown feels acceptable. This profile can hold more volatile assets, still with clear limits on risk.
Filter 1: you must understand the asset
First filter is simple and strict: you should be able to explain the asset to a non-trader in two sentences.
The label is less important: stock, ETF, coin or future. One thing matters: you understand where the return comes from. Growth of company profit. Coupon on a bond. Risk premium on a volatile market. Fees and staking rewards in a network.
If your explanation sounds like “price goes up, everyone buys”, this is closer to magic than to a plan. Better to drop this asset from the list and move on to something more clear.
Filter 2: risk and volatility
The market does not care about your comfort. You can care about it by choosing assets that match your stress level.
Key checks:
Average daily range relative to price. For many crypto names, a 5–10 % daily range is normal. Large caps in stock markets often move less.
Historical drawdowns during market crashes.
Sensitivity to events: earnings, regulator news, large players.
The sharper the asset, the smaller its weight in the portfolio and the more careful the position size. The same asset can be fine for an aggressive profile and a disaster for a conservative one.
Filter 3: liquidity
Liquidity stays invisible until you try to exit.
Look at three things:
Daily traded volume. For active trading, it is safer to work with assets where daily volume is many times larger than your typical position.
Spread. Wide spread eats money on both entry and exit.
Order book depth. A thin book turns a big order into a mini crash.
Filter 4: basic numbers and story
Even if you are chart-first, raw numbers still help to avoid extremes.
For stocks and ETFs, it helps to check:
Sector and business model. The company earns money on something clear, not only on a buzzword in slides.
Debt and margins. Over-leveraged businesses with thin margins suffer in stress periods.
Dividends or buybacks, if your style relies on cash coming back to shareholders.
For crypto and tokens:
Role of the token. Pure “casino chip” tokens rarely live long.
Emission and unlocks. Large unlocks often push price down.
Real network use: transactions, fees, projects building on top.
Build your personal checklist
At some point it makes sense to turn filters into a short checklist you run through before each position.
Example:
Time. I know the horizon for this asset and how it fits my overall money plan.
Risk. Risk per position is no more than X % of my capital, portfolio drawdown stays inside a level I can live with.
Understanding. I know where the return comes from and what can break the scenario.
Liquidity. Volume and spread allow me to enter and exit without huge slippage.
Exit plan. I have a level where the scenario is invalid and levels where I lock in profit, partly or fully.
Connect it with the chart
On TradingView you have both charts and basic info in one place, which makes this checklist easier to apply.
A typical flow:
Use a screener to find assets that match your profile by country, sector, market cap, volatility.
Open a higher-timeframe chart and see how the asset behaved in past crashes.
Check liquidity by volume and spread.
Only then search for an entry setup according to your system: trend, level, pullback, breakout and so on.
Before clicking the button, run through your checklist again.
Common traps when choosing assets
A few classic traps that ruin even a good money management system:
Blindly following a tip from a chat without knowing what the asset is and why you are in it.
All-in on one sector or one coin.
Heavy leverage on short horizons with low experience.
Averaging down without a written plan and clear risk limits.
Ignoring currency risk and taxes.
This text is for educational purposes only and is not investment advice. You are responsible for your own money decisions.

Reading market regime: trend, range or chaos on a single chartReading market regime: trend, range or chaos on a single chart
Many traders treat every chart the same. Same setup, same stop, same expectations. Then one week the pattern works, the next week it bleeds the account.
In practice, the pattern rarely is the real problem. The problem is that the same pattern behaves differently in different market regimes.
First read the regime. Then trust the pattern.
This article focuses on a simple way to classify any chart into three regimes and adjust entries, stops and targets to match the environment.
What “market regime” really means
Forget academic definitions. For a discretionary trader, market regime is simply how price usually behaves on this chart in the recent swings.
A practical split into three buckets:
Trend: price prints higher highs and higher lows, or lower highs and lower lows. Pullbacks respect moving averages or previous structure. Breakouts tend to continue.
Range: price bounces between clear support and resistance. False breaks are frequent. Mean reversion works better than breakouts.
Chaos: candles with long wicks, overlapping bodies, fake breaks in both directions, no clear structure. Liquidity is patchy, stop hunts are common.
The goal is not perfect classification. The goal is to avoid trading a “trend playbook” in a chaotic zone and a “range playbook” in a strong trend.
Three quick checks for any chart
Before opening a trade, run three very simple checks on the last 50–100 candles.
1. Direction of swings
Mark the last 3–5 swing highs and lows with your eyes.
If highs and lows step clearly in one direction, you have a trend.
If highs and lows repeat in the same zones, you have a range.
If swings are messy and overlap, you are closer to chaos.
2. How price reacts to levels
Pick obvious zones that price touched several times.
Clean tests with clear rejection and follow through support the range idea.
Small pauses and then continuation support the trend idea.
Spikes through levels with no follow through point to chaos.
3. Noise inside candles
Look at wicks and bodies.
Moderate wicks and healthy bodies often belong to a stable trend.
Many doji-like candles and long wicks on both sides are classic noisy conditions.
After these three checks, label the chart in your journal: trend, range or chaos. Do not overthink it. One clear label is enough for each trade.
How to adapt the trade to the regime
Same signal, different execution.
Trend regime
Direction: trade only with the main direction of recent swings.
Entry: focus on pullbacks into previous structure or into dynamic zones like moving averages, not on chasing the breakout spike.
Stop: behind the last swing or behind the structure that invalidates the trend.
Target: allow more distance, at least 2R and more while the trend structure holds.
Range regime
Direction: buy near support, sell near resistance. Ignore mid-range.
Entry: wait for rejection from the edge of the range. Wick rejection or failed breakout is often better than a blind limit order.
Stop: behind the range boundary, where the range idea clearly dies.
Target: either the opposite side of the range or a “safe middle” if volatility is low.
Chaos regime
Size: cut risk per trade or stay flat.
Timeframe: either move to higher timeframe to filter noise or skip the instrument.
Goal: defense, not growth. The main job here is to avoid feeding the spread and slippage.
Use a journal to find your best regime
Add one extra column to your trading journal: “regime”. For each trade, assign one of three labels before entry.
After 30–50 trades, group the results by regime. Many traders discover that:
Trends give the main profit.
Ranges give small but stable gains.
Chaos slowly eats everything.
Once this pattern becomes visible in numbers, discipline around regimes stops being an abstract rule. It turns into a very practical filter.
Conclusion
A setup without a regime filter is half a system.
Start every analysis with a simple question to the chart: trend, range or chaos. Then apply the playbook that fits this environment, instead of forcing the same behaviour from the market every day.

5 Key Trading Tips for BeginnersWelcome back everyone to another post! In this article we will be explaining 5 key pointers (tips) for new individuals entering the trading space.
When it comes to trading first there is “ understanding ” before we begin the 5 keys steps. Let me assist you in understanding what will happen when you take on trading.
Trading is a challenge. Not a video game challenge, not a math test challenge – a * Challenge * One that will break you. Trading will break you mentally, physically, spiritually and financially. It is an eye-opening journey.
Trading will teach you a lot about yourself, and it will teach you a lot about discipline, patience and how you can analyze markets.
I saw a quote somewhere, it said trading: “ Trading is the hardest way, to make easy money ” and they are right.
You will be learning how to manage risk, control your emotions, understand your own decision-making patterns. These are all invaluable lessons for life, as well as trading.
Sounds great! But then there are the losses, what you lose to gain all this. Trading isn’t something that you can learn overnight – all those posts you see about a young 17-year-old “ cracking the code ” is rubbish. Why? Because they haven’t learnt life lessons.
You can make money fast, but you will lose it faster if you don’t know how to manage it.
Trading will drain every bit of energy out of you. You will feel like you’re falling behind, you will eventually collapse at every loss and become frustrated. The market will test you; the market doesn’t give a damn about you – you accept the risk when you take on trading and since you’re the one making the trades, it’s you VS you.
You’re testing yourself. You agree to test your patience, your confidence, your mindset. Doing so will make progress feel nonexistent or slow.
Every day, and every trade you will question yourself, wondering if “trading” is even for you. Sometimes it will feel like you’re going in circles. You will continue to make mistakes repeatedly. It will become exhausting but remember – only experience and your own strengths will allow you to succeed. Only those who can endure the grind without giving up will make it.
So, let’s start off the 5 key pointers that will prepare you.
1) Prioritize Risk Management Over Profits:
Most newbies focus first on “ making money ” rather than safeguarding capital. The reality is that surviving in the market is way more important than winning every trade you see or come across.
Key Points:
Determine risk per trade: A common rule is risking no more than 1-2% of your trading account on a single trade. This way even a string of losses will not wipe you out.
Always use stoploss: A defined maximum loss per trade enforces discipline and emotions to stay in check.
Position sizing: Your sizing should be proportional to what you’re willing to lose on each trade. Bigger trades amplify the losses, but they also amplify the profits.
Why it matters:
Without strong risk management, even a high win-rate strategy can fail. Protecting capital ensures you’re still in the game when opportunities arise.
2) Develop a trading plan and stick to it .
Random reactive trading is the best way to lose money. Build your plan overtime.
Key points:
Define your strategy: Building your strategy is the longest part, constant back testing and forward testing, refining and rebuilding. You’re not “switching” your strategy if you’re adding something small to it, you’re changing it if you eliminate the whole thing.
Identify your form of trades, short, mid, long term or swing trades.
Set clear rules: Don’t leave anything to chance, for example “I only enter trades if price closes above the 50ema and RSI is above 50”
Journalling trades: Ensure to journal all your trades, “How do I journal” Easy. Record the time, date, symbol, pair, what model/system you used, images, your entry, tp and exit, why and for how long you’ll have it open.
Why it matters:
Consistency is a key, it pairs with discipline, psychology and lingers with risk management. Traders who follow a disciplined system perform better than those to trade off an impulsive feeling. Other words “Gamble”
3) Master one market and one system first:
Beginners usually spread themselves too thin, trying forex, crypto, stocks and commodities all at once – Unfortunately for me I made this mistake at the start which made it very difficult! – Don’t do this. Stick to one market.
Key points:
Pick one market: Each market has its own rhythm, volatility, and liquidity. Teaching one thoroughly allows you to understand everything about it.
Focus on one system: Instead of trying every new system from you tubes or forums, master one approach and refine it onwards e.g. – you trade FVGs, Win rate is 50% once you add Fibonacci it might be e.g. 65%
Avoid information overload: Social media and trading forums are filled with conflicting advice, stick to your chosen approach and refine it. People say you need to have 12-hour trading days. If you do this, you will FAIL. You will grind yourself into the ground and face burnout making it very difficult to get back up again. Limit yourself to how much trading and trading study you do a day. Eg 10 back test trades, 3 real trades, 3 journaled trades, 1 hour of studying and researching the market.
Without strong risk management, even a high win-rate strategy can fail. Protecting capital ensures you’re still in the game when opportunities arise.
Why it matters
Depth beats breadth early on. Mastering a single market and system will allow you to build confidence and improve your edge.
4) Understand the Psychology of trading.
Trading isn’t just numbers: as mentioned in “understanding” it’s a test of emotional control, fear, greed and impatience.
Key points:
Emotions vs logic: ensure you recognize emotional reactions like FOMO (Fear of missing out) or revenge trading. Pause before reacting to a trade that will go against you.
Set realistic expectations : Markets move slowly. Sometimes for months, don’t expect huge gains overnight. Just like DCA focus on compounding. Compound your knowledge and skill set.
Mindset training: Techniques like medication and journaling as well as visualization can help reduce stress and maintain discipline.
Why it matters:
Even a diamond system can still fail if emotions drive your actions. Psychology often determines long term success, more than technical skill.
5) Prioritize learning. Then earning.
Beginners fall into the trap of trading being a “get rich quick” scheme. But the real investment is learning how the market works.
Key points:
Paper and demo trade first: Practice on demo accounts before you use real money – you will be surprised how many times you will fail. It’s better to fail with simulation money than your McDonalds weekly wage.
Review every trade: Analyze your losing trades, but also your winning trades. Find patterns and areas to improve.
Continuously educate yourself: Read books about the mind, about habits, watch market analysis but critically, apply what you learn and don’t just collect information and not use it.
Why it matters:
Earnings are just the byproduct trading. The faster you learn and adapt, the sooner your profits will appear. Treat early losses as tuition. Not failure.
Thank you all so much for reading.
I hope this benefits all those who are starting off their trading journey. If you have any questions, let me know in the comments below!

AI in Trading: Hype, Hope, and Hard Truths# TradingView Post: AI in Trading (TradingView Formatting)
"I just made a ChatGPT trading bot that's up 300% in backtests!"
I see this exact post at least 5 times a week. And every time, I know exactly how it ends—blown account, confused trader, and another person convinced that "AI doesn't work in trading."
Here's the uncomfortable truth: AI absolutely works in trading. Just not the way most people think.
The problem isn't the technology—it's that everyone's obsessed with the sexiest part (predicting the next candle) while ignoring the parts that actually make money.
After building dozens of systematic strategies for clients across crypto, forex, and equities, I've learned this: the hard part of trading isn't generating signals. It's managing risk, optimizing execution, and knowing when your edge has disappeared.
Let me show you where AI actually creates alpha—and why your "predictive model" probably won't.
━━━━━━━━━━━━━━━━━━━━━━
The Real Problem With AI Signal Generation
Before we get to what works, let's talk about why most AI trading bots fail:
The Data Problem:
Markets are non-stationary (the game changes constantly)
You need 10,000+ samples for reliable ML models
But market regimes shift every 200-500 bars
You're essentially training on data from a different game
The Overfitting Trap:
Your LSTM "learned" patterns that existed once and may never repeat
95% backtest accuracy? That's usually a red flag, not a green light
Walk-forward testing reveals most models have zero predictive power out-of-sample
The Competition Reality:
Renaissance Technologies has PhDs, decades of data, and billions in infrastructure
Your GPU and 2 years of OHLCV data isn't competing with that
By the time a pattern is obvious enough for simple ML to find, it's arbitraged away
Can pure signal generation work? Yes—but it's the hardest application of AI in trading, not the easiest.
━━━━━━━━━━━━━━━━━━━━━━
Where AI Actually Adds Value (The Unsexy Truth)
Here's what nobody tells you: institutional quant funds use AI heavily, just not for predicting price direction. They use it for the operational advantages that compound over thousands of trades.
1. Position Sizing & Risk Management
Traditional fixed-percentage position sizing (risk 2% per trade) ignores market reality. Sometimes 2% is too aggressive, sometimes it's leaving money on the table.
I've tested reinforcement learning models that dynamically adjust position sizes based on:
Current market volatility regime (VIX, ATR percentiles)
Correlation breakdown between portfolio assets
Recent strategy performance and drawdown depth
Portfolio heat distribution across sectors
Real result from a client system: 23% reduction in maximum drawdown vs. fixed sizing, with nearly identical total returns. The AI wasn't predicting price—it was predicting when the edge was strongest and sizing accordingly.
2. Execution Optimization
This is where prop shops and hedge funds actually deploy ML. Not for signals—for getting better fills.
What ML handles:
Predicting optimal order slicing (VWAP vs. TWAP vs. aggressive IOC)
Detecting liquidity windows in crypto markets (when to place limit orders vs. market orders)
Minimizing slippage on larger positions
Predicting short-term volatility spikes that would hurt execution
Practical example: A simple gradient boosting model analyzing order book depth, bid-ask spread, and recent volume patterns can save 5-15 basis points per trade. On a $100K position, that's $50-150 saved per execution. Over 1,000 trades per year? That's $50K-150K in improved performance.
3. Regime Detection & Strategy Allocation
Stop trying to predict the next candle. Instead, predict the type of market environment you're in.
Use unsupervised learning (K-means clustering, Hidden Markov Models, Gaussian Mixture Models) to identify:
High volatility vs. low volatility regimes
Trending vs. mean-reverting environments
Risk-on vs. risk-off sentiment periods
Correlation expansion/contraction across assets
Why this matters: A moving average crossover that prints money in trending markets will destroy your account in choppy, range-bound conditions. A mean reversion strategy that works beautifully in low volatility will get steamrolled during breakouts.
Implementation: Train an ensemble model on market features (volatility, correlation, volume patterns, momentum indicators). When it detects Regime A, allocate to Strategy Set 1. When it detects Regime B, switch to Strategy Set 2. When confidence is low, reduce exposure across the board.
4. Feature Engineering & Dynamic Signal Weighting
You have 50 technical indicators on your chart. Which ones actually matter right now ?
This changes constantly:
RSI works until the market trends hard, then it's a disaster
Volume patterns matter way more in crypto than traditional equities
Correlation indicators are useless until suddenly they're everything (crisis periods)
Different lookback periods perform differently across volatility regimes
ML solution: Use ensemble methods (Random Forests, XGBoost) to dynamically weight and combine signals based on recent regime and performance.
Instead of: "Buy when RSI < 30"
You get: "Buy when the ensemble model says momentum + volume + volatility features align, weighted by recent regime performance"
Client example: Combined 12 traditional strategies (each with proven edge) with an ML meta-strategy that allocated capital between them. The ML didn't find new edges—it figured out which existing edges to use when. Result: Sharpe ratio improved from 1.1 to 1.7 over 3 years live.
━━━━━━━━━━━━━━━━━━━━━━
The Hybrid Approach That Actually Works
After building systems that survive real markets (not just backtests), here's the architecture that works:
Layer 1 - Core Signals (Traditional Quant):
Mean reversion strategies based on statistical patterns
Momentum breakout systems with volume confirmation
Arbitrage opportunities and structural edges
These are your "alpha generators" with proven statistical edge
Layer 2 - AI Risk Management:
Reinforcement learning for dynamic position sizing
ML models for stop-loss placement and profit-taking
Volatility prediction for exposure adjustment
Layer 3 - AI Strategy Allocation:
Regime detection to switch between strategy sets
Performance-based weighting of different approaches
Correlation analysis for portfolio construction
Layer 4 - AI Execution:
Order optimization based on current liquidity
Slippage prediction and mitigation
Timing of trade execution within the day
Real system I deployed for a crypto client:
Core: 8 different mean reversion + momentum strategies (all traditionally backtested)
AI Layer: Reinforcement learning for position sizing based on volatility regime
ML Layer: Random forest classifier for regime detection (trending vs. ranging vs. high volatility)
Execution: Gradient boosting model for order placement timing
Result: Sharpe ratio improved from 1.2 to 1.8 over 3 years of live trading, max drawdown reduced by 31%
The AI didn't find magic price prediction patterns. It made better decisions about when to trade , how much to risk , and how to execute .
━━━━━━━━━━━━━━━━━━━━━━
What You Should Actually Build
If you're serious about AI in trading, here's my recommendation:
Start here (High ROI, Lower Difficulty):
Build a regime detection system first
Create position sizing rules that adapt to volatility
Optimize your execution (especially in crypto)
Test strategy allocation across different market conditions
Only then consider (High Difficulty, Questionable ROI):
Pure price prediction models
Red flags to avoid:
Any model with >90% backtest accuracy (probably overfit)
Systems that don't account for transaction costs and slippage
Strategies that haven't been walk-forward tested
Anything that can't explain why it should work
━━━━━━━━━━━━━━━━━━━━━━
The Bottom Line
If someone's selling you an AI system that "predicts market direction with 95% accuracy," run away. That's either overfitted garbage or a scam.
If someone's using AI to dynamically manage risk, optimize execution, detect regime changes, and intelligently allocate between proven strategies? That's actually how professionals use it.
The unsexy truth: The best use of AI in trading isn't prediction—it's decision-making around the edges that already exist.
Stop chasing the signal generation hype. Start thinking about the full trading pipeline. That's where the real alpha is hiding.
━━━━━━━━━━━━━━━━━━━━━━
💬 Question for the community: Are you using AI for signal generation or operational optimization? What's been your experience?
🔔 Follow for more quant reality checks—no hype, just data and systems that work in production
📩 Building systematic strategies that need to survive real markets? I specialize in risk-aware ML systems, hybrid quant approaches, and turning backtests into production-ready code. DM me to discuss your project.
━━━━━━━━━━━━━━━━━━━━━━

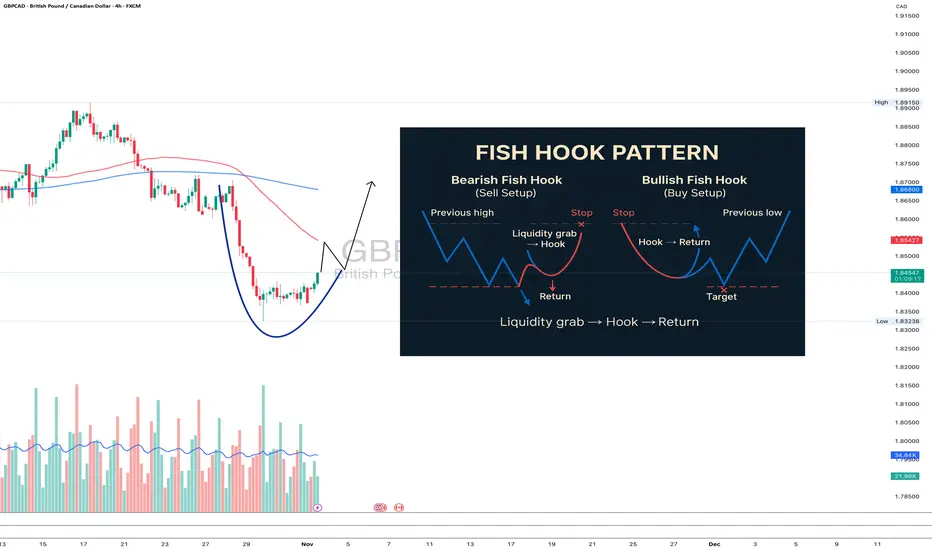
Fish Hook Pattern: the setup that catches liquidity, not tradersThere’s one pattern that never gets enough attention in textbooks, yet it’s one of the purest reflections of smart money logic - the Fish Hook.
It looks simple: price breaks out, triggers stops, traps breakout traders, and snaps back just as fast. But the psychology behind it is what makes it truly powerful.
When the market consolidates under a level, stop orders start to pile up. Big money knows that liquidity sits there - waiting to be taken. They push the price beyond the level, trigger the stops, and absorb liquidity. The breakout traders think they’ve caught momentum, but in reality, they’ve just become the exit liquidity.
Then comes the reversal - fast, decisive, emotional. That sharp return to the range is the “hook.”
If price breaks a key high or low and immediately rejects it - without structure, without a clean retest - you’re watching a Fish Hook in action.
The entry comes on the retest of that level from the opposite side. The stop goes right beyond the “hook’s tip.” Targets? The opposite edge of the range or the next liquidity pool.
The beauty of the Fish Hook lies in its simplicity. It’s not an indicator or a signal. It’s the behavior of money - watching how capital manipulates emotion.
When you start to see it often, you realize the market isn’t random. It’s intentional.
Trading becomes less about chasing candles and more about reading footprints. Fish Hook setups happen daily across pairs, stocks, and crypto and once you train your eye, you’ll never unsee them.
If your stops keep getting hit before the move - congratulations, you just met the Fish Hook from the wrong side.
Understanding Psychological LevelsDefinition:
In Trading, Psychological levels are often called round numbers or psy levels.
This is because the price ends in zeros and fives naturally attracting a trader’s attention.
Examples:
• Forex: 1.0000, 1.0500, 1.1000
• Stocks: $50, $100, $150, $200, $250
• Cryptocurrency: $10,000, $15,000, $20,000, $25,000
These levels are crucial as traders instinctively see targets in round numbers. (Or Incremental levels such as 5, 10, 15, 20, 25, 30 and so on...
This causes many buy, sell, and stop orders to cluster around the same price zones, creating self-reinforcing areas of interest in the market. Again, price sits at 113.2k – Psychological level is 115k.
___________________________________________________________________________________
Why Psychological Levels Matter in Trading
1) Human Bias:
Traders and investors often place orders at simple, rounded numbers. This makes their charts and order list “Clean.”
2) Institutional Targeting:
Large groups, whales or organizations use these levels to find liquidity or trigger stops. (Eg, BTC swept 125k before dumping)
3) Market Memory:
When a Psychological level reacts, traders remember it, and it often becomes relevant again in the future. (Turns into a prev liquidity sweep.)
5) Order Clustering:
Stop losses, take profits, and pending orders frequently build up around these areas. (As above, it builds liquidity.)
__________________________________________________________________________________
How to Identify Psychological Levels
Begin with marking clean, round (or quarterly) numbers on your chart. These are often major levels such as 4.0000, 5.0000, or 6.0000.
See the example below:
Then identify the midpoints/quarter points between them, like 4.5, 5.5, 6.5, 7.5, 8.5
See the example below:
For stronger assessments, look for psychological levels that align with other forms & tools of technical confluence—such as previous S & R, Supply/Demand, Highs & Lows, Fibonacci retracements, trendlines, or volume clusters.
See the example below:
When multiple forms of technical evidence converge near a round number, the level tends to have greater impact.
__________________________________________________________________________________
Trading Around Psychological Levels
When price approaches a psychological level, three common behaviors can occur:
1) Rejection:
Price touches the level and reverses quickly, suggesting strong defense by buyers or sellers. (Liquidity Sweep)
2) Break and Retest:
Price breaks through the level, then revisits it to confirm it as new support or resistance.
3) Compression or Grind:
Price consolidates near the level before a breakout as liquidity builds up.
Practical Application:
Enable alerts slightly before major psychological levels to observe reactions in real time (for example, 4.45 instead of 4.5 ). Wait for confirmation using price action such as a clear rejection wick, an engulfing candle, or a BOS (Break of Structure). Combine this analysis with liquidity or other forms of technical tools for a stronger assessment.
__________________________________________________________________________________
Trader Behavior at These Levels
Market reactions at psychological levels are largely directed by emotion and herd (Group) behavior. Fear of missing out can push price through a round number with momentum & speed while profit-taking can trigger short-term reversals & rejections. Stop hunts are also common, where smart money briefly pushes prices beyond a round level to collect liquidity before reversing. (From 4.0 up to 4.25 then down again)
Because many traders watch these same levels, reactions often repeat, reinforcing their significance.
__________________________________________________________________________________
Example: BTC/USD for $125k
When Bitcoin approaches $125k, many retail traders view it as a significant threshold. They might place short orders just below it or stop just above. Institutions recognize this and may intentionally push prices above $125k (sweeping $126k) to trigger those stops and fill large positions.
Once that liquidity is collected, price can reverse, and the $125k area may later serve as a new resistance zone.
This type of liquidity hunt and reversal pattern occurs frequently across all markets.
__________________________________________________________________________________
Practical Tips
1) Never trade purely based on a round number. Always wait for confirmation through structure or price action. (Retests, MSS, BOS, candle patterns etc)
2) Use alerts & alarms rather than fixed lines; prices often wick slightly above or below the exact level.
3) On higher timeframes, psychological levels often act as major turning zones. On lower timeframes, they tend to attract short-term reactions. (Lower the time frame, the more reactions = constant noise)
4) Combine psychological levels with liquidity, order flow, or volume analysis for a more complete view.
__________________________________________________________________________________
Summary
Psychological levels are where human reactions and liquidity meet. They represent areas of emotional and institutional/organizational interest rather than fixed points of reversal.
By understanding how traders behave around these zones and observing how price reacts to them, you can determine key movements with greater confidence.

Trader vs Gambler: Why Trading Isn’t GamblingThe Trader vs The Gambler: Why Trading Isn’t Gambling
“Trading is gambling.”
You’ve probably heard it before — from friends, family, or strangers who’ve seen a few flashy headlines, red charts, and crypto hype videos and decided: “It’s all luck.”
To most outsiders, the markets look like chaos — numbers flashing, candles flying, influencers shouting “BUY!” and “SELL!” as emotions run high.
It’s understandable that they think it’s all random chance.
But here’s the truth:
Trading can look like gambling when it’s done like gambling.
When done properly — with education, discipline, and structured risk — trading is a profession built on probability, process, and data.
What Trading Actually Is
Trading is the art and science of buying and selling assets — currencies, commodities, crypto, or stocks — to profit from price movements.
But unlike gambling, trading involves skill, timing, and measurable probabilities.
Professional traders don’t rely on hope — they rely on edges.
An edge is a repeatable setup or condition that statistically produces profits over time.
A real trader studies and uses:
- Price Action & Market Structure: Recognizing higher highs, liquidity zones, supply and demand, and where big players enter or exit.
- Technical Analysis : Tools like moving averages, Fibonacci retracements, volume profiles, VWAP, trendlines, and fair value gaps.
- Fundamental Analysis: Macro data, interest rates, inflation, earnings, tokenomics, project development, and regulatory events.
- Sentiment & Flow: Gauging crowd emotion, open interest, whale activity, and on-chain data.
- Risk Management: Strict position sizing, stop-loss placement, and capital preservation.
- Statistics & Journaling: Tracking setups, win rates, risk-to-reward, and performance over hundreds of trades.
- Discipline & Emotional Control: The ability to not trade when conditions aren’t right.
A trader doesn’t ask, “Will it go up?”
They ask, “If it goes up, what’s my risk? What’s my probability? What’s my plan if I’m wrong?”
That’s not gambling — that’s probability management.
What Gambling Actually Is
Gambling is risking money on an uncertain outcome without any control, edge, or process.
You rely purely on luck — a spin of a wheel, a flip of a card, a random move in a market you don’t understand.
The outcome is fixed against you. In a casino, the house always wins.
A gambler thinks emotionally:
“I have a feeling it’ll go up.”
“My mate said this coin’s going to explode.”
“I’ll double my bet to win it back.”
No analysis. No backtesting. No data. No control.
Just hope — the same force that keeps casinos rich and players broke.
When someone dumps $10,000 into a random altcoin because they saw a tweet or meme, that’s not trading — that’s emotional speculation.
They’re not following a plan; they’re following a crowd.
The Trader’s Mindset vs The Gambler’s Mindset
TRADER:
- Decision Basis: > Data probabilities, confluences
- Goal: > Consistent Long-term growth
- Risk Control: > Defined, Limited, Pre-set
- Emotional State: > Patient, Detached, Focused
- Reaction to loss: > Reviews plan, learns, adjusts
- Education: Studies psychology, risk, analysis
- Funding approach: > Scales up, uses funded accounts
GAMBLER:
- Decision basis:> Emotion, impulse, hype
- Goal: > Quick jackpot
- Risk control: > Undefined, often all-in
- Emotional state: > Fearful, greedy, erratic
- Reaction to loss : > Doubles down or quits
- Education: > Follows noise & influencers
- Funding approach: > Risks personal savings recklessly
A gambler sees “one trade” as the make-or-break moment.
A trader sees “one trade” as part of a thousand trades that define their edge.
Example: The Math of a Trader vs a Gambler
Trader:
Win rate: 55%
Risk-to-reward: 1:2
Risking 1% per trade
After 100 trades, they’re up roughly +55R - 45R = +10R (10% growth).
Their plan, consistency, and edge made it possible.
Gambler:
Win rate: Random, maybe 45%.
Risk-to-reward: 1:1 or worse.
Risking 10–20% per “bet.”
After a handful of losses, they’re wiped out.
There’s no math, no longevity — just emotional chaos.
This is why traders survive, gamblers vanish.
Why Trading Is Not Gambling
1. Trading Has Positive Expected Value (EV)
Gamblers play games with negative EV — odds mathematically stacked against them.
Traders create systems with positive EV by identifying patterns that statistically outperform random chance.
Example:
If your setup wins 55% of the time and earns twice what it risks, your long-term outcome will always be positive.
That’s not luck — that’s math.
2. Trading Has Risk Management
In gambling, you can lose everything on one hand.
In trading, you risk a small percentage per trade.
Professionals risk 0.5–2% of their account per setup.
That’s why they can lose 10 trades in a row and still be in the game.
Gamblers can’t — they blow up because they never manage risk.
3. Trading Uses Control and Data
You can’t “analyze” a roulette spin. You can’t manage risk at a blackjack table.
But in trading, you can backtest, strategize, and control your exposure.
Markets may be uncertain, but traders control their actions within that uncertainty.
Gambling has no such control — it’s fixed odds, rigged in favor of the house.
4. Trading Rewards Skill and Experience
The more you study, journal, and refine your process, the better you get.
No amount of practice makes you better at roulette — the wheel doesn’t care.
But trading rewards time, reflection, and discipline.
Skill matters. Patience matters. Data matters.
5. Trading Has Funding Opportunities
No casino will give you $50,000 to “gamble responsibly.”
But trading firms will give you a $50K, $100K, or $200K funded account — if you prove consistency and discipline.
Funded trading isn’t luck; it’s a business.
You’re rewarded not for profits alone, but for following rules:
- Max daily drawdown
- Overall drawdown limits
- Minimum trading days
- Profit targets
That’s structure — something gambling never has.
Why Use a Funded Account Instead of Your Own $50K?
Because professional trading is not about flexing capital — it’s about proving control.
Funded accounts are training grounds for serious traders:
- You trade with someone else’s capital.
- You’re held accountable to strict limits.
- You’re paid for consistency, not luck.
That’s professionalism.
Gambling is the opposite — no structure, no accountability, and no risk control.
A gambler risks $50K of their own money and hopes for a jackpot.
A trader risks 0.5% of a $50K funded account with a defined plan.
One burns out in a week.
The other builds a track record and earns a living.
The Reality Check: When Trading Does Become Gambling
Trading becomes gambling when:
- You trade without a plan.
- You follow hype or influencers blindly.
- You over-leverage.
- You revenge-trade.
- You skip journaling and analysis.
- You ignore stop losses.
The activity isn’t gambling — the mindset is.
A professional can take the same tool a gambler uses — the same chart, same exchange, same coin — and produce consistent returns, because their intent, process, and control are different.
Real-World Example
Two people open Bitcoin trades at $60,000.
- Trader A: Risks 1%, sets stop at $59,000, target $62,000. Reviews structure, confluences, and volume.
- Trader B: Risks 100% of his savings because “it’ll go up for sure.”
Same entry, same price.
One plays a game of probability, the other a game of hope.
One grows, one disappears.
The chart doesn’t decide who wins — their mindset does.
The Trader’s Mindset
A real trader thinks like a scientist:
- Hypothesis: If price rejects support and volume confirms, it may move up .
- Experiment: Enters small, stops defined.
- Result: Win or loss logged.
- Iteration: Reviews data, improves setup.
Gamblers don’t have hypotheses — they have feelings.
The trader’s mindset is structured:
- Plan before execution.
- Accept losses as data.
- Control risk religiously.
- Focus on consistency over excitement.
Detach emotionally from outcomes.
That’s why traders survive long-term while gamblers chase short-term highs.
“But Crypto Is Just Gambling!”
Crypto can look like gambling — because most people in it treat it like one.
They buy hype, ignore fundamentals, and chase every new shiny coin.
That’s not trading.
Real crypto traders:
- Study tokenomics, development teams, and market sentiment.
- Use technical levels and liquidity maps.
- Manage position sizes and hedge exposure.
- Treat it like a business, not a casino.
The asset class doesn’t make it gambling — your approach does.
Final Thoughts
Yes — both trading and gambling involve risk.
But risk ≠ gambling.
Risk, when managed correctly, equals opportunity .
The difference is control, process, and purpose.
A trader plays the long game with discipline and math.
A gambler plays for emotion and chance.
Anyone can click Buy.
But not everyone can manage risk, follow process, and think in probabilities.
So next time someone says:
“Trading is gambling.”
Show them this:
🎲 Gambling is random.
📊 Trading is calculated.
One depends on luck .
The other depends on discipline .
Thank you all so very much for reading this article, I enjoyed creating it and I hope it becomes of use too you.
If you have any requests on strategies, articles or would like charting done, drop a comment below.
World Market Types 1. Stock Markets (Equity Markets)
The stock market is where people buy and sell shares of companies. A share means a small piece of a company.
Why it exists?
Companies need money to grow. They sell shares to the public. In return, investors can make money if the company does well.
Two parts:
Primary Market: Where new shares are first sold (IPO).
Secondary Market: Where old shares are bought and sold between investors.
Examples:
New York Stock Exchange (USA)
London Stock Exchange (UK)
National Stock Exchange (India)
👉 Simple Example: If you buy shares of Apple, you own a very tiny part of Apple.
2. Bond & Debt Markets
Bonds are like loans. Governments and companies borrow money from people. In return, they promise to pay interest.
Why it exists?
To fund big projects (like roads, airports) or business expansion.
Types of Bonds:
Government Bonds (very safe, like U.S. Treasuries).
Corporate Bonds (issued by companies).
Municipal Bonds (issued by cities).
Example: India issues “G-Secs” (Government Securities).
👉 Simple Example: If you buy a bond for ₹1,000, the government will return your money later and give you interest in the meantime.
3. Commodity Markets
Commodities are raw materials like gold, oil, wheat, or coffee.
Two ways to trade:
Spot Market: Immediate buying/selling.
Futures Market: Agreement to buy/sell at a fixed price in the future.
Examples:
Chicago Mercantile Exchange (USA)
Multi Commodity Exchange (India)
👉 Simple Example: A coffee company may buy coffee beans in advance to protect against future price hikes.
4. Foreign Exchange Market (Forex)
The forex market is where currencies are traded. It’s the biggest market in the world, with $7 trillion traded every day.
Why it exists?
For global trade. (India imports oil and pays in USD).
For travel (changing INR to USD or EUR).
For investment and speculation.
Examples: EUR/USD, USD/INR, GBP/USD pairs.
👉 Simple Example: When you travel abroad and exchange rupees for dollars, you are part of the forex market.
5. Derivatives Market
Derivatives are contracts whose value comes from something else (like stocks, gold, or currency).
Types:
Futures
Options
Swaps
Why it exists?
To manage risk.
To make profit through speculation.
👉 Simple Example: An airline can buy a futures contract for oil to protect against rising fuel costs.
6. Real Estate Market
This market is about buying, selling, or renting property (land, houses, offices, malls, factories).
Direct Way: Owning a house or land.
Indirect Way: Investing in REITs (Real Estate Investment Trusts), which let people invest in property without owning it directly.
👉 Simple Example: If you buy a flat in Mumbai, you are part of the real estate market.
7. Cryptocurrency Market
This is a new and fast-growing market. It deals with digital coins like Bitcoin and Ethereum.
Where it happens?
On exchanges like Binance, Coinbase, or decentralized apps (Uniswap).
Why it exists?
People use it for investment.
Some use it for payments.
Others use it for decentralized finance (DeFi).
👉 Simple Example: If you buy Bitcoin on Binance, you are in the crypto market.
8. Primary vs Secondary Markets
Primary Market: New shares/bonds are sold for the first time (IPO).
Secondary Market: Old shares/bonds are traded among investors (stock exchange).
👉 Simple Example: Buying Zomato shares during IPO = Primary. Buying Zomato shares on NSE later = Secondary.
9. Developed, Emerging, and Frontier Markets
Markets are also classified based on the country’s economy.
Developed Markets: Rich, stable, and safe. Examples: USA, UK, Japan.
Emerging Markets: Fast-growing but risky. Examples: India, Brazil, China.
Frontier Markets: Very small, risky, but full of potential. Examples: Vietnam, Nigeria.
👉 Simple Example: Investing in USA is safer, but investing in India may give higher returns.
10. Domestic, International, and Regional Markets
Domestic: Inside one country (NSE India).
International: Across countries (Forex, Eurobond).
Regional: Between groups of countries (EU Single Market, ASEAN).
👉 Simple Example: Trading only in India = Domestic. Trading USD/EUR = International.
11. OTC (Over-the-Counter) vs Exchange-Traded
Exchange-Traded: Official, transparent, with rules (Stock Exchange).
OTC: Directly between two parties, less regulated (Bond and Forex markets).
👉 Simple Example: Buying Reliance shares on NSE = Exchange. A bank selling USD to another bank = OTC.
12. Traditional vs Digital Markets
Traditional Markets: Face-to-face, physical trading pits.
Digital Markets: Online platforms, apps, and blockchain.
👉 Simple Example: Old stock exchanges used hand signals; now trades happen in seconds via computers.
13. Special Market Segments
Insurance Markets: For managing risks (life, health, property).
Carbon Credit Markets: For trading emission rights.
Art & Luxury Markets: Trading in paintings, collectibles, wine, etc.
14. Future of World Markets
Markets are changing fast. Some big trends are:
AI and Algorithmic Trading – Robots and AI make trades in microseconds.
Green & ESG Investing – Investors prefer eco-friendly companies.
Tokenization of Assets – Even property or art can be split into digital tokens.
Central Bank Digital Currencies (CBDCs) – Countries creating digital versions of money.
Conclusion
World markets are the backbone of global trade and investment. From stock markets in New York to commodity markets in Chicago, from bond markets in Europe to crypto markets online, each type of market serves a unique purpose.
Stock markets give companies money and investors ownership.
Bond markets provide loans to governments and companies.
Commodities markets keep global trade flowing.
Forex markets keep international payments possible.
Derivatives markets help manage risks.
Real estate and crypto open new doors for investors.
In simple words: Markets are where the world connects. They decide prices, move money, and drive economies forward.
US-China Trade War: Causes, Impacts, and Global ImplicationsHistorical Context of U.S.-China Economic Relations
Early Engagement
The United States normalized relations with China in 1979, following Deng Xiaoping’s reforms and China’s opening up to global markets.
Over the next three decades, U.S. companies moved manufacturing to China to take advantage of cheap labor and efficient supply chains.
China, in turn, gained access to advanced technologies, investment capital, and export markets.
Entry into the World Trade Organization (WTO)
In 2001, China’s entry into the WTO was a turning point. It marked its deeper integration into the global economy.
China rapidly grew into the “world’s factory,” and its exports surged.
However, the U.S. and other Western nations accused China of unfair practices: state subsidies, currency manipulation, forced technology transfers, and weak intellectual property protections.
The Growing Trade Imbalance
By the 2010s, the U.S. trade deficit with China exceeded $300 billion annually.
American policymakers began questioning whether trade with China was truly beneficial, especially as U.S. manufacturing jobs declined.
These tensions set the stage for a conflict that was as much about economics as it was about strategic rivalry.
The Outbreak of the Trade War (2018–2019)
Trump Administration’s Policies
In 2017, U.S. President Donald Trump labeled China as a “trade cheater,” accusing it of unfair practices.
By 2018, the U.S. imposed tariffs on steel, aluminum, and billions of dollars’ worth of Chinese goods.
China retaliated with tariffs on U.S. agricultural products, automobiles, and energy.
Escalation
By mid-2019, the U.S. had imposed tariffs on over $360 billion worth of Chinese imports, while China hit back with tariffs on $110 billion of U.S. goods.
The dispute extended beyond tariffs: restrictions were placed on Chinese technology firms like Huawei and ZTE.
Phase One Deal (2020)
After months of negotiations, the U.S. and China signed a “Phase One” trade deal in January 2020.
China pledged to purchase an additional $200 billion worth of U.S. goods and services over two years.
The deal addressed some issues like intellectual property and financial market access but left most tariffs in place.
Core Issues Driving the Trade War
Trade Imbalance
The U.S. imports far more from China than it exports, leading to a massive trade deficit.
While economists argue deficits are not inherently bad, politically they became a symbol of “unfairness.”
Intellectual Property (IP) Theft
American firms accused Chinese companies of copying technology and benefiting from weak IP protections.
Forced technology transfers—where U.S. firms had to share technology with Chinese partners as a condition for market entry—were a major point of contention.
State Subsidies and Industrial Policy
China’s state-driven model, including its “Made in China 2025” plan, aimed to dominate advanced industries like AI, robotics, and semiconductors.
The U.S. viewed this as a threat to its technological leadership.
National Security Concerns
The U.S. raised alarms over Chinese companies’ ties to the Communist Party, particularly in sectors like 5G, AI, and cybersecurity.
Huawei became a focal point, with Washington warning allies against using its equipment.
Geopolitical Rivalry
The trade war is also a battle for global leadership.
China’s rise threatens the U.S.-led order, prompting Washington to adopt a more confrontational stance.
Economic Impacts of the Trade War
On the United States
Consumers: Tariffs increased prices of everyday goods, from electronics to clothing, hurting U.S. households.
Farmers: China imposed tariffs on soybeans, pork, and other agricultural products, devastating American farmers who depended on Chinese markets.
Manufacturers: U.S. firms reliant on Chinese supply chains faced higher input costs.
GDP Impact: Estimates suggest the trade war reduced U.S. GDP growth by 0.3–0.5 percentage points annually.
On China
Export Decline: Chinese exports to the U.S. fell sharply, pushing firms to seek new markets.
Economic Slowdown: Growth dipped from above 6% to below 6%—the lowest in decades.
Technology Restrictions: Huawei and other tech giants faced disruptions in accessing U.S. chips and software.
Resilience: Despite the tariffs, China remained competitive due to diversified global markets and strong domestic consumption.
On the Global Economy
Supply Chains: The trade war disrupted global supply chains, prompting companies to diversify into countries like Vietnam, India, and Mexico.
Global Trade Growth: The WTO reported global trade growth slowed significantly in 2019 due to tensions.
Uncertainty: Businesses worldwide delayed investments amid fears of escalating tariffs and restrictions.
The Role of Technology and Decoupling
The trade war expanded into a tech war, especially in semiconductors, AI, and 5G.
Huawei Ban: The U.S. restricted Huawei from buying American components, pressuring allies to exclude Huawei from 5G networks.
Semiconductors: The U.S. tightened export controls on advanced chips, aiming to slow China’s technological rise.
Decoupling: Both nations began reducing dependency on each other, with companies shifting supply chains and governments investing in domestic industries.
This technological rivalry is often seen as the most critical and long-lasting element of the U.S.-China conflict.
Political Dimensions of the Trade War
Domestic Politics in the U.S.
The trade war became central to Trump’s political messaging, appealing to voters frustrated by globalization.
While tariffs hurt some sectors, they gained support among those seeking a tough stance on China.
Domestic Politics in China
China framed the trade war as foreign bullying, rallying nationalist sentiment.
The Communist Party emphasized self-reliance and doubled down on domestic technological innovation.
International Politics
Allies were caught in the middle:
Europe opposed Chinese trade practices but resisted U.S. pressure to take sides.
Developing nations saw opportunities as supply chains shifted.
COVID-19 and the Trade War
The pandemic, which began in China in late 2019, further complicated the trade war.
Supply Chain Shocks: COVID-19 highlighted global dependency on Chinese manufacturing for medical supplies, electronics, and more.
Geopolitical Blame: The U.S. accused China of mishandling the pandemic, worsening tensions.
Phase One Deal Collapse: China struggled to meet its purchase commitments due to the global recession.
In many ways, COVID-19 deepened the push toward decoupling and reshaping global trade patterns.
Global Implications of the US-China Trade War
Restructuring of Global Supply Chains
Companies are diversifying production away from China to reduce risks.
Southeast Asia, India, and Latin America are emerging as alternative hubs.
Impact on Global Institutions
The WTO struggled to mediate, highlighting weaknesses in the global trade system.
Calls for reforming trade rules to address issues like subsidies and digital trade gained momentum.
Pressure on Other Countries
Nations are forced to align with either the U.S. or China on issues like 5G, data security, and AI.
Middle powers like the EU, Japan, and Australia face tough choices in balancing relations.
Global Economic Slowdown
The IMF repeatedly warned that trade tensions could shave trillions off global GDP.
Slower global trade affects everything from commodity prices to investment flows.
Long-Term Outlook: Is the Trade War the New Normal?
The U.S.-China trade war represents more than a dispute over tariffs. It reflects a structural shift in global power dynamics.
Competition vs. Cooperation: While both countries remain economically interdependent, trust has eroded.
Persistent Rivalry: The Biden administration has largely continued Trump-era tariffs, indicating bipartisan consensus on confronting China.
Technology Cold War: The battle for dominance in semiconductors, AI, and 5G is set to intensify.
Partial Decoupling: Complete separation is unlikely, but critical sectors like technology, defense, and energy may increasingly operate in parallel ecosystems.
Conclusion
The U.S.-China trade war is one of the defining geopolitical and economic conflicts of the 21st century. What began as a tariff battle has evolved into a comprehensive strategic rivalry, encompassing trade, technology, national security, and global influence.
Both nations have paid economic costs, but the deeper impact lies in the reshaping of the global economy. Supply chains are being reorganized, trade institutions are under pressure, and countries around the world are recalibrating their positions between two superpowers.
Whether the future brings renewed cooperation or deepening confrontation depends on political will, economic necessity, and the evolving balance of power. What is clear, however, is that the trade war has fundamentally altered the trajectory of globalization and set the stage for decades of U.S.-China competition.
Role of Imports, Exports, and Tariffs Globally1. Understanding Imports
1.1 Definition and Importance
Imports refer to the goods and services that a country buys from foreign nations. They can include raw materials like crude oil, intermediate goods like steel, or finished consumer products like smartphones and luxury cars.
Imports are vital because no country is self-sufficient in everything. For example:
Japan imports crude oil because it lacks natural reserves.
India imports gold, electronics, and crude oil to meet domestic demand.
The U.S. imports cheap consumer goods from China and agricultural products from Latin America.
1.2 Role of Imports in Development
Imports help countries:
Access resources not available domestically (e.g., oil, rare earth minerals).
Improve quality of life by offering consumer choices.
Boost competitiveness by supplying industries with cheaper or better raw materials.
Promote innovation through exposure to foreign technology.
For example, many developing nations import advanced machinery to modernize their industries, which eventually helps them become competitive exporters.
1.3 Risks and Challenges of Imports
However, heavy reliance on imports can create vulnerabilities:
Trade deficits when imports exceed exports, leading to debt and currency depreciation.
Dependence on foreign suppliers can be risky during geopolitical tensions.
Loss of domestic jobs if foreign goods outcompete local industries.
A classic example is the U.S. steel industry, which suffered from cheap imports from China and other countries.
2. Understanding Exports
2.1 Definition and Importance
Exports are goods and services sold by one country to another. Exports are the lifeline of many economies, especially those with limited domestic markets.
For example:
Germany thrives on exports of automobiles and machinery.
China became the “world’s factory” by exporting electronics, textiles, and manufactured goods.
Middle Eastern countries like Saudi Arabia rely on oil exports for government revenue.
2.2 Role of Exports in Growth
Exports contribute to:
Economic growth by earning foreign exchange.
Employment creation in manufacturing, agriculture, and services.
Technology transfer and skill development.
Trade balance improvement, reducing dependency on foreign debt.
Export-led growth has been a successful model for many Asian economies. South Korea, Taiwan, and later China built their prosperity on robust export sectors.
2.3 Risks and Challenges of Exports
Reliance on exports also carries risks:
Global demand fluctuations can hurt economies. For instance, oil-exporting nations face crises when oil prices fall.
Trade wars and tariffs can reduce access to markets.
Overdependence on one sector creates vulnerability (e.g., Venezuela relying heavily on oil).
3. Tariffs and Their Role in Global Trade
3.1 Definition and Purpose
Tariffs are taxes imposed on imported (and sometimes exported) goods. Governments use them to:
Protect domestic industries from foreign competition.
Generate revenue.
Influence trade balances.
Exercise political or economic leverage.
3.2 Types of Tariffs
Ad valorem tariffs: Percentage of the good’s value.
Specific tariffs: Fixed fee per unit.
Protective tariffs: Designed to shield local industries.
Revenue tariffs: Focused on government income.
3.3 Role of Tariffs in Trade Policy
Tariffs can:
Encourage domestic production by making imports more expensive.
Shape consumer preferences toward local products.
Serve as negotiation tools in international diplomacy.
However, tariffs often lead to trade wars. For example, the U.S.-China trade war (2018–2020) disrupted global supply chains, increased costs for consumers, and created uncertainty in markets.
4. Interconnection of Imports, Exports, and Tariffs
Imports, exports, and tariffs are deeply interconnected. Together they define a country’s trade balance and influence its global economic standing.
Countries that export more than they import run a trade surplus (e.g., Germany, China).
Countries that import more than they export run a trade deficit (e.g., the United States).
Tariffs can alter this balance:
High tariffs discourage imports but can provoke retaliatory tariffs, hurting exports.
Low tariffs encourage open trade but may harm domestic producers.
This interplay is at the heart of trade agreements, disputes, and organizations like the World Trade Organization (WTO).
5. Historical Evolution of Global Trade
5.1 Mercantilism (16th–18th century)
Mercantilist policies emphasized maximizing exports and minimizing imports, with heavy reliance on tariffs. Colonial empires used this strategy to enrich themselves at the expense of colonies.
5.2 Industrial Revolution
Exports of manufactured goods surged from Europe to the world, while colonies provided raw materials. Imports fueled industrial growth, while tariffs protected nascent industries.
5.3 Post-World War II Liberalization
The General Agreement on Tariffs and Trade (GATT) and later the WTO promoted free trade, reducing tariffs globally. Exports and imports flourished, creating the modern era of globalization.
5.4 21st Century Dynamics
Today’s global trade is shaped by:
Free trade agreements (e.g., NAFTA/USMCA, EU Single Market, RCEP).
Trade wars (e.g., U.S.-China).
Strategic tariffs to protect industries (e.g., solar panels, steel, agriculture).
6. Case Studies
6.1 China: Export Powerhouse
China’s rise is a textbook case of export-led growth. By keeping tariffs low, encouraging manufacturing, and integrating into global supply chains, China became the world’s largest exporter. However, its dependence on exports also made it vulnerable to U.S. tariffs in recent years.
6.2 United States: Import-Heavy Economy
The U.S. is the world’s largest importer, relying on foreign goods for consumer demand and industrial inputs. While this supports consumer affordability, it creates persistent trade deficits. The U.S. has used tariffs strategically to protect industries like steel and agriculture.
6.3 European Union: Balanced Trade
The EU maintains both strong exports (cars, pharmaceuticals, machinery) and imports (energy, raw materials). Its single market and common external tariffs demonstrate how regional integration manages trade collectively.
6.4 India: Emerging Economy
India imports heavily (crude oil, electronics, gold) but also pushes exports in IT services, pharmaceuticals, and textiles. Tariffs are frequently used to protect local farmers and small industries.
7. Benefits and Drawbacks of Free Trade vs. Protectionism
7.1 Free Trade Benefits
Efficiency and lower costs.
Greater consumer choices.
Encouragement of innovation.
Economic interdependence, reducing chances of conflict.
7.2 Protectionism Benefits
Protects infant industries.
Safeguards jobs.
Shields strategic sectors (defense, agriculture).
7.3 Risks of Each
Free trade can erode domestic industries.
Protectionism can lead to inefficiency and higher consumer costs.
The balance between these approaches is often contested in politics and economics.
8. Global Organizations and Trade Regulations
WTO: Ensures fair rules and resolves disputes.
IMF and World Bank: Influence trade indirectly through development aid and financial stability.
Regional Trade Blocs: EU, ASEAN, MERCOSUR, RCEP—all shape tariff policies and trade flows.
These organizations seek to balance national interests with global cooperation.
Conclusion
Imports, exports, and tariffs are not just economic mechanisms; they are the foundations of globalization, growth, and international relations. Imports ensure access to essential resources and products, exports drive growth and competitiveness, and tariffs shape the balance between free trade and protectionism.
Their interaction defines trade balances, influences politics, and shapes the destiny of nations. In a world increasingly interconnected yet fraught with geopolitical rivalries, the careful management of imports, exports, and tariffs will remain one of the greatest challenges and opportunities of the 21st century.
Role of Central Banks in Global Markets1. Historical Evolution of Central Banks
1.1 Early Origins
The first central banks emerged in the 17th century, such as the Swedish Riksbank (1668) and the Bank of England (1694), to stabilize currencies and finance governments.
Initially, their role was limited to issuing banknotes and managing public debt.
1.2 Gold Standard Era
During the 19th and early 20th centuries, central banks were tasked with maintaining currency values under the gold standard.
Stability of international trade depended on these institutions’ ability to maintain fixed exchange rates.
1.3 Post-War Bretton Woods System
After World War II, the Bretton Woods agreement (1944) tied major currencies to the U.S. dollar, with the dollar convertible to gold.
Central banks became guardians of exchange rate stability.
1.4 Modern Role (Post-1971)
With the collapse of Bretton Woods in 1971, currencies floated freely.
Central banks shifted focus to inflation targeting, financial stability, and macroeconomic management.
Today, their influence extends beyond national borders into global capital flows and markets.
2. Core Functions of Central Banks in Global Markets
2.1 Monetary Policy
Central banks set interest rates and regulate money supply to achieve price stability and economic growth. Their policies influence:
Global capital flows: Higher U.S. interest rates often attract funds from emerging markets.
Exchange rates: Monetary tightening usually strengthens domestic currency.
Investment decisions: Global investors closely follow central bank policies to allocate capital.
2.2 Lender of Last Resort
During crises, central banks provide emergency liquidity to banks and financial institutions.
Example: During the 2008 Global Financial Crisis, the U.S. Fed and ECB provided trillions in liquidity through swap lines, stabilizing global markets.
2.3 Financial Stability Oversight
Central banks regulate banks and oversee payment systems to prevent systemic risks.
They monitor asset bubbles, excessive lending, and foreign capital volatility.
2.4 Exchange Rate Management
Emerging market central banks (e.g., RBI, PBoC) often intervene in forex markets to prevent excessive volatility.
Exchange rate policy impacts global trade competitiveness.
2.5 Reserve Management
Central banks hold foreign exchange reserves, including U.S. dollars, euros, gold, and bonds, to support their currencies.
Their demand for U.S. Treasuries or euro-denominated assets influences global bond yields.
3. Tools of Central Banks
3.1 Interest Rate Policy
Policy rates (Fed Funds Rate, ECB refinancing rate, RBI repo rate) influence borrowing costs worldwide.
Rate hikes in advanced economies often trigger capital outflows from emerging markets.
3.2 Open Market Operations (OMO)
Buying or selling government securities to manage liquidity.
Large-scale OMO, known as Quantitative Easing (QE), became prominent post-2008.
3.3 Reserve Requirements
Mandating banks to hold a percentage of deposits as reserves.
Impacts credit availability in domestic and global markets.
3.4 Forward Guidance
Central banks provide communication on future policy intentions to influence market expectations.
Example: The Fed’s signals about interest rates guide global equity and bond markets.
3.5 Currency Interventions
Buying or selling foreign currency to stabilize exchange rates.
Example: The Swiss National Bank intervenes to prevent excessive franc appreciation.
4. Influence of Major Central Banks on Global Markets
4.1 U.S. Federal Reserve (Fed)
The most influential central bank due to the U.S. dollar’s role as the global reserve currency.
Fed decisions on rates and QE directly affect:
Global bond yields
Commodity prices (oil, gold)
Emerging market capital flows
4.2 European Central Bank (ECB)
Oversees the euro, the second most traded currency.
ECB policies influence European bond markets, trade flows, and global investor sentiment.
4.3 Bank of Japan (BoJ)
Known for ultra-low interest rates and Yield Curve Control (YCC).
Impacts global carry trades, where investors borrow in yen and invest in higher-yielding markets.
4.4 People’s Bank of China (PBoC)
Manages the yuan and China’s monetary policy.
Its decisions affect global supply chains, commodity demand, and emerging markets.
4.5 Reserve Bank of India (RBI)
Plays a vital role in stabilizing one of the largest emerging economies.
RBI interventions impact Asian capital markets and forex stability.
5. Central Banks During Crises
5.1 Global Financial Crisis (2008)
The Fed cut rates to near zero and launched QE.
ECB and BoJ followed with liquidity measures.
Central banks coordinated globally, stabilizing markets.
5.2 Eurozone Debt Crisis (2010-12)
ECB’s “Whatever it takes” pledge by Mario Draghi restored investor confidence.
Prevented collapse of European bond markets.
5.3 COVID-19 Pandemic (2020)
Central banks injected unprecedented liquidity.
Rates were cut to historic lows.
Asset purchase programs kept markets afloat despite global lockdowns.
6. Challenges Faced by Central Banks
6.1 Balancing Inflation and Growth
Rising inflation post-pandemic forced central banks to hike rates aggressively.
Risk of recession vs. inflation control is a constant trade-off.
6.2 Global Spillovers
A Fed rate hike strengthens the dollar, hurting emerging markets through capital flight and debt pressures.
6.3 Political Pressures
Governments often pressure central banks to support growth, risking their independence.
6.4 Digital Currencies & Technology
Rise of cryptocurrencies and Central Bank Digital Currencies (CBDCs) is changing the financial landscape.
Central banks must balance innovation with regulation.
6.5 Geopolitical Tensions
Sanctions and de-dollarization efforts challenge the U.S. Fed’s dominance.
Energy shocks and wars complicate policy decisions.
7. Future of Central Banks in Global Markets
7.1 Greater Coordination
Global challenges like climate change, pandemics, and financial contagion may require more coordinated action among central banks.
7.2 Digital Transformation
Adoption of CBDCs could redefine cross-border payments, reducing reliance on the dollar.
7.3 Green Finance Role
Central banks may support climate-friendly investments by adjusting reserve requirements or collateral frameworks.
7.4 Rebalancing Power
Emerging market central banks like PBoC and RBI will gain more influence as their economies grow.
Conclusion
Central banks are no longer confined to their domestic economies—they are global market architects. Their monetary policies, interventions, and crisis-management tools shape the movement of capital, trade, and currencies worldwide.
From the Fed’s dominance in global finance to the ECB’s stabilizing role in Europe, and from the BoJ’s ultra-loose policies to the PBoC’s yuan management, these institutions collectively form the backbone of global financial stability.
However, their journey is fraught with challenges—rising inflation, geopolitical risks, digital disruption, and climate imperatives. The future role of central banks will demand not just economic stewardship but also global cooperation, adaptability, and resilience.
In essence, central banks remain the invisible hand guiding global markets, making them indispensable players in the world economy.
Scalping in World Markets1. What is Scalping?
Scalping is a short-term trading style where traders aim to profit from small price fluctuations, typically a few pips in forex, a few cents in stocks, or a few ticks in futures. The average trade duration is extremely short – from a few seconds to a few minutes.
Key characteristics of scalping:
High trade frequency – dozens or even hundreds of trades per day.
Small profit targets – usually 0.1% to 0.5% of price movement.
Tight stop-losses – risk is controlled aggressively.
High leverage usage – to magnify small gains.
Dependence on liquidity and volatility – scalpers thrive in active markets.
2. Scalping in Different World Markets
2.1 Forex Market
The forex market is the most popular for scalping because of its 24/5 availability, tight spreads, and deep liquidity.
Major currency pairs (EUR/USD, GBP/USD, USD/JPY) are preferred for scalping due to minimal spreads.
Forex scalpers often use 1-minute and 5-minute charts to identify quick opportunities.
2.2 Stock Market
Scalping in equities focuses on high-volume stocks like Apple, Tesla, or Amazon.
Traders benefit from intraday volatility and liquidity during opening and closing market hours.
Access to Level 2 order book and Direct Market Access (DMA) is crucial for equity scalpers.
2.3 Futures and Commodities
Futures contracts like S&P 500 E-mini, crude oil, and gold are attractive for scalpers.
Commodity scalping requires understanding of economic reports (EIA crude oil inventory, OPEC meetings).
2.4 Cryptocurrencies
Crypto markets are 24/7, offering endless scalping opportunities.
High volatility and liquidity in coins like Bitcoin and Ethereum make them ideal.
However, high transaction fees and slippage can erode profits.
2.5 Global Indices
Scalpers often trade indices like Dow Jones, FTSE 100, DAX, and Nikkei 225.
Indices react quickly to macroeconomic data, providing fast scalping opportunities.
3. Scalping Strategies in World Markets
3.1 Market Making
Involves placing simultaneous buy and sell orders to profit from the bid-ask spread.
Works best in highly liquid instruments.
3.2 Momentum Scalping
Traders ride micro-trends by entering when momentum surges (e.g., after a breakout).
Useful in fast-moving markets like NASDAQ or forex majors.
3.3 Range Scalping
Scalpers trade within tight support and resistance zones.
Buy near support and sell near resistance repeatedly.
3.4 News-Based Scalping
Focuses on volatility caused by economic releases (CPI, NFP, Fed announcements).
High risk but high reward.
3.5 Algorithmic Scalping
Uses bots to execute trades automatically within milliseconds.
Common in institutional trading with access to co-location servers.
4. Tools and Techniques for Scalping
Trading Platforms – MT4/MT5, NinjaTrader, Thinkorswim, Interactive Brokers.
Charts & Timeframes – 1-minute, 5-minute, tick charts, and order flow charts.
Indicators:
Moving Averages (EMA 9, EMA 21)
Bollinger Bands
RSI (1 or 5 period)
VWAP (Volume Weighted Average Price)
Order Book & Level 2 Data – Helps scalpers see liquidity depth.
Hotkeys & Fast Execution – Essential for entering/exiting trades within seconds.
5. Risk Management in Scalping
Scalping is high-risk due to the large number of trades and leverage. Key risk controls include:
Stop-loss orders – Protect from large losses when price moves unexpectedly.
Position sizing – Never risk more than 1% of account per trade.
Spread & commissions – Monitor closely, as these eat into small profits.
Discipline – Avoid overtrading and revenge trading.
6. Advantages of Scalping
Quick Profits – Immediate feedback from trades.
Less exposure to overnight risk – No swing or position holding.
Works in all market conditions – Volatile, range-bound, or trending.
Compounding effect – Small profits add up across multiple trades.
Psychological satisfaction – For traders who like constant engagement.
7. Challenges of Scalping
High Stress – Requires constant focus and fast decision-making.
Costs – Commissions, spreads, and slippage reduce profitability.
Execution speed – Any delay can wipe out gains.
Broker restrictions – Some brokers prohibit or limit scalping.
Psychological fatigue – Scalping can be mentally exhausting.
8. Psychology of a Scalper
Scalping is not just about technical skills; it demands the right mindset:
Patience and discipline – Avoid chasing trades.
Emotional control – Handle stress and avoid panic decisions.
Consistency – Stick to predefined strategies.
Focus – Ability to concentrate for hours without distraction.
9. Regulations and Global Differences
US Markets: FINRA requires $25,000 minimum for pattern day trading in equities.
European Markets: MiFID II rules on leverage (max 1:30 for retail).
Asian Markets: Japan and Singapore allow high-frequency scalping, but require licensing for institutional scalpers.
Forex Brokers: Some brokers discourage scalping due to server load.
Best Practices for Successful Scalping
Focus on liquid assets.
Keep a trading journal.
Test strategies on demo accounts.
Control emotions and avoid overtrading.
Use technology for execution speed.
Conclusion
Scalping in world markets is one of the most challenging yet rewarding trading approaches. It requires discipline, speed, and precision to consistently extract profits from tiny market movements. While technology and globalization have made scalping more accessible, only traders with the right psychology, tools, and risk management can succeed.
As markets evolve with AI, crypto, and faster infrastructures, scalping will continue to be a dominant force in global trading. For traders who thrive under pressure and enjoy high-frequency engagement, scalping offers unparalleled opportunities – but it demands mastery of both strategy and self-control.

Carry Trade in the Global Market1. What is a Carry Trade?
A carry trade is a financial strategy where investors:
Borrow or fund positions in a currency with low interest rates (funding currency).
Use those funds to buy a currency or asset with a higher interest rate (target currency or investment).
Earn the difference between the two rates (the interest rate spread), while also being exposed to currency fluctuations.
Example (Simplified):
Suppose the Japanese yen has a 0.1% interest rate, and the Australian dollar (AUD) has a 5% interest rate.
A trader borrows ¥100 million (Japanese yen) at near-zero cost and converts it into AUD.
The funds are invested in Australian bonds yielding 5%.
Annual return ≈ 4.9% (before considering currency fluctuations).
If the AUD appreciates against the yen during this time, the trader earns both the interest rate differential + capital gains. If AUD depreciates, the trade may turn into a loss.
2. The Mechanics of Carry Trade
Carry trade is not as simple as just switching between two currencies. It involves global capital flows, leverage, interest rate cycles, and risk management.
Step-by-Step Process:
Identify funding currency: Typically one with low or negative interest rates (JPY, CHF, or USD in certain cycles).
Borrow or short-sell this currency.
Buy high-yielding currency assets: Such as government bonds, corporate debt, or equities in emerging markets.
Earn interest spread daily (known as the rollover in forex markets).
Monitor exchange rates since even small currency fluctuations can offset interest gains.
Why It Works:
Differences in monetary policies across central banks create yield gaps.
Investors with large capital seek to exploit these spreads.
Global liquidity cycles and risk appetite drive the demand for carry trades.
3. Historical Importance of Carry Trade
Carry trades have been a cornerstone of currency markets, shaping global financial cycles:
1990s – Japanese Yen Carry Trade
Japan maintained near-zero interest rates after its asset bubble burst in the early 1990s.
Investors borrowed cheap yen and invested in higher-yielding assets abroad (Australia, New Zealand, emerging markets).
This caused yen weakness and strong capital inflows into emerging markets.
2000s – Dollar and Euro Carry Trades
Before the 2008 financial crisis, investors borrowed in low-yielding USD and JPY to invest in high-yielding currencies like the Brazilian Real, Turkish Lira, and South African Rand.
Commodity booms amplified returns, making the carry trade highly profitable.
2008 Global Financial Crisis
Carry trades collapsed as risk aversion spiked.
Investors unwound positions, leading to a surge in yen (JPY) and Swiss franc (CHF).
This showed how carry trade unwind can cause global market turbulence.
2010s – Post-Crisis QE Era
Ultra-low rates in the US, Japan, and Europe sustained carry trade strategies.
Emerging markets benefited from capital inflows but became vulnerable to sudden outflows when US Fed hinted at tightening (2013 “Taper Tantrum”).
2020s – Pandemic & Beyond
Global central banks slashed rates during COVID-19, reviving conditions for carry trades.
However, the 2022–23 inflation surge and rate hikes by the Fed created volatility, making carry trades riskier.
4. Global Carry Trade Currencies
Funding Currencies (Low Yield):
Japanese Yen (JPY): Classic funding currency due to decades of near-zero rates.
Swiss Franc (CHF): Safe-haven status and low yields.
Euro (EUR): Used in periods of ECB ultra-loose policy.
US Dollar (USD): At times of near-zero Fed rates.
Target Currencies (High Yield):
Australian Dollar (AUD) & New Zealand Dollar (NZD): Stable economies with higher yields.
Emerging Market Currencies: Brazilian Real (BRL), Turkish Lira (TRY), Indian Rupee (INR), South African Rand (ZAR).
Commodity Exporters: Higher rates often accompany higher commodity cycles.
5. Drivers of Carry Trade Activity
Carry trades thrive when global financial conditions are supportive.
Interest Rate Differentials – Larger gaps = higher carry.
Global Liquidity – Abundant capital seeks higher yields.
Risk Appetite – Investors pursue carry trades in “risk-on” environments.
Monetary Policy Divergence – When one central bank keeps rates low while others tighten.
Volatility Levels – Low volatility encourages carry trades; high volatility kills them.
6. Risks of Carry Trade
Carry trades may look attractive, but they are highly risky.
Currency Risk – A sudden depreciation of the high-yielding currency can wipe out gains.
Interest Rate Shifts – If the funding currency raises rates or target currency cuts rates, the carry spread shrinks.
Liquidity Risk – In crises, traders rush to unwind, leading to sharp reversals.
Geopolitical Risk – Wars, political instability, or sanctions can collapse carry trades.
Leverage Risk – Carry trades are often leveraged, magnifying both profits and losses.
7. The Role of Central Banks
Central banks indirectly shape carry trades through:
Rate setting policies (zero-rate or tightening cycles).
Forward guidance that signals future moves.
Quantitative easing (QE) that floods markets with liquidity.
Capital controls in emerging markets that try to manage inflows/outflows.
8. Case Studies in Carry Trades
The Yen Carry Trade (2000–2007)
Massive inflows into risky assets globally.
Unwinding during 2008 caused yen to spike 30%, triggering global asset sell-offs.
The Turkish Lira (TRY)
High rates attracted carry trades.
But political instability and inflation led to currency crashes, wiping out investors.
Brazil and South Africa
During commodity booms, high-yield currencies like BRL and ZAR became popular targets.
However, they were also prone to volatility from commodity cycles.
9. Carry Trade in Modern Markets
Today, carry trades are more complex and algorithm-driven. Hedge funds, banks, and institutional investors run quantitative carry trade strategies across forex, bonds, and derivatives.
Tools Used:
FX swaps & forwards
Options for hedging
ETFs & leveraged funds tracking carry trade strategies
Example – G10 Carry Index
Some financial institutions track “carry indices” that measure returns from long high-yield currencies and short low-yield currencies.
10. Advantages of Carry Trade
Predictable Income – Earn from interest rate differentials.
Scalability – Works in global FX markets with high liquidity.
Diversification – Access to multiple asset classes.
Potential for Leverage – High returns if managed correctly.
Conclusion
Carry trade is one of the most fascinating and impactful strategies in the global financial system. By exploiting interest rate differentials across countries, it provides traders with a potential source of profit. However, history has shown that the carry trade is a double-edged sword: highly rewarding in stable times, but brutally punishing during crises.
Understanding its mechanics, historical patterns, risks, and modern applications is essential for any trader, investor, or policymaker. The carry trade is more than just a strategy — it is a barometer of global risk appetite, liquidity, and monetary policy divergence.
For those who master it with discipline and risk management, the carry trade remains a powerful tool in navigating global markets.
