When Liquidity Dried Up — The True Story Behind the Oct 10 Crash█ We Actually Saw It Coming
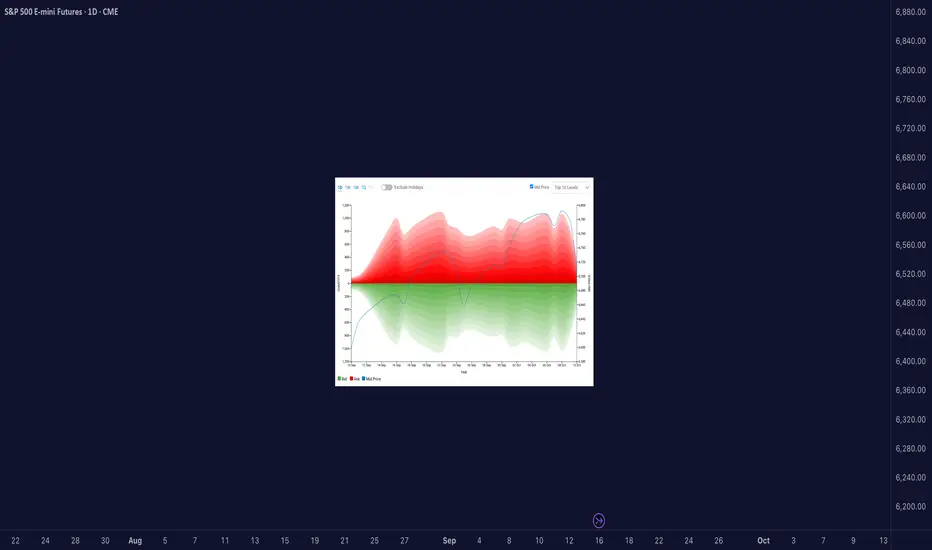
There were clear signs of potential reversals across major markets before the Friday, October 10, 2025 crash. You can see it in the liquidity heatmaps: Gold, Bitcoin, S&P, and other futures all trading above their top 10 liquidity levels.
When that happens, it’s usually a warning flag. Price is moving into areas with less visible liquidity, meaning fewer resting orders available to absorb aggressive buyers. That’s when the market becomes fragile and doesn’t take much to trigger a sharp reversal.
█ When Price Trades Beyond Visible Liquidity
It’s easy to think big moves happen just because of news, but beneath the surface, microstructure signals often show when markets are already vulnerable.
One of the clearest is when the mid-price extends beyond the visible liquidity, above the top few ask levels or below the top few bid levels in the order book.
Suppose price pushes beyond the visible top levels. In that case, it often means that liquidity was consumed faster than it could replenish, either because aggressive orders cleared it out, or market makers pulled their quotes. That’s when we get what’s called a liquidity vacuum.
Research from the Federal Reserve, Bank for International Settlements, and academic studies (Lo & Hall, 2014; Meldrum & Sokolinskiy, 2025) all point to the same thing:
When order book depth is shallow, markets become more fragile. Prices overreact, spreads widen, and shocks travel faster.
█ What the Heatmap Really Shows
Those heatmaps are a visual snapshot of this structure.
The green and red bands show the depth of buy and sell orders — the liquidity zones.
The blue line is the mid-price — the true current market price.
When the blue line (mid-price) moves above the red zone, it means price has traded beyond the top available asks. That can happen because:
Buyers lifted all nearby sell orders (aggressive buying), or
Sellers pulled liquidity (passive withdrawal).
In both cases, the effect is the same, the book thins out, and volatility risk increases.
Heatmaps don’t show everything though. They don’t reveal:
Hidden or iceberg orders deeper in the book,
Off-exchange liquidity or block trades,
Or how quickly the book replenishes in real time.
But as a visual proxy, they’re incredibly useful for spotting moments when price runs ahead of available liquidity, often right before sharp reversals.
█ Why the Crash Hit So Hard
So while the crash came from unexpected news, the speed of that drop wasn’t random. Markets were already fragile. Liquidity across assets was thin. When the shock hit, there weren’t enough resting orders to slow it down.
Gold, Bitcoin, and S&P futures all had their mid-prices trading above visible liquidity, making them more sensitive to aggressive selling; that’s why the market fell almost simultaneously and so fast.
█ How I Handle These Setups
Whenever I see price trading above visible liquidity, I start managing risk differently. I might keep existing longs, but I won’t add new ones. Instead, I scale out gradually and watch for potential short setups if other signals confirm it.
It’s not about predicting crashes, it’s about recognizing when the market’s structure is fragile.
█ Quick Takeaway
When the mid-price trades above visible liquidity, the order book is telling you something simple but powerful:
“There’s not much support up here.”
That’s often when it pays to get defensive, not aggressive.
Access the CME Liquidity tool at this link
-----------------
Disclaimer
The content provided in my scripts, indicators, ideas, algorithms, and systems is for educational and informational purposes only. It does not constitute financial advice, investment recommendations, or a solicitation to buy or sell any financial instruments. I will not accept liability for any loss or damage, including without limitation any loss of profit, which may arise directly or indirectly from the use of or reliance on such information.
All investments involve risk, and the past performance of a security, industry, sector, market, financial product, trading strategy, backtest, or individual's trading does not guarantee future results or returns. Investors are fully responsible for any investment decisions they make. Such decisions should be based solely on an evaluation of their financial circumstances, investment objectives, risk tolerance, and liquidity needs.
Liquiditypool
What Is an Iceberg Order, and How May It Be Used in Trading?What Is an Iceberg Order, and How May It Be Used in Trading?
An iceberg order is a type of execution strategy that hides the full size of a trade by revealing only small portions at a time. Used by institutions and large traders, it helps reduce market impact. Understanding how iceberg orders work, where they’re used, and their risks can help traders more accurately analyse market activity. This article breaks down everything you need to know about iceberg orders and their role in trading.
What Is an Iceberg Order?
An iceberg order is a type of order designed to execute large trades without revealing the full size to the market. Instead of placing one massive position that could disrupt prices, traders split it into smaller portions, with the rest hidden. As each portion gets filled, the next one is placed automatically until the full order is executed.
The key feature of this type of entry is that only a fraction—known as the display quantity—is visible in the order book at any given time. The rest remains hidden until it’s gradually revealed. This prevents other traders from immediately recognising the true size of the position, which helps avoid unnecessary market movements.
For example, if a trader wants to buy 50,000 shares of a stock, placing the full position in the market at once could cause prices to rise before execution is complete. Instead, they might set an iceberg order with a display size of 5,000 shares. Once the first 5,000 are bought, another 5,000 are automatically placed, repeating until the full 50,000 are executed.
They’re particularly useful for institutional traders, hedge funds, and high-net-worth individuals who want to build or reduce positions without attracting attention. However, some retail traders also use them when executing relatively large trades in markets that support this execution type. Many major exchanges, including those for equities, forex, and futures, allow icebergs, but their availability depends on the broker and trading platform being used.
How Iceberg Orders Work
The main idea of iceberg orders is clear but let’s consider how they work in detail.
Order Execution Process
When a trader places an iceberg order, they specify two key parameters:
Total size – The full amount they want to buy or sell.
Display size – The portion that will be visible at any given time.
For example, if a trader wants to buy 20,000 shares but only wants 500 to be visible at a time, the order book will show just 500 shares. Once those are bought, another 500 will appear at the same price (if still available), and the cycle continues until the entire 20,000 shares are filled.
Dynamic Execution
Some trading platforms and institutional brokers use smart order execution algorithms to optimise how these orders are placed. These algorithms might adjust the display size dynamically based on market conditions, ensuring the order gets executed efficiently without drawing too much attention.
Hidden Portions and Order Book Activity
Although most of the order remains hidden, experienced traders and high-frequency algorithms can sometimes detect iceberg levels. If they notice an order constantly refreshing at the same price level without an obvious large sell or buy position, they may infer that an iceberg is in play.
Where Iceberg Orders Are Most Popular
They are most popular in liquid markets where frequent trading activity allows the hidden portions to be executed smoothly. In less liquid markets, there’s a higher risk that the order will be only partially filled or take longer to execute, making alternative execution strategies more practical.
Why Traders Use Iceberg Orders
Iceberg orders help traders hide their full intentions from the market. Here’s why they’re commonly used:
Reducing Market Impact
When a large position enters the market, it can shift prices before the full trade is completed. This is particularly an issue in less liquid markets, where even moderate positions can cause price swings. By splitting a large trade into smaller, hidden chunks, iceberg orders prevent sudden moves that could work against the trader.
Avoiding Slippage
Slippage occurs when an order is executed at a worse price than expected due to market movement. Large trades placed all at once can exhaust available liquidity at the best price levels, forcing later portions to be filled at less favourable prices. Iceberg orders help mitigate this by allowing the trade to be executed gradually without consuming too much liquidity at once.
Maintaining Discretion
Institutions and high-net-worth traders often prefer to keep their trading activity under the radar. If other market participants see a massive buy or sell entry, they may react by adjusting their own strategies, making it harder for the original trader to get a good price. Icebergs keep most of the position hidden, preventing this from happening.
Reducing the Risk of Front-Running
High-frequency trading firms and aggressive traders actively monitor the order book for large transactions. When they spot them, they may enter positions ahead of the large trade, pushing prices in an unfavourable direction. By keeping most of the trade hidden, iceberg entries make it harder for others to exploit this information.
Identifying Iceberg Orders in the Market
Iceberg orders are designed to be discreet, but experienced traders and algorithmic systems can sometimes detect them by analysing order book activity and price movements. Since only a small portion of the total order is visible at any given time, certain patterns can reveal the presence of an iceberg in action.
Order Book Clues
One of the most obvious signs is a persistent order at the same price level. If a bid or ask keeps refreshing with the same quantity after being partially filled, it may indicate that a much larger hidden position is sitting at an iceberg level. This is particularly noticeable in less liquid markets where large trades are more disruptive.
Another telltale sign is a large trade volume without corresponding large visible orders. If significant buying or selling occurs but the order book only displays small entries, there’s a chance that a hidden order is gradually being executed.
Time and Sales Analysis
Traders can also look at time and sales data, which records every transaction. If the same price level repeatedly absorbs multiple trades without depleting, it suggests a hidden order replenishing itself after each execution.
Algorithmic Detection
Some trading algorithms are specifically designed to identify icebergs. These tools scan for patterns in order execution and attempt to infer hidden liquidity. While not always accurate, they can give traders an idea of when institutional activity is taking place.
Risks and Limitations of Iceberg Orders
While iceberg orders can help traders execute large trades discreetly, they are not without drawbacks. Market conditions, execution risks, and the rise of advanced trading algorithms can all impact their effectiveness.
- Incomplete Execution: If market conditions change or liquidity dries up, part of the position may remain unfilled. This is especially problematic in volatile or low-volume markets where price movements can accelerate unexpectedly.
- Detection by Algorithms: Sophisticated trading algorithms actively scan for hidden orders. High-frequency traders (HFTs) may detect it and adjust their strategies, making it harder to execute at a favourable price.
- Increased Trading Costs: Splitting a large entry into multiple smaller ones can lead to higher transaction costs. Exchanges and brokers may charge fees per executed trade, meaning an iceberg entry could end up costing more than a single bulk position.
- Slower Execution in Fast Markets: When markets move quickly, the visible portions of an iceberg might not fill fast enough before the price changes. This can lead to slippage, where later parts of the order get executed at worse prices than intended.
- Limited Availability: Not all brokers or exchanges support icebergs, particularly in smaller or less liquid markets. Some platforms also impose minimum position size requirements, restricting their use for smaller traders.
The Bottom Line
Iceberg orders enable traders to execute large trades discreetly, minimising market impact and enhancing execution quality. While they offer advantages in managing liquidity, they also carry risks such as detection by advanced algorithms and potential slippage. Traders should exercise caution and conduct thorough market analysis.
FAQ
What Is an Iceberg Order?
An iceberg order is a type of order that splits a large trade into smaller visible portions, with the remaining size hidden from the order book. As each visible portion is filled, the next one is automatically placed until the full order is executed. This helps traders avoid moving the market or revealing their full position size.
How Do You Identify an Iceberg Order?
Traders can spot icebergs by looking for repeated small trades at the same price level. If an order keeps refreshing after partial fills without a visible large order in the book, it may indicate hidden liquidity. Time and sales data, as well as algorithmic tools, can help detect these patterns.
What Is the Difference Between an Iceberg Order and a Basket Order?
An iceberg order breaks a single large entry into smaller, hidden parts, while a basket order consists of multiple different trades executed together, often across various assets or instruments. Basket orders are used for portfolio adjustments, whereas iceberg entries focus on reducing market impact.
What Is an Iceberg Order in Crypto*?
In crypto* markets, iceberg entries function the same way as in traditional markets—hiding large trades to prevent price fluctuations. Many exchanges offer this feature, particularly for institutional traders handling large positions.
How Do I Place an Iceberg Order?
Availability depends on the broker or exchange. Traders typically set the total position size and the visible portion, allowing the system to execute the trade in smaller segments.
What Is the Iceberg Order Strategy?
The strategy involves using iceberg orders to accumulate or distribute large positions without drawing attention. It helps reduce slippage, maintain discretion, and avoid triggering unnecessary price movement.
*Important: At FXOpen UK, Cryptocurrency trading via CFDs is only available to our Professional clients. They are not available for trading by Retail clients. To find out more information about how this may affect you, please get in touch with our team.
This article represents the opinion of the Companies operating under the FXOpen brand only. It is not to be construed as an offer, solicitation, or recommendation with respect to products and services provided by the Companies operating under the FXOpen brand, nor is it to be considered financial advice.

Liquidity ≠ Volume: The Truth Most Traders Never Learn█ Liquidity ≠ Volume: The Truth Most Traders Never Learn
Most traders obsess over volume bars, but volume is the footprint, not the path forward.
If you’ve ever seen price explode with no volume or fail despite strong volume, you’ve witnessed liquidity in action.
█ Here’s what you need to know
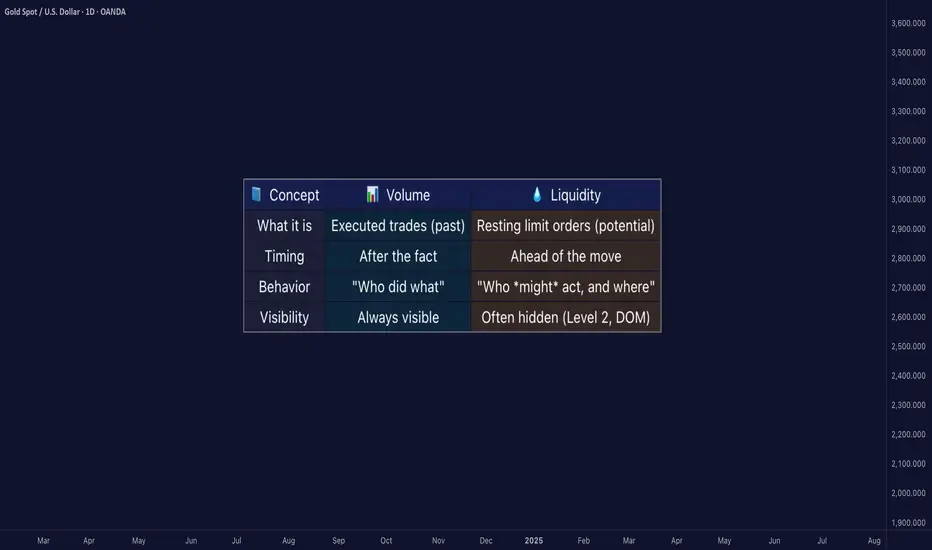
⚪ Volume Is Reactive — Liquidity Is Predictive
Volume tells you what happened.
Liquidity tells you what can happen.
█ Scenario 1: Price Jumps on Low Volume
❝ A price can jump on low volume if no liquidity exists above.❞
⚪ What’s happening?
The order book is thin above the current price (i.e., few or no sellers).
Even a small market buy order clears out available asks and pushes price up multiple levels.
Volume is low, but the impact is high because there’s no resistance.
⚪ Implication:
This is called a liquidity vacuum.
It can happen before news, during rebalancing, before session openings, on illiquid instruments, or during off-hours.
Traders often overestimate the strength of the move because they only see the candle, not the absence of offers behind it.
█ Scenario 2: Move Fails on High Volume
❝ A move can fail on high volume if it runs into a wall of offers or bids.❞
⚪ What’s happening?
There’s a strong surge of aggressive buying or selling (high volume).
But the order book has deep liquidity at that level — large resting limit orders.
The aggressive traders can’t chew through the liquidity wall, and price stalls or reverses.
⚪ Implication:
This is called liquidity absorption.
Market makers or institutions may intentionally absorb flow to stop a breakout.
Many retail traders mistake this for “fakeouts,” but it’s really liquidity defending a level.
⚪ What the Research Says
Cont, Stoikov, Talreja (2014): Price responds more to order book imbalance than trade volume.
Bouchaud et al. (2009): Liquidity gaps, not trade size, are what truly move markets.
Hasbrouck (1991): Trades only impact price if they consume liquidity.
Institutions don’t chase candles — they model depth, imbalance, and liquidity resilience.
⚪ Where the Alpha Lives
Liquidity tells you where the market is weak, strong, or vulnerable — before price moves.
Fakeouts happen in thin books.
Reversals occur at hidden walls of liquidity.
Breakouts sustain when liquidity follows the price, not pulls away.
If you understand this, you can:
Enter before volume shows up
Avoid chasing dead breakouts
Fade failed moves into empty space
█ Final Truth
Volume is the echo. Liquidity is the terrain. Alpha is in reading the terrain. You want to study the structure, because price moves toward weakness and away from strength. Learn to see where liquidity is, or where it’s missing, and you’ll see trading with new eyes.
-----------------
Disclaimer
The content provided in my scripts, indicators, ideas, algorithms, and systems is for educational and informational purposes only. It does not constitute financial advice, investment recommendations, or a solicitation to buy or sell any financial instruments. I will not accept liability for any loss or damage, including without limitation any loss of profit, which may arise directly or indirectly from the use of or reliance on such information.
All investments involve risk, and the past performance of a security, industry, sector, market, financial product, trading strategy, backtest, or individual's trading does not guarantee future results or returns. Investors are fully responsible for any investment decisions they make. Such decisions should be based solely on an evaluation of their financial circumstances, investment objectives, risk tolerance, and liquidity needs.
Mastering Liquidity Dynamics: Understand the Dynamic True ValueDear Reader,
Thank you for reading—your time is valuable.
Use the chart's zoom-in/out (-/+) function for better visibility. This chart captures a large sample for your evaluation.
Below is the manual detailing the Smart Farmer System —a Dynamic True Value framework derived from real-time data to anticipate market intent and liquidity behavior .
If this resonates with you, drop a comment below— constructive insights are always welcome .
The Dynamic True Value - a Smart Farmer System: Terminology and Mechanics
: For now, I have firmed up POC - Price of Control, VAP - Value Average Pricing, SULB - Sell Upper Limit Bound, BLLB - Buy Lower Limit Bound.
Mechanic:
POC - Where fair value price dynamic is read.
VAP - Trading above indicates bullish sentiment of the cycle, and the opposite for bearish sentiment.
A crossed over of:
Grey POC above Green VAP - Signaling distribution, accumulation, consolidation, build-ups, correction, retracement .
Green VAP above Grey POC - Bullish strength and momentum consistency .
Pink VAP above Black POC - Bearish strength and momentum consistency .
Flip of Pink VAP to Green VAP - Sentiment flips from bear to bull, and the same goes for green flip to pink showing bull to bear.
Validation of entry signals requires:
Signal's candle must close past the opposite side of POC – flip sentiment .
The confirmation candle (is the closed next candle immediately after entry signal candle) must continue closed past the POC – maintain sentiment .
The progress candle (is the next candle closed right after the Confirmation Candle) shows traction, momentum build-up, and volume consistency .
Hint of invalidation:
Signal's candle is considered void if the next candle prints a new entry signal in the opposite direction. This often signals accumulation, sideways movement, build-up, uncertainty, or swings in range .
The immediate next candle closed past POC to the opposite side.
What to understand about Liquidity Trap, SULB, and BLLB:
Liquidity traps
Often occur at the recent/previous flatlines of Dynamic True Value (POC, VAP, SULB, BLLB) .
It is worth paying attention to the market’s intent and institutional positioning.
Signs of exhaustion, absorption, inducement, offloading, and accumulation are visible in the M1 (one-minute) TF, with significant confluence near the previous/recent flatlines of Dynamic True Value in the higher/macro-TFs.
An Anchored VWAP tool can be helpful for filtering noise in the market. This tool can be found in the drawing tab in the TradingView platform.
SULB
Details the dynamic of upper resistance where Bears remain in control below the dynamic level.
Below this limit bound (LB) , bears show strength – bear sentiment .
A converging price toward this LB indicates bulls are present.
Moving past this LB (a candle closed above) and successfully RETESTING newly formed support indicates a confirmed directional shift . Followed by printing a new BLLB in the next following candles with price continuing to rise above this failed SULB.
A rejection below LB (a rejection/exhausted candle closed below LB) and successful RETEST reaffirms the resistance holds , indicating downside continuation .
BLLB
Details the dynamic of lower support where Bulls remain in control above the dynamic level.
Above this LB, bulls show strength – bull sentiment .
A converging price toward this LB signifies bears are present.
Moving past this LB (a candle closed below) and successfully RETESTING newly formed resistance indicates a confirmed directional shift . Followed by printing a new SULB in the next following candles with price continuing to push lower below this failed BLLB.
A rejection above LB (a rejection/exhausted candle closed above LB) and successful RETEST reaffirms the support holds , indicating upward continuation .
Important Notes:
Select preferred Entry’s Signal TF (ex. M3 TF, M5 TF for scalping strategy, M15 for intraday/daily strategy, 4H TF for day-to-weekly strategy, etc.).
Always refer to the selected Entry’s TF for trading progress. Anticipate TP and SL by watching the range in this TF.
Non-entry TFs are not for entry purposes. These multi-TFs are used for measuring strength, momentum, liquidity, positioning, structure – The market intends . The Non-entry TF is used to anticipate institutional executions and liquidity pools.
These criteria MUST BE MET. A failed criterion suggests vague execution. Be patient and wait for clear validations.
Institutions excel in creating illusions.
SFS is designed to stand ready, calm, and execute with Clarity.
SFS cuts through noise, distraction, and stays independent of NEWS, GEOPOLITIC, RUMORS, and herd mentality because all these are designed to mislead retail traders into institutional traps.
When we see such ambiguity against the criteria, we know not to fall into the TRAP and become the liquidity FUEL.
Stay sharp, only respond when signals are firmed. SFS is designed to counter Smart Money capitalism. It is about time to level the playing field.

What Is a Liquidity Sweep and How Can You Use It in Trading?What Is a Liquidity Sweep and How Can You Use It in Trading?
Mastering key concepts such as liquidity is crucial for optimising trading strategies. This article explores the concept of a liquidity sweep, a pivotal phenomenon within trading that involves large-scale players impacting price movements by triggering clustered pending orders, and how traders can leverage them for deeper trading insights.
Understanding Liquidity in Trading
In trading, liquidity refers to the ability to buy or sell assets quickly without causing significant price changes. This concept is essential as it determines the ease with which transactions can be completed. High liquidity means that there are sufficient buyers and sellers at any given time, which results in tighter spreads between the bid and ask prices and more efficient trading.
Liquidity is often visualised as the market's bloodstream, vital for its smooth and efficient operation. Financial assets rely on this seamless flow to ensure that trades can be executed rapidly and at particular prices. Various participants, including retail investors, institutions, and market makers, contribute to this ecosystem by providing the necessary volume of trades.
Liquidity is also dynamic and influenced by factors such as notable news and economic events, which can all affect how quickly assets can be bought or sold. For traders, understanding liquidity is crucial because it affects trading strategies, particularly in terms of entry and exit points in the markets.
What Is a Liquidity Sweep?
A liquidity sweep in trading is a phenomenon within the Smart Money Concept (SMC) framework that occurs when significant market players execute large-volume trades to trigger the activation of a cluster of pending buy or sell orders at certain price levels, enabling them to enter a large position with minimal slippage. This action typically results in rapid price movements and targets what are known as liquidity zones.
Understanding Liquidity Zones
Liquidity zones are specific areas on a trading chart where there is a high concentration of orders, including stop losses and pending orders. These zones are pivotal because they represent the levels at which substantial buying or selling interest is anticipated once activated. When the price reaches these zones, the accumulated orders are executed, which can cause sudden and sharp price movements.
How Liquidity Sweeps Function
The process begins when market participants, especially institutional traders or large-scale speculators, identify these zones. By pushing the market to these levels, they trigger other orders clustered in the zone. The activation of these orders adds to the initial momentum, often causing the price to move even more sharply in the intended direction. This strategy can be utilised to enter a position favourably or to exit one by pushing the price to a level where a reversal is likely.
Liquidity Sweep vs Liquidity Grab
Within the liquidity sweep process, it's crucial to distinguish between a sweep and a grab:
- Liquidity Sweep: This is typically a broader movement where the price action moves through a liquidity zone, activating a large volume of orders and thereby affecting a significant range of prices.
- Liquidity Grab: Often a more targeted and shorter-duration manoeuvre, this involves the price quickly hitting a specific level to trigger orders before reversing direction. This is typically used to 'grab' liquidity by activating stops or pending positions before the price continues to move in the same direction.
In short, a grab may just move slightly beyond a peak or low before reversing, while a sweep can see a sustained movement beyond these points prior to a reversal. There is a subtle difference, but the outcome—a reversal—is usually the same.
Spotting a Liquidity Sweep in the Market
Identifying a sweep involves recognising where liquidity builds up and monitoring how the price interacts with these zones. It typically accumulates at key levels where traders have placed significant numbers of stop-loss orders or pending buy and sell positions.
These areas include:
- Swing Highs and Swing Lows: These are peaks and troughs in the market where traders expect resistance or support, leading to the accumulation of orders.
- Support and Resistance Levels: Historical areas that have repeatedly influenced price movements are watched closely for potential liquidity buildup.
- Fibonacci Levels: Common tools in technical analysis; these levels often see a concentration of orders due to their popularity among traders.
The strategy for spotting a sweep involves observing when the price approaches and breaks through these levels. Traders look for a decisive move that extends beyond the identified zones and watch how the asset behaves as it enters adjacent points of interest, such as order blocks. The key is to monitor for a subsequent reversal or deceleration in price movement, which can signal that the sweep has occurred and the market is absorbing the liquidity.
This approach helps traders discern whether a significant movement is likely a result of a sweep, allowing them to make more informed decisions about entering or exiting positions based on the anticipated reversal or continuation of the price movement.
How to Use Liquidity Sweeps in Trading
Traders often leverage liquidity sweeps in forex as strategic indicators within a broader Smart Money Concept framework, particularly in conjunction with order blocks and fair value gaps. Understanding how these elements interact provides traders with a robust method for anticipating and reacting to potential price movements.
Understanding Order Blocks and Fair Value Gaps
Order blocks are essentially levels or areas where historical buying or selling was significant enough to impact an asset’s direction. These blocks can act as future points of interest where the price might react due to leftover or renewed interest from market participants.
Fair value gaps are areas on a chart that were quickly overlooked in previous movements. These gaps often attract price back to them, as the market seeks to 'fill' these areas by finding the fair value that was previously skipped.
Practical Application in Trading Strategies
Learn how liquidity sweeps can be applied to trading strategies.
Identifying the Trend Direction
The application of liquidity sweeps starts with understanding the current trend, which can be discerned through the market structure—the series of highs and lows that dictate the direction of the market movement.
Locating Liquidity Zones
Within the identified trend, traders pinpoint liquidity zones, which could be significant recent swing highs or lows or areas marked by repeated equal highs/lows or strong support/resistance levels.
Observing Order Blocks and Fair Value Gaps
After identifying a liquidity zone, traders then look for an order block beyond this zone. The presence of a fair value gap near the block enhances the likelihood of the block being reached, as these gaps are frequently filled.
Trade Execution
When the price moves into the order block, effectively sweeping liquidity, traders may place limit orders at the block with a stop loss just beyond it. This action is often based on the expectation that the order block will trigger a reversal.
Utilising Liquidity Sweeps for Entry Confidence
The occurrence of a sweep into an order block not only triggers the potential reversal but also provides traders with greater confidence in their position. This confidence stems from the understanding that the market's momentum needed to reach and react at the block has been supported by the liquidity sweep.
By combining these elements—trend analysis, liquidity zone identification, and strategic use of order blocks and fair-value gaps—traders can create a cohesive strategy that utilises sweeps to enhance decision-making and potentially improve trading results.
The Bottom Line
Understanding liquidity sweeps offers traders a critical lens through which to view market dynamics, revealing deeper insights into potential price movements. For those looking to apply these insights practically, opening an FXOpen account could be a valuable step towards engaging with the markets more effectively and leveraging professional-grade tools to navigate liquidity phenomena.
FAQs
What Is a Liquidity Sweep?
A liquidity sweep occurs when large market participants activate significant orders within liquidity zones, causing rapid price movements. It's a strategic manoeuvre to capitalise on accumulated buy or sell orders at specific price levels.
What Is a Sweep Trade?
A sweep trade is a large order executed through multiple different areas on a chart and venues to optimise execution. This is common in both equities and derivatives trading to minimise market impact.
How to Spot a Liquidity Sweep?
Liquidity sweeps can be identified by sudden, sharp movements towards areas dense with orders, such as previous swing highs or lows or known support and resistance levels, followed often by a rapid reversal.
What Is the Difference Between a Liquidity Sweep and a Liquidity Grab?
A liquidity sweep is a broader market move activating a large volume of orders across a range of prices. In contrast, a grab is a quick, targeted action to hit specific order levels before the price reverses direction.
This article represents the opinion of the Companies operating under the FXOpen brand only. It is not to be construed as an offer, solicitation, or recommendation with respect to products and services provided by the Companies operating under the FXOpen brand, nor is it to be considered financial advice.

Understanding ICT Classic Weekly Profile on BANKNIFTYICT weekly profiles are conceptual frameworks that describe typical patterns of price behavior during a trading week.
Each ICT weekly profile has unique characteristics that can hint the traders in anticipating potential market movements.
However, it is important to note that these profiles are not fixed predictions but rather frameworks to understand market tendencies and works with Higher Time Frame PD arrays confluences.
ICT weekly profile is explained below with BANKNIFTY Chart analysis
Classing Thursday High of Week (Bearish Setup)
Key element to focus :
Higher Time Frame Premium array (Weekly Buy Side Liquidity) for bearish setup
Time Frames alignment :
HTF --> W1 (PD Arrays)
LTF ---> H4 (Market Structure)
ETF --> M15 (Entry)
Process :
1. Market offers Liquidity from Monday to Wednesday
2. Market seeks Liquidity on Thursday
3. Market rebalances on Friday

What is liquidityLiquidity is the market's fuel to run the market further market drives from internal liquidity to external liquidity which is also called ERLIRL in short form it's the place where most of the stop loss get hunts and market shift to opposite direction

Mastering High Probability Trading Across All AssetsGreetings Traders!
Welcome back to today’s video! In this session, we're revisiting the critical concept of draw on liquidity. I'll guide you on how to take advantage of it with extreme market precision, focusing on when to trade, when to avoid the market, and how to increase your chances of high-probability trade outcomes.
If you're looking to enhance your trading strategy and make smarter decisions, this video is for you. Let's dive in and start mastering these concepts!
Refer to these videos as well:
Premium Discount Price Delivery in Institutional Trading:
Mastering Institutional Order-Flow Price Delivery
Quarter Theory Mastering Algorithmic Price Movements:
Best Regards,
The_Architect

Understanding Trend Analysis, SMT and ICT ConceptsIn this video, I'll delve into the concept of Institutional Market Structure, a vital tool for trend analysis. Specifically, we'll explore the Smart Money Tool/Technique (SMT), which provides insights into whether a market will continue its trend or potentially reverse. Understanding these concepts is crucial for effective trading strategies. Sit back, relax, and enjoy the video!
Please do leave any questions in the comment section if you have any.
Kind Regards,
The_Architect

Fair Value Gap Trading StrategyFair Value Gap Trading Strategy
To implementing a fair value gap as a trading strategy you need to understand these three basic components of this trading strategy.
Time
Liquidity Hunt
Market Structure Shift
Fair Value Gap
Let’s begin by discussing the importance of time in trading. According to ICT Trader, time is considered to be fractal, meaning that what happens on higher time frames is reflected in lower time frames if studied in the proper context.
In this context, fractal refers to the idea that patterns and behaviors observed on longer time frames, such as daily or weekly charts, can be seen in shorter time frames, like hourly or minute charts.
By studying price action and market behavior across different time frames, traders can gain a deeper understanding of market dynamics and potentially identify profitable trading opportunities.
Time indeed holds significant importance in the fair value gap trading strategy, particularly when it comes to identifying favorable trading setups. Despite the forex market being open 24 hours a day, not all times present ideal conditions for executing fair value gap trades. That’s where the concept of ICT Kill Zones comes into play.
ICT Kill Zones
ICT Kill Zones refer to specific time periods during the day that have been observed to offer higher probability trading opportunities. These zones are associated with the entry of smart money, which are institutional or banks who have the ability to influence market direction.
In short, ICT Kill Zones correspond to specific time periods during the day that are particularly relevant for trading activities. These zones include the London Open, London Close, New York Open, and New York Close.
Traders using the fair value gap trading strategy often focus on these times as they tend to offer higher probability trading setups. The ICT Kill Zones are associated with the entry of smart money and can provide enhanced opportunities for traders to capitalize on market movements. By aligning their trading activities with these specific time periods, traders aim to improve their chances of success.
Liquidity in FVG Trading Strategy
Liquidity in the market often takes the form of buy stops and sell stops.market makers or smart money intentionally trap retail traders by manipulating prices to trigger their stop losses.
The idea is that they move the market in one direction to hunt for stop losses, causing retail traders to place orders in the false direction and set their stop losses at key levels. After the stop loss hunt, the market reverses in the opposite direction, benefiting the smart money.
Let’s analyze the above chart from a retail trader’s perspective. When we observe the chart, we notice that the price levels between 44240 and 44280 have proven to be strong resistance in the past.
Based on this observation, many retail traders might place their selling pending orders to anticipate of a price reversal at these levels. To manage their risk, they would likely set their stop loss orders just above this resistance area.
What is done by market makers or smart money,they could manipulate the market by initially pushing the price upward, deliberately triggering the stop loss orders placed by retail traders. This action would cause some retail traders to think that a breakout is occurring and prompt them to place buying orders while setting their stop losses at levels below the resistance area.
Once the stop loss orders have been hunted and triggered, the market makers or smart money may then reverse the price direction.
Enhancing Trading Success with the Fair Value Gap Entry Strategy
After a liquidity hunt on a higher time frame, you suggest switching to lower time frames such as 15 minutes, 5 minutes, 3 minutes, or even 1 minute to identify certain patterns that may emerge following the stop loss hunt. These patterns include:
1.Sudden or sharp price movements: Following the liquidity hunt, you may observe rapid and significant price fluctuations on the lower time frames.
This sharp movement causing market structure shift and provide an extra confluence.
2. Fair value gap (FVG): Look for gaps between the current price and the fair value of the asset. The fair value represents the equilibrium price based on various factors. Identify instances where the market price deviates significantly from this fair value.
3. Entry position based on the Fair Value Gap strategy: Once you spot a fair value gap pattern after the liquidity hunt, you can consider taking a position in anticipation of the market filling that gap. The expectation is that the market will eventually return to the fair value price.
It’s important to carefully train your eyes to recognize these patterns after a liquidity hunt and patiently wait for the market to come back and fill the identified gap. Once you have identified a suitable entry position, you can place your stop loss order above the first candle to manage your risk.
Please note that implementing such strategies requires careful analysis, experience, and a deep understanding of the specific market you are trading. It’s crucial to conduct thorough research, backtest your strategy, and consider other factors that may influence price movements before making any trading decisions.

🔄 ETC vs ETH Liquidity pool compariosnEthereum Classic (ETC) and Ethereum (ETH), two prominent cryptocurrencies, often find themselves compared due to their shared history. An intriguing aspect of their comparison is the formation of a similar liquidity pool from below, providing valuable insights into their respective price actions.
📉 Common Liquidity Pool Formation:
Both ETC and ETH experienced the creation of a substantial liquidity pool from below, a phenomenon that typically precedes significant market movements. This liquidity pool acted as a catalyst, setting the stage for a potential upward surge.
🔄 Diverging Paths:
Despite the shared liquidity pool formation, the subsequent actions of ETC and ETH diverged significantly. Ethereum Classic (ETC) managed to seize a considerable portion of this liquidity, leading to a robust price rally. In contrast, Ethereum (ETH) opted for a different trajectory, establishing a higher low and retaining a portion of the liquidity.
🚀 Ethereum Classic (ETC) Performance:
ETC showcased notable strength, evidenced by its impressive surge of over 70%. The strategic utilization of the formed liquidity pool contributed to this bullish momentum, making ETC an attractive option for traders and investors during this period.
📈 Ethereum (ETH) Resilience:
Ethereum (ETH), opting for a conservative approach, demonstrated resilience by forming a higher low and retaining a portion of the liquidity pool. While ETH experienced positive price action, the magnitude of the surge was comparatively moderate, registering an approximately 30% increase.
🔍 Key Takeaways:
Differential Strategies: ETC and ETH employed different strategies in responding to the formed liquidity pool, influencing their subsequent price movements.
ETC's Aggressive Rally: ETC's more aggressive approach in capturing liquidity translated into a robust price rally.
ETH's Conservative Stance: ETH, adopting a more conservative stance, showcased resilience but with a relatively milder price increase.
🔮 Unlock Exclusive Insights:
Unlock my 3 crypto trading indicators for FREE! Links are below 🔗
Note: Cryptocurrency markets are dynamic, and past performance is not indicative of future results. Traders are advised to conduct thorough research and exercise caution in their investment decisions.

Liquidity - How to easily spot it!Here's how you can easily use liquidity to create wealth 🤑
Knowing how to identify liquidity is an important aspect of trading that shouldn't be overlooked, BUT contrary to popular belief, it's not the greatest thing since sliced bread...
It does have its significance and it's place, but understanding WHY "liquidity" is formed is more important than the WHERE ...
Once you know why, you can slay hard every single day!
Follow me for more educational posts and market analysis:)
Anyway, that's all for now,
Hope this post helps and as usual...
Happy Hunting Predators
🦁🐯🦈

Trading sessions liquidity huntLiquidity serves as the driving force behind all markets. The fundamental driver of any price shift involves the creation and aggregation of liquidity, with the objective of accumulating or distributing positions among market participants.
Accumulating positions necessitates counter liquidity to fulfill orders and initiate positions in the desired volume. Liquidity is therefore established within specific price ranges, with the intention of later manipulating it toward the accumulation of counter liquidity, ultimately achieving the goals of order fulfillment.
The bulk of liquidity, including stop orders and liquidations, tends to congregate around technical and psychological support/resistance levels, which can be observed retrospectively through the analysis of clusters and volume profiles.
Engaging in trading based on a one-time reaction, characterized by a substantial cluster forming during the breach of a particular price level, can lead to premature entry and potential losses, driven by inaccurate expectations of either a price breakthrough or deviation from calculated reference points
- An approach that leans towards caution, involving the selection of a trading setup once liquidity has been obtained from the previous trading session's highs/lows within the prevailing trend. This process is carried out while ensuring alignment between higher and lower timeframes.
- The primary objective is capital preservation, which is accomplished by minimizing risk to the range of 0.5-1% per trade and adjusting open positions to the break-even point after confirming the trend's structure.
- The strategy opts for an entry technique that boasts a high mathematical expectation of success.
- Fresh positions are initiated exclusively during periods of elevated market volatility, particularly during the optimal trade time (OTT) sessions in London and New York.
The focus is directed towards trading setups featuring risk:reward ratios ranging from 1:3 to 1:10.
Given the dynamics of market participants accumulating and distributing their positions during trading sessions, it's reasonable to assert that liquidity forms outside the fluctuations of these sessions. This liquidity is typified by stop orders and position liquidation within the scope of a micro-trend.
Consequently, it can be inferred that the commencement of the subsequent session will involve manipulation. The aim of this manipulation is to interact with such liquidity to amass positions in the opposite direction. Coupled with heightened volatility during the session's commencement, this provides opportunities to initiate positions before the impending price movement.
The primary criterion for entering a position will be the disruption of the existing structure following the capture of liquidity. Additional factors might encompass corrective momentum, liquidity in the opposing direction acting as an attraction for distributing accumulated positions during manipulation, and the formation of trading ranges with deviations, among others.
Entry into a position occurs on a lower time frame, emanating from an untested supply/demand zone. An additional aspect to consider is the presence of local liquidity before reaching the entry point.

Draw the MASTER PATTERN CONCEPTS by handHOW TO MANUALLY DRAW THE MASTER PATTERN CONCEPTS
# STEP 1 - Identify the Contraction Phase
The contraction phase consists of a tightening of price where there is a simultaneous lower high and higher low, this is where the supply and demand equalize in the market. This is a leading indication that volatility is coming next.
You want to look for places where you find contraction/constriction of price, where it clearly looks like its moving into a defined consolidation zone.
STEP 2 - Identify the Expansion Phase
The expansion phase is the 2nd phase in the market, its known as the manipulation phase. It reveals incoming volatility entering into the market, this is where most retailers lose their money.
This phase can be defined as price breaking out of the contraction box, and whip sawing around the value line. This is the accumulation phase where the market makers accumulate their inventory from weaker hand holders.
Price usually whipsaws around the value line 4-7 times before the 3rd phase in the market starts, which is the trend phase.
STEP 3 - Identify Liquidity Lines
Liquidity lines are where the retailers place their stop losses, it is an excellent places to enter and exit the market.
These can be defined as HH or LL points on the chart where there are swing high and swing low points. By anticipating where these stop loss levels are located you can be aware where there are pools of resting liquidity. These are excellent places to enter or exit the market.
Understanding Contraction / Expansion and Liquidity are key price action concepts that help you understand trading from an institutional level and give you a deeper insight into the intentions of the market.

How to trade Liquidity Sweeps 🌊 Trading liquidity sweeps 🌊 and identifying fake liquidity grabs 🕵️♂️ can be valuable skills for traders. These strategies involve capitalizing on market inefficiencies and understanding how institutional traders and algorithms influence price movements. In this guide, we'll explore what liquidity sweeps and fake liquidity grabs are and how to trade them effectively.
Understanding Liquidity Sweeps:
A liquidity sweep occurs when a trader executes a large market order that "sweeps" through the order book, clearing out available liquidity at various price levels. These sweeps often signal strong buying or selling interest, potentially leading to significant price moves.
Identifying Fake Liquidity Grabs:
Fake liquidity grabs 🎭 are market manipulation techniques used to deceive traders. Market makers or large players might place large orders on the order book to give the illusion of significant interest at a specific price level. However, they often cancel these orders before they get executed, leading to sudden reversals in price.
Trading Liquidity Sweeps:
Monitor Order Flow: Keep an eye on order flow and trade volume to identify sudden surges in trading activity. Liquidity sweeps are often accompanied by spikes in volume.
Identify Key Levels: Look for important support or resistance levels where liquidity sweeps are likely to occur. These levels can be based on technical analysis, such as previous highs or lows.
Entry and Stop-loss: Enter a trade when you spot a liquidity sweep that confirms your bias. Set stop-loss orders to manage risk in case the market moves against you.
Take Profits: Take profits when the market reacts as expected, but be prepared for quick price reversals. Liquidity sweeps can be followed by retracements.
Trading Fake Liquidity Grabs:
Be Cautious: Approach price moves driven by apparent liquidity grabs with caution. These moves can be short-lived.
Confirm Price Action: Wait for confirmation of the direction after the fake liquidity grab. Look for signs that real market sentiment is driving the price.
Risk Management: Place stop-loss orders to protect your capital in case the market reverses quickly. Avoid chasing the initial price move.
Use Additional Indicators: Combine your analysis with other technical indicators or market sentiment tools to increase your confidence in your trading decisions.
Conclusion:
Trading liquidity sweeps and fake liquidity grabs can offer opportunities for profit, but they also come with risks. It's essential to have a clear strategy, strict risk management rules, and the ability to adapt to rapidly changing market conditions. As with any trading strategy, practice and experience will help refine your skills in identifying and capitalizing on these market dynamics. 🚀📈🌊

Mastering Liquidity in Trading: Unraveling the Power of SMC 🔥Liquidity is what moves the market. Liquidity and liquidity pools are created and targeted by the markets and a lack of understanding on this topic is the main reason why the trading mind fails even if the analyst mind is correct. Traders who have been victim to their stop losses being taken by a wick before price running in their favour are the perfect example of having the correct analytical mind but a weak trading one.
Liquidity is unlike an order block or price inefficiency or anything else that can be physically identified on a chart. It is invisible, however, it is still possible to identify without the need of indicators or anything other than price action alone.
Simply put, liquidity is money in the market. Typically, this money comes in the form of retail orders and stop losses. Knowing this allows us to understand that if the market targets liquidity, and liquidity comes in the form of retail stop losses, the market must be hunting and going against retail strategies.
🟢The first and most prominent of these retail strategies is the idea of support and resistance. On the chart we can see an example of what retail traders would refer to as a level of resistance. In doing this they would short price from this level expecting a move down. This creates a liquidity pool just above this ‘resistance level’ where the average retail trader would place their stop losses. This liquidity pool is now a target for the market. So instead of trading this move down, we wait for the liquidity grab and use the rest of this strategy to capitalise on the bearish move that we can expect.
On the Chart is a demonstration of the market hunting liquidity before making its next move. Again this is where traders would be correct in terms of bias but incorrect in terms of trading.
This is an example of what an informed chart looks like. Instead of highlighting support and resistance levels, we highlight equal lows and equal highs respectively. Equals are usually in the form of otherwise referred to double tops or double bottoms but can also be more than that. The key difference, however, is that we would anticipate the market hunting the liquidity above the equal highs and below the equal lows. Due to this, we avoid being a victim to the market stopping us out by a wick and falling in our direction.
The second most prominent retail strategy or idea is the trend-line. Every time a trend-line formation is present within the market, we can now understand the amount of stop losses and, therefore, liquidity that would be sitting under this ‘trend-line’.
Above is an example of the importance of recognising trend-line liquidity. Once the liquidity above the equal highs has been hunted, we need to establish the next liquidity pool in the market. Seeing a break above the ‘resistance level’ would be seen as a ‘bullish breakout’ by the average trader. However, we can identify that as a liquidity purge and higher high, in which case we can expect a higher low to be made - which would mean a bearish retracement.
On top of this, we can see a build up of trend-line liquidity just above the discount end of the parent price range. This gives us an added confluence and confidence in the fact that we can expect lower prices with the liquidity underneath the trend-line as our first target.
Above is an example of liquidity being grabbed on the bullish side (above the equal highs) sending the uninformed trader long based off of a ‘bullish breakout’, then hunting the liquidity on the bearish side (below the trend-line) and sending the uninformed trader short based off of the break of the trend-line. This is typical of the market - it shakes out impatient and uninformed traders on both sides of the market before making the actual move.
Here is another examples of how trendline liquidity gets purged by the market. On the chart we can see a trend-line where many traders would be longing the market, unaware that they will be victims of a liquidity purge.
Below we can see that liquidity purge below the trend-line which would send the average trader short. Using the rest of the strategy, we are able to understand that price will react from specific levels to go long
Below we can see the completion of this market cycle with our levels being respected and the real bullish leg being made.
🔥🟠🔥🔥🟠🔥 BONUS CHEATSHEETS👇👇👇👇

Learn to identify liquidity levels. Before we begin, we need to understand what liquidity is.
A market with high liquidity is one where there is a large number of buyers and sellers willing to trade in that particular asset. This means that there is a high availability of buy and sell orders, allowing transactions to be executed quickly and with minimal impact on prices.
Where are the most liquid points located on a chart?
These points are found at the highs and lows. This is because at these points, many people are waiting for the zone to act as support or resistance, or for the price to break the zone (breakout) to continue its direction. I always use daily, weekly, and monthly timeframes to identify these zones.
Why the liquid points are importante on a chart?
Liquidity is extremely important because it is the direction in which the price moves. The price will always move towards these points to attract liquidity to the market. Without liquidity, financial markets cannot function.
Which indicator can you use to identify liquidity levels?
Previous Days Week Highs & Lows by sbtnc
Certainly, this indicator will facilitate the process of identifying these points, but it will not identify all of them.
-----Remember, like everything in trading, this needs to be combined with other confluences. It won't work by itself.-----
Explanation of the example presented in the chart.
I had some strong confluences indicating that the price was likely to have a bullish move. As seen in the COT report, there was aggressive selling of JPY. One of the things that helped me take this trade with confidence is that, as you can see in the circle, there was a weekly and monthly high together without being cleared. This created a double top pattern. Since this was such a liquid point, it gave me the confidence that the price would move towards this point before changing direction. And it did exactly that after consolidating for several days. These liquidity points can be used as confluence in our analysis, as well as a potential take profit level.

LESSON 1: TRADE THE LIQUIDITY OR BE THE LIQUIDITYWhat is Liquidity in Forex Trading?
Liquidity is the presence of orders at specific prices in the market, ensuring that transactions can take place without disruptions. When traders talk about liquidity, they are usually referring to the resting orders in the market. These orders can be absorbed or targeted by banks and financial institutions (BFIs) to influence the patterns of price movement. Liquidity can be found throughout the market, although certain areas may have higher levels than others. The good news is that it is indeed possible to learn how to identify and recognize liquidity patterns.
Liquidity comprises a variety of orders that gather in the market, including limit orders, stop loss orders, and stop limit orders. These orders come into play when prices reach specific levels of supply or demand in the market. Understanding liquidity is essential in comprehending how prices move.
Why do you need to understand Liquidity?
Liquidity is crucial for predicting price movements. Analyzing liquidity, along with market structure, supply and demand, and order flow, provides insights into potential price directions. It's important to consider liquidity alongside trend analysis and supply and demand to understand market conditions effectively. Highly liquid markets can be manipulated by large banks or institutions, leading to liquidity shortages, price slippage, and poor trade execution. Recognizing liquidity pools during slow sideways price movements is key.
What are the main types of Liquidity in Forex trading?
1. Buy-side liquidity (see chart for example)
Buy-side liquidity refers to the accumulation of orders above a range or high, including buy-stop limits and stop losses placed by sellers and breakout traders. Banks and financial institutions (BFIs) may target these orders to fuel temporary or sustained bullish price movements.
2. Sell-side liquidity (see chart for example)
Sell-side liquidity refers to the collection of orders situated below a range or low, including sell-stop limits and stop losses placed by buyers and breakout traders. Banks and financial institutions (BFIs) can target these orders to generate temporary or sustained bearish price movements. Similar to buy-side liquidity, sell-side liquidity serves a crucial role in the market dynamics.
Do you have any questions? feel free to ask.
Cheers,
David

📊Liquidity GrabSmall and big players tend to acquire larger positions in the market than they can afford, in an attempt to benefit from the leverage. This is where the concept of liquidity grab comes into play. Large trades and institutional investors need to locate liquidity areas in the market to complete their trades. Stops and stop-loss orders are critical for survival in a leveraged market. Stop hunting is a common practice in Forex trading, where traders are forced to leave their positions by triggering their stop-loss orders. This can create unique opportunities for some investors, which is called a liquidity grab. Stop hunting is a trading action where the price and volume action threatens to trigger stops on either side of support and resistance. When a large number of stops are triggered, the price experiences higher volatility on more orders hitting the market. Such volatility in price generates opportunities for participants to enter a trade in a favourable environment or protect their position. The fact that too many stop losses triggered at once result in sharp moves in the price action is the reason behind the practice of liquidity grab.
📍 What is liquidity sweep?
In trading, a liquidity sweep is the process of filling an order by taking advantage of all available liquidity at multiple price levels. Traders use this method to ensure their orders are filled at the best possible price by breaking up their order into smaller sub-orders and spreading them across multiple price levels. Institutional traders and high-frequency trading firms commonly use liquidity sweeps for efficient and quick execution of large trade volumes.
📍 Liquidity Zones
Big players in trading aim for the best prices but face challenges finding sufficient counter-forces to fill their large orders. Entering the market at low liquidity areas creates more volatile markets, negatively impacting the average price. Conversely, entering at high liquidity areas results in less volatile markets, ensuring a better average price for the position. These liquidity zones are where stop-loss orders are placed, and the concept of "liquidity grab" comes from the need for big players to enter the market in these zones to take large positions. Traders use swing lows and swing highs to create these liquidity zones and place stops as reference points, resulting in either a reversal to the mean or a breakout of the level.
👤 @AlgoBuddy
📅 Daily Ideas about market update, psychology & indicators
❤️ If you appreciate our work, please like, comment and follow ❤️

CONSOLIDATION RANGE AND WHAT IT MEANSThere is a trick that market makers use and that is to create consolidations in order to induce retail entries. In text book practice, retail traders will always view a resistance or support level that has been tested more than once as a strong area to do entries because they feel it will hold price. As a result they put stop losses above or below the entry and these stop losses increase as market makers consolidate and incubate more retail traders entries. Remember market makers need these stop loss pools in order for them to open their huge positions so afterwards, they will run these stop losses, enter their orders and inject liquidity to move price very quickly. So beware not to buy at the current NZDUSD equal lows. You'll be trapped!

Don't be liquidityThis chart shows the common stop-loss touch and bounce pattern. And this happened because I was liquidity.
The stop-loss was set at an "obvious" invalidation level, the previous supply level ($20,800). So, right below it, there was heavy bidding.
The stop-loss hunters will place their bids just slightly below presumed ask levels.

Sell & Buy Side Liquidity ✅✅✅✔️ The FOREX market is a zero sum game, which means that for a trader/institution to buy/sell 1 currency pair it's necessary that there is another trader/institution with an opposite position. If Smart Money (Banks) want to buy a currency pair they will need sellers in the market, the existing facility to place these positions In the market is called LIQUIDITY.
✔️ The Liquidity is defined by Stop losses, where the Stop losses exist is where the liquidity also exists, Smart Money need to activate the stop losses of existing orders in the market so that they can place their positions in the market.
✔️ In the FOREX market there are two types of liquidity, which are:
1. Buy Stops Liquidity ( BSL ) - The BSL is originated by Stop Losses of sell orders, after the BSL is taken, the market reverses to the downside, because banks use
the BSL to place sell orders in the market.
2. Sell Stops Liquidity ( SSL ) - The SSL is originated by Stop Losses of Buy orders, after the SSL is taken, the market reverses to the Upside, because banks use the
SSL to place Buy orders in the market.
✔️ PMH & PML - Previous Month High & Low
PWH & PWL - Previous Week High & Low
PDH & PDL - Previous Day High & Low
HOD & LOD - High Of Day & Low Of Day
OLD HIGH & Low - Swing High & Low
EQUAL HIGHS & LOWS = Retail Resistance & Support

Why price reacts to s&d zones before breaking themWhy price reacts to s&d zones before breaking them.
We tend to see a reaction for one simple reason;
- BFI's need liquidity to accumulate a sizable position.
So, how would a reaction provide them with this liquidity?
- Retail traders will enter aggressively at these s&d zones
expecting price to move away from them. Now, BFI's will
use all this liquidity to accumulate a sizable position,
targeting the next pool of liquidity which is
retail's stop-losses on the opposite side of the zone.
