Radio Yerevan: Is Crypto the Biggest Wealth Transfer in History?Answer: Yes. But not in the direction people hope.
In the last decade, crypto marketing has repeated one grand promise:
“This is the biggest wealth transfer in human history!”
And in classic Radio Yerevan fashion, this statement is both true and misleading.
Yes — a historic wealth transfer took place.
No — it did not empower the average investor.
Instead, it efficiently moved wealth from retail… back to the very entities retail thought it was escaping from.
Let’s break it down: structured, clear, and with just the right amount of irony.
1. The Myth: A Decentralized Financial Uprising
The early crypto narrative was simple and beautiful:
- The people would reclaim financial independence.
- The system would decentralize power.
- Wealth would flow from institutions to individuals.
The idea was inspiring — almost revolutionary.
Reality check: Revolutions are expensive.
And someone has to pay the bill.
In crypto’s case, the average investor volunteered enthusiastically.
2. The Mechanism: How the Transfer Actually Happened
To call crypto a wealth transfer is not an exaggeration.
The numbers speak loudly:
Total market cap peaked above $3+ trillion.
Most of the profit was extracted by:
- VCs who bought early,
- teams with massive token allocations,
- exchanges capturing fees on every trade,
- and whales who mastered liquidity cycles.
Retail investors, meanwhile, contributed:
- capital,
- liquidity,
- hope,
- hype
- and a remarkable tolerance for drawdowns.
It was, in essence, the perfect economic loop:
money flowed from millions → to a concentrated few → exactly like in traditional finance, only faster and with better memes.
3. The Irony: A Centralized Outcome From a Decentralized Dream
Here lies the great contradiction:
Crypto promised decentralization. Tokenomics delivered centralization.
When 5 wallets hold 60% of a token’s supply, you don’t need conspiracy theories — you need a calculator.
The “revolution” looked more like:
- Decentralized marketing
- Centralized ownership
- Retail-funded exits
- And a financial system where “freedom” was defined by unlock schedules and vesting cliffs
But packaged correctly, even a dump can look like innovation.
4. Why Retail Was Doomed From the Start
Not because people are unintelligent, but because:
- No one reads tokenomics.
- Unlock calendars sound boring.
- Supply distribution charts kill the romance.
- Liquidity mechanics are not as exciting as „next 100x gem”.
- And hype travels faster than math.
In a speculative market, psychology beats fundamentals until the moment fundamentals matter again — usually when it's too late.
5. The Real Wealth Transfer: From “Us” to “Them”
The slogan said:
“Crypto will redistribute wealth to the people!”
The chart said:
“Thank you for your liquidity, dear people.”
The actual transfer looked like this:
- Retail bought the story.
- Institutions created the tokens.
- Retail bought the bags.
- Institutions sold the bags.
- Retail called it a correction.
- Institutions called it a cycle.
Everyone had a term for it.
Only one group had consistent profits from it.
6. So, Was It the Biggest Wealth Transfer in History?
Yes.
But not because it made the average investor rich.
It was the biggest because:
- no previous financial system mobilized so many people
- so quickly
- with so little due diligence
- to transfer so much capital
- to so few beneficiaries
- under the banner of liberation.
It wasn’t a scam.
It wasn’t a conspiracy.
It was simply financial physics meeting human psychology.
7. The Lesson: Crypto Isn’t the Problem — Expectations Are
- Blockchain remains a brilliant invention.
- Tokenization has real use cases.
- DeFi is a groundbreaking paradigm.
- And so on
The issue wasn’t the technology.
It was the narrative that convinced people that buying a token was equivalent to buying financial freedom.
Real freedom comes from:
- understanding liquidity,
- reading tokenomics,
- respecting supply dynamics,
- and asking the only question that matters:
“If I’m buying… who is selling?”
In markets — especially crypto — this question is worth more than any airdrop.
8. Final Radio Yerevan Clarification
Question: Will the next crypto cycle finally deliver the wealth transfer to the masses?
Answer: In principle, yes.
In practice… only if the masses stop donating liquidity.
Community ideas

Bitcoin: Relevant Signals from the DSS BressertTechnical analysis provides trend-following indicators and indicators designed to measure the strength of a trend — these belong to what we call momentum indicators. A weakening bearish trend is always the first stage of a bullish reversal, and a tiring bullish trend is always the first step toward a downward reversal. Today, I propose a focus on the DSS Bressert technical indicator, which captures these transition phases between bearish and bullish trends quite well, especially on the weekly timeframe, which helps to project several weeks ahead.
1) How does the DSS Bressert work?
The DSS Bressert (Double Smoothed Stochastic) is an advanced variant of the traditional stochastic. Its goal is to measure the price’s position relative to its high/low range over a given period while filtering out short-lived fluctuations. Whereas the classical stochastic can be very reactive — sometimes too much — the DSS uses two successive smoothing steps, allowing the signal to better reflect genuine momentum rotations.
Concretely, it oscillates between 0 and 100.
• Above 80, the zone is generally considered a potential upside excess: not an automatic sell signal, but an indication that the bullish trend may be mature.
• Below 20, we are in a potential oversold area, often associated with the end of bearish cycles or accumulation zones.
The crossover between the two curves (fast and slow) provides additional information about reversals. On a weekly timeframe, these signals gain relevance as they align with Bitcoin’s larger market movements, which are far less noisy than on the daily chart.
2) Why does the DSS Bressert align well with Bitcoin’s cycles?
Historically — based on the last cycles visible on the weekly chart — the DSS Bressert has aligned well with Bitcoin’s tops and bottoms. During major peaks, the indicator has consistently been in the upper zone, sometimes diverging from the price ahead of corrections. Likewise, market bottoms have almost always coincided with a DSS dropping below 20 before a bullish crossover.
In the current situation, the DSS once again seems to be moving in a lower zone, typical of market breathing phases. This does not guarantee an immediate reversal, but the combined price + momentum setup suggests a context more favorable to a rebound in the coming weeks — especially since Bitcoin is still supported by upward-sloping weekly moving averages, notably the 100-week exponential moving average.
However, this technical reading must be nuanced. The next meeting with the Fed this Wednesday, December 10, remains a major risk: any modification in monetary guidance could fuel short-term volatility and temporarily invalidate the technical signals. The DSS provides a cyclical view, but it cannot factor in macroeconomic and monetary shocks in advance.
In summary: technical conditions favor a rebound scenario, but caution remains essential as the market awaits the Fed this Wednesday, December 10.
DISCLAIMER:
This content is intended for individuals who are familiar with financial markets and instruments and is for information purposes only. The presented idea (including market commentary, market data and observations) is not a work product of any research department of Swissquote or its affiliates. This material is intended to highlight market action and does not constitute investment, legal or tax advice. If you are a retail investor or lack experience in trading complex financial products, it is advisable to seek professional advice from licensed advisor before making any financial decisions.
This content is not intended to manipulate the market or encourage any specific financial behavior.
Swissquote makes no representation or warranty as to the quality, completeness, accuracy, comprehensiveness or non-infringement of such content. The views expressed are those of the consultant and are provided for educational purposes only. Any information provided relating to a product or market should not be construed as recommending an investment strategy or transaction. Past performance is not a guarantee of future results.
Swissquote and its employees and representatives shall in no event be held liable for any damages or losses arising directly or indirectly from decisions made on the basis of this content.
The use of any third-party brands or trademarks is for information only and does not imply endorsement by Swissquote, or that the trademark owner has authorised Swissquote to promote its products or services.
Swissquote is the marketing brand for the activities of Swissquote Bank Ltd (Switzerland) regulated by FINMA, Swissquote Capital Markets Limited regulated by CySEC (Cyprus), Swissquote Bank Europe SA (Luxembourg) regulated by the CSSF, Swissquote Ltd (UK) regulated by the FCA, Swissquote Financial Services (Malta) Ltd regulated by the Malta Financial Services Authority, Swissquote MEA Ltd. (UAE) regulated by the Dubai Financial Services Authority, Swissquote Pte Ltd (Singapore) regulated by the Monetary Authority of Singapore, Swissquote Asia Limited (Hong Kong) licensed by the Hong Kong Securities and Futures Commission (SFC) and Swissquote South Africa (Pty) Ltd supervised by the FSCA.
Products and services of Swissquote are only intended for those permitted to receive them under local law.
All investments carry a degree of risk. The risk of loss in trading or holding financial instruments can be substantial. The value of financial instruments, including but not limited to stocks, bonds, cryptocurrencies, and other assets, can fluctuate both upwards and downwards. There is a significant risk of financial loss when buying, selling, holding, staking, or investing in these instruments. SQBE makes no recommendations regarding any specific investment, transaction, or the use of any particular investment strategy.
CFDs are complex instruments and come with a high risk of losing money rapidly due to leverage. The vast majority of retail client accounts suffer capital losses when trading in CFDs. You should consider whether you understand how CFDs work and whether you can afford to take the high risk of losing your money.
Digital Assets are unregulated in most countries and consumer protection rules may not apply. As highly volatile speculative investments, Digital Assets are not suitable for investors without a high-risk tolerance. Make sure you understand each Digital Asset before you trade.
Cryptocurrencies are not considered legal tender in some jurisdictions and are subject to regulatory uncertainties.
The use of Internet-based systems can involve high risks, including, but not limited to, fraud, cyber-attacks, network and communication failures, as well as identity theft and phishing attacks related to crypto-assets.

AI Trading: The Revolution You Can't IgnoreThe Era of AI Trading Has Arrived And It's Only Getting Started
Forget the movie version of AI glowing red eyes flawlessly predicting every tick. The real story is colder, quieter, and way more powerful:
We are moving from a world where humans look at charts to a world where machines digest every tick, every candle, every flow of data… and feed you the edge you couldn't see on your own.
Right now, as you read this, AI is already sitting inside:
Execution algorithms routing institutional orders across venues
Risk engines stress testing portfolios in milliseconds
News and sentiment scanners parsing thousands of headlines a minute
Retail tools that turn a paragraph of English into working NYSE:PINE Script
This isn't science fiction. This is the baseline. And the baseline is rising.
The traders who survive this decade won't be the ones fighting AI. They'll be the ones partnering with it.
So What Exactly Is "AI Trading"?
At its core, AI trading is simply using algorithms that can learn from data to make parts of the trading process smarter.
That can mean anything from a small script that filters charts for you, all the way up to full stack systems managing billions. The spectrum looks like this:
AI Assisted Analysis You still click the buttons, but AI does the heavy lifting.
Pattern recognition on charts (trend, ranges, breakouts)
Scanning hundreds of symbols for your exact conditions
Sentiment analysis on news and earnings headlines
Idea generation: "Show me all large‑cap stocks breaking out with above‑average volume"
AI‑Generated Signals The machine tells you what it would do; you decide whether to listen.
Multi‑indicator models that output clear long/short/flat signals
Quant models that score each asset from 0-100 based on your rules
Bots that push alerts when high‑probability setups appear
Fully Automated Trading The system trades end‑to‑end while you supervise.
Execution from signal → order → risk control with no manual clicks
Self adjusting position sizing and risk controls
Strategies that re‑train on fresh data as regimes shift
Wherever you are on that spectrum, you're already in the AI game. The question isn't "Will I use AI?" it's "How deeply will I let it into my process?"
How AI Actually "Sees" the Market
Humans see a chart. AI sees a dataset.
Human view:
One instrument at a time
A couple of timeframes
A handful of indicators you like
Heavily filtered through emotion and bias
AI view:
Thousands of symbols at once
Dozens of timeframes and derived features
Years of historical data compressed into patterns
Zero fear, zero FOMO, zero boredom
Feed a model clean data and it can uncover:
Regimes you feel but can't quantify (trend, chop, grind, panic)
Relationships between assets that hold statistically
Behavioral patterns like "late‑day reversals after gap‑up opens"
Execution patterns in the order book around key levels
But here's the crazy part: AI is completely unforgiving about your assumptions.
If the data is noisy, biased, or poorly structured, the model will happily learn the wrong thing and apply it with perfect discipline. "Garbage in, garbage out" gets amplified at machine speed.
The Era We're Entering: Human + AI, Not Human vs AI
Over the next decade, expect three shifts to accelerate:
From Intuition First → Data‑First
Traders will still have hunches, but they'll validate them against hard data.
Instead of "this looks extended", you'll ask the system: "How often do moves like this actually continue?" and get an answer in seconds.
From Single‑Indicator Thinking → Multi‑Signal Models
No more worshiping one magic oscillator.
AI will blend technicals, fundamentals, flows, and sentiment into a unified view.
From Static Systems → Adaptive Systems
Instead of one set of parameters forever, models will adapt as volatility, liquidity, and structure change.
Think of it as a trading playbook that rewrites itself when the game changes.
Technologies like larger language models, specialized chips, and eventually quantum‑accelerated optimization won't magically "solve" markets, but they will make it cheaper and faster to test ideas, build systems, and manage risk.
The edge shifts from "Can I code this?" to "Can I ask the right questions, define the right constraints, and manage the risk around what the models tell me?"
Where You Fit In As a Trader
In the era of AI, your job becomes less about staring at every tick, and more about designing the rules of the game your tools play.
You define what "good" trades look like.
You choose which markets, timeframes, and risks matter.
You decide when a model is behaving, and when it's time to shut it off.
AI gives you:
Speed: scanning what you could never cover alone
Consistency: executing the plan without emotional drift
Feedback: showing you what really works in your own data
You bring:
Context: macro, narrative, and common sense
Values: what risks you refuse to take
Adaptability: knowing when to step back or switch regimes
Put together, that's where the edge lives.
Getting Started in the AI Era (Without Getting Overwhelmed)
You don't need a PhD, a server rack, or a lab full of quants. You can start small and intelligent:
Audit Your Current Process
Where are you slow? (Scanning, journaling, testing?)
Where are you emotional? (Entries, exits, sizing?)
Those are prime targets for AI assistance.
Add One AI Tool at a Time
Maybe it's an AI screener.
Maybe it's an NYSE:PINE Script assistant that helps you code and backtest.
Maybe it's a journaling tool that tags your trades automatically.
Learn to Read the Data Behind the Magic
Look at win rate, drawdown, expectancy.
Compare AI filtered setups to your old ones.
Keep what clearly improves your edge; drop the rest.
Respect the Risks
Over‑fitted models that look perfect on the past.
Black‑box systems you can't explain.
Over‑reliance on automation with no kill switch.
Is AI Going to Take Over Trading Completely?
In some corners of the market, AI and automation already dominate . High‑frequency execution, index rebalancing, options market‑making, these domains are machine territory.
But markets are more than math. They are human fear, greed, regulation, politics, liquidity constraints, structural changes and unexpected shocks. That messy mix is exactly where human oversight still matters.
The most realistic future isn't "AI replaces traders" it's AI replaces undisciplined, unstructured traders who bring nothing but guesses to the table.
Traders who can think in systems, understand risk, and collaborate with machines? They don't get replaced. They get leverage.
Your Turn
Where are you right now in this evolution?
Still fully manual, doing everything by hand?
Using a few AI assisted tools but not trusting them yet?
Already running bots and systematic strategies?
What part of AI trading are you most curious or skeptical about?
And the big question: Do you think the future of trading belongs to AI, or to traders who know how to use it?
Drop your thoughts in the comments this era is just beginning.

From Neckline to Target: Setting H&S Bearish Entries and ExitsUnderstanding the Head & Shoulders Breakdown
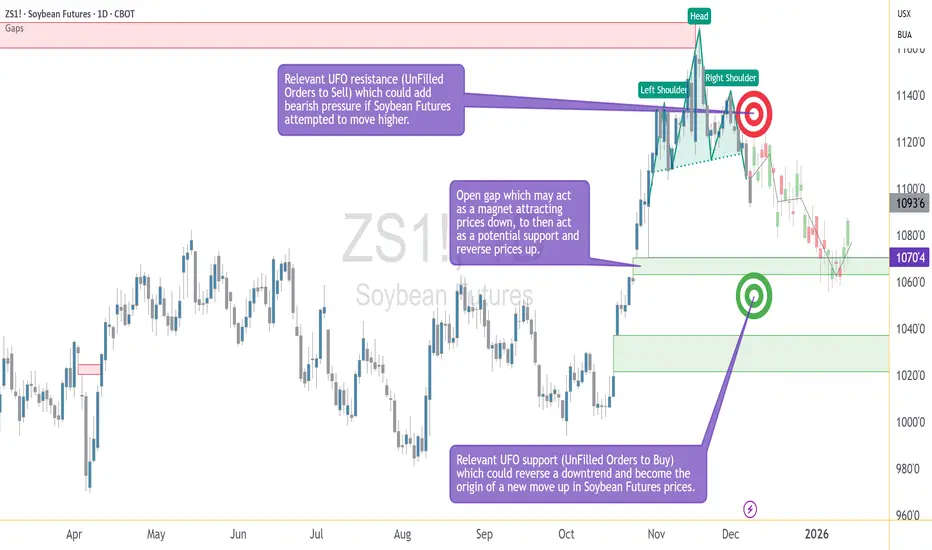
A bearish head and shoulders pattern gives traders a structured way to define entries and exits using price geometry rather than emotion. The pattern forms when a market transitions from strength to distribution, creating a left shoulder, a higher head, and then a lower right shoulder as momentum begins to fade. The neckline acts as the key support level that separates a developing pattern from a completed one.
In the case study illustrated on the chart, the daily timeframe shows a fully developed head and shoulders structure that confirmed during the December 5 trading session, when price closed below the neckline. This type of close is often interpreted by traders as evidence that bearish participation has taken control of the pattern. Whether a trader enters immediately or waits for a retest, the priority becomes identifying the levels that will structure the trade: the area of invalidation, the downside objective, and the points where risk must be controlled.
A confirmed neckline break does not imply certainty about future price direction. Instead, it provides an organized framework—a map traders can use to define where their idea is considered valid and where it is considered invalid. The educational value of this pattern lies not in its ability to predict, but in its ability to help traders pre-plan actions with clarity.
Structuring the Bearish Entry: Neckline Retests and Resistance Zones
One of the most common approaches to trading a bearish head and shoulders is to monitor for a modest bounce back toward the neckline after the breakdown. Retests do not always occur, but when they do, many traders see them as opportunities to enter with more control over the distance between entry and stop.
In this example, price sits beneath a well-defined UFO resistance area between 1123 and 1136. This band aligns with a cluster of unfilled sell orders, which may reinforce bearish pressure if price attempts to climb. More importantly, the upper boundary of the zone—1136—serves as an objective point of invalidation. If price were to move above that level, the logic of the completed bearish structure would no longer hold. Therefore, traders could use this upper boundary as a stop-loss level. It is neither arbitrary nor emotional; it is derived directly from the structure.
This type of predefined invalidation is essential because even the cleanest technical patterns can fail. The purpose of using a pattern is not to guarantee the outcome, but to know exactly when the trade thesis no longer makes sense. In this framework, the neckline provides context for the entry, while the resistance zone provides clarity for where the idea is wrong.
Defining the Target: Gap Alignment and Technical Confluence
After establishing where a trade becomes invalid, traders turn to the question of where it becomes complete. In pattern-based trading, target selection often blends classical measurement rules with the identification of technical areas where price has reason to react. In this case study, the downside objective centers on 1070'4, where two important elements align.
First, there is an open gap at this price level. Gaps frequently attract price because they represent prior imbalances in trading activity—areas where the market moved too quickly for participants to fully transact. When price revisits such a location, it becomes a zone where activity may increase. Second, the gap coincides with a region of unfilled buy orders that may serve as a UFO support area. When gaps and demand zones overlap, the confluence strengthens the rationale for using the level as a target.
Because the bearish pattern is already confirmed, traders using this structure may calculate a reward-to-risk ratio by comparing the distance from the entry zone to the stop (near 1136) and the distance from the entry zone to the target (1070'4). The role of the target is not to predict where price will go, but to anchor the trade in a predefined and measurable plan. It transforms the setup into a risk-managed scenario rather than an open-ended directional hope.
Understanding Contract Specs, Margin, and Risk Management
Traders using standardized futures contracts must structure their decisions around contract size, tick value, and margin requirements. The chart example in this idea uses the standard ZS contract, which represents 5,000 bushels. The micro contract (MZS) represents 500 bushels. This difference directly affects position sizing and the dollar impact of each tick. Because margin requirements vary over time, traders should always check the latest values before entering any position.
Tick (Minimum Price Fluctuation:
ZS: 1/4 of one cent (0.0025) per bushel = $12.50 per contract
MZS: 0.0050 per bushel = $2.50 per contract
Current Margin Requirements:
ZS: $2,000 per contract
MZS: $200 per contract
A key benefit of having two contract sizes available is flexibility. Traders seeking to maintain disciplined risk parameters often use micro contracts to fine-tune exposure, ensuring that the stop-loss level does not exceed their predefined risk tolerance. The objective of the head and shoulders pattern is not merely to identify a direction but to help traders organize their plan around risk boundaries. Knowing the contract’s characteristics enables the trader to size positions correctly.
Risk management remains the foundation of pattern-based approaches. Price can behave unpredictably, even when the chart seems decisive. This is why traders emphasize position sizing, controlled leverage, and strict adherence to the stop-loss level. The goal is not to avoid losses entirely but to keep them manageable and consistent. A well-constructed head and shoulders strategy relies not only on identifying the pattern but on respecting the risk parameters that accompany it.
Bringing It All Together: Structure, Context, and Discipline
The chart included in this idea illustrates the essential elements of the bearish head and shoulders setup: the left shoulder, head, and right shoulder; the neckline break; the gap at 1070'4; and the resistance band between 1123 and 1136. These levels form the backbone of a structured trading plan. Rather than reacting to market movement in real time, traders can use these predefined reference points to guide decision-making with consistency.
The purpose of this article is educational. It demonstrates how entries, exits, and risk parameters can be structured around a classical bearish head and shoulders pattern, how confluence strengthens downside targets, and how contract specifications help traders align position size with their risk tolerance. Above all, it shows that disciplined planning matters more than attempting to anticipate every price movement.
When charting futures, the data provided could be delayed. Traders working with the ticker symbols discussed in this idea may prefer to use CME Group real-time data plan on TradingView: www.tradingview.com - This consideration is particularly important for shorter-term traders, whereas it may be less critical for those focused on longer-term trading strategies.
General Disclaimer:
The trade ideas presented herein are solely for illustrative purposes forming a part of a case study intended to demonstrate key principles in risk management within the context of the specific market scenarios discussed. These ideas are not to be interpreted as investment recommendations or financial advice. They do not endorse or promote any specific trading strategies, financial products, or services. The information provided is based on data believed to be reliable; however, its accuracy or completeness cannot be guaranteed. Trading in financial markets involves risks, including the potential loss of principal. Each individual should conduct their own research and consult with professional financial advisors before making any investment decisions. The author or publisher of this content bears no responsibility for any actions taken based on the information provided or for any resultant financial or other losses.
The Real Reason Retail Traders LoseA clean explanation for new traders who want to stop trading noise.
Most beginners don’t fail because “trading is hard.”
They fail because they learn the wrong approach from day one.
This idea shows the exact difference between how beginners analyze charts versus how professionals read the market — using your before/after chart as the visual proof.
## 1. Beginner Charts Are Full of Noise
Look at the left chart.
This is how most beginners trade:
Dozens of trendlines
Patterns inside patterns
RSI, MACD, EMAs
Subjective S/R levels
Arrows predicting future price
No liquidity analysis
No volume logic
No defined invalidation
Beginners draw more than they analyze.
The result?
❌ Conflicting signals
❌ Emotional entries
❌ No understanding of why price should move
❌ Random predictions instead of structured planning
A chart filled with drawings creates a false feeling of analysis — but provides no edge.
## 2. Indicators Don’t Predict Price
Retail traders rely on:
RSI
MACD
Stochastics
EMA crossovers
These indicators offer comfort, but:
They lag
They contradict each other
They ignore liquidity
They cannot explain market context
Indicators summarize the past.
They do not anticipate institutional behavior.
## 3. Signal Providers Don’t Trade Their Own Signals
Most retail signal providers earn from subscriptions, not trading.
This is why:
Their entries are late
There is no SL or risk plan
They hide losses
They copy signals
They rarely show real executions
If someone cannot explain the reasoning behind a trade, they likely didn’t trade it themselves.
Follower count means nothing.
## 4. What Professionals Actually Look At
Now look at the right chart.
A professional chart is clean and focused:
VWAP (fair value)
Anchored Volume Profile
Liquidity zones
Imbalance/efficiency areas
Defined invalidation (SL)
Logical target (TP)
No noise
No predictions — just context
Professionals don’t trade drawings.
They trade volume, value, and liquidity.
Price does not move because of trendlines or patterns.
Price moves because of where liquidity sits.
## 5. Evaluate Any Trader’s Idea Before Following Them
Before trusting a trader or a signal:
Ask:
Do they use volume and liquidity?
Do they define invalidation?
Is their chart clean or full of noise?
Do they explain the trade logic?
Does the idea make sense if you remove the drawings?
You can even paste their idea into ChatGPT to test the logic.
If the idea collapses under simple questioning, it was never a valid setup.
## 6. How to Stop Losing Money
A simple framework that works:
✓ Use VWAP and Volume Profile
Understand where value and liquidity sit.
✓ Keep your chart clean
Noise = bad decisions.
✓ Define SL and TP before entry
Not after.
✓ Avoid prediction arrows
Trade reactions, not guesses.
✓ Ignore follower counts
Marketing ≠ skill.
✓ Skip any trade you don’t understand
Simplicity is strength.
## Final Message
Most beginners lose because they trade what they see on the chart.
Professionals win because they trade what moves the chart:
liquidity, volume, value, and structure.
If you stop chasing noise and start studying how price delivers liquidity, you will already be far ahead of most traders.

Understanding the XAUUSD/BCOUSD SpreadThis is my first post here on TradingView, excited to share some insights on the XAUUSD/BCOUSD spread!
The XAUUSD/BCOUSD spread compares the price of Gold (XAUUSD) to Brent Crude Oil (BCOUSD). This ratio can be a simple yet powerful indicator for understanding market sentiment and risk appetite.
When traders compare gold (a classic safe-haven asset) with oil (a growth-linked commodity), the resulting spread often reflects how the market feels about risk, uncertainty, and economic conditions.
When the spread is rising (bullish spread), it means gold is outperforming oil. This typically indicates risk-off sentiment, higher demand for protection, and weak economic optimism. In short, a rising spread reflects fear, caution, and increased risk aversion.
When the spread is falling (bearish spread), it means oil is outperforming gold. This often signals risk-on sentiment, higher economic confidence, and decreased demand for safe havens. In short, a falling spread reflects confidence, optimism, and greater risk appetite.
Why this spread matters: it blends the behavior of two key macro assets, can act as a leading indicator for risk sentiment shifts, and is useful for traders of indices, commodities, FX, or crypto who want a broader context of market psychology. Monitoring this spread can help you stay aligned with macro flows and improve trading decisions during uncertain conditions.
Disclaimer:
This post is for educational purposes only. Always do your own research before making any trading decisions.

How to Use ATR in TradingViewMaster ATR using TradingView's powerful charting tools in this step-by-step tutorial from Optimus Futures.
ATR, or Average True Range, is a volatility indicator that helps traders measure market movement, set appropriate stop losses, and adjust position sizing based on current market conditions.
What You'll Learn:
Understanding ATR as a volatility measurement tool that tracks price movement regardless of direction
How ATR calculates the average range between highs and lows over a specified period — typically 14
Why rising ATR signals increasing volatility and larger price swings
Why falling ATR indicates decreasing volatility and quieter market conditions
Using ATR to set dynamic stop losses that adjust to current volatility rather than arbitrary dollar amounts
How to calculate stop distances by multiplying ATR by factors like 2x or 3x
Applying ATR for position sizing to maintain consistent risk across different volatility environments
Setting profit targets based on ATR multiples to align with actual market movement
Filtering trade setups using ATR levels to avoid low-volatility periods or confirm breakout momentum
How to add ATR on TradingView via the Indicators menu
Understanding the default 14-period setting and how shorter or longer periods affect responsiveness
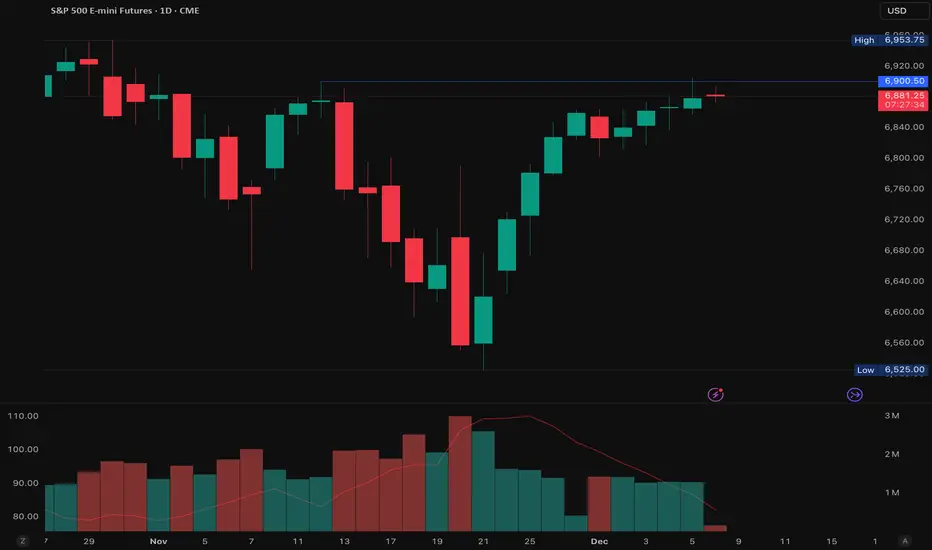
Practical examples using the E-mini S&P 500 futures chart
Applying ATR across daily, weekly, and intraday timeframes for risk management and trade planning
This tutorial is designed for futures traders, swing traders, and risk-focused analysts who want to integrate volatility-based risk management into their trading approach.
The methods discussed may help you set smarter stops, size positions appropriately, and adapt your trading strategy to changing market conditions across multiple markets and timeframes.
Learn more about futures trading with TradingView: optimusfutures.com
Disclaimer
There is a substantial risk of loss in futures trading. Past performance is not indicative of future results. Please trade only with risk capital.
We are not responsible for any third-party links, comments, or content shared on TradingView. Any opinions, links, or messages posted by users on TradingView do not represent our views or recommendations.
Please exercise your own judgment and due diligence when engaging with any external content or user commentary.
This video represents the opinion of Optimus Futures and is intended for educational purposes only. Chart interpretations are presented solely to illustrate objective technical concepts and should not be viewed as predictive of future market behavior.
In our opinion, charts are analytical tools, not forecasting instruments.

The Dynamics Behind Price action for Buy ZonesAs you become more proficient in your trading you need to add to your education and start understanding the dynamics behind price action. You need to learn more than just candlestick patterns or indicator patterns.
Asking WHO is on CONTROL of PRICE is the first step. This will tell you with a high degree of accuracy what price is most likely to do in the near term.
Don' try to "predict". In fact get rid of that term altogether in your trading as all it does is mess with your emotions and establishes the wrong mental attitude.
Professionals do not predict. Only amateurs and wanna be famous retail gurus and of course the famous financial people who want YOU to do the buying or selling in panic so they can become richer.
Instead focus on who is in control of price over the past few days to about a week for swing trading. Study the history on the daily chart also so you can understand the information the chart is revealing to you over time.
Once you understand who controls price, you can see in the past months what happened afterward. Then you can determine with a high degree of PROBABILITY a math term and used in many areas of research, the probability of the direction, gap or no gap risk, strength of the run, duration of the run, and point gain potential of swing trading that stock, as well as the risk to Profit ratio which you should always do before buying or selling short a swing style run.

why i quit forex for futures (and why you probably should too)i traded forex for about 3 years before switching to futures, and honestly i feel like an idiot for waiting so long.
CME_MINI:NQ1!
i see a lot of new guys asking "what's the difference?" so i wanted to break it down simply.
the big lie about forex is that when you trade "forex" on most retail brokers, you aren't trading the actual market. you are trading a cfd. basically, your broker is the casino. because there is no centralized exchange, the price on one broker might be different than the price on another. this means "hidden" spreads and weird slippage are rampant. you are playing in a decentralized pool where the big boys have way more info than you.
futures are cleaner because they trade on a centralized exchange like the CME. everyone sees the exact same price. everyone sees the exact same volume. there is no "broker A vs broker B" price difference.
the cost difference is huge too.
in forex, the "spread" is how the broker gets paid. it fluctuates. during news, it widens and stops you out. in futures, the spread is usually 1 or 2 tick. commissions are fixed and usually way cheaper if you are trading any decent size.
the data quality is the biggest one for me. in futures, you can see real volume data (order flow). in spot forex, "volume" is just tick volume (how many times price changed), not actual money changing hands.
it's useless for real analysis. anyway, not financial advice, just my 2 cents. if you are struggling with "stop hunts" in forex, try switching to futures. it felt like taking off training wheels for me.
anyone else make the switch recently?
CME_MINI:ES1!
Risk Management Basics 95% of Traders IgnoreWhen traders try to improve their results, they often jump straight to indicators, new setups, or refined entries.
But here’s the uncomfortable truth:
Most traders don’t fail because of their strategy — they fail because they don’t control their risk.
Let’s break down the two fundamentals that separate professionals from the 95%:
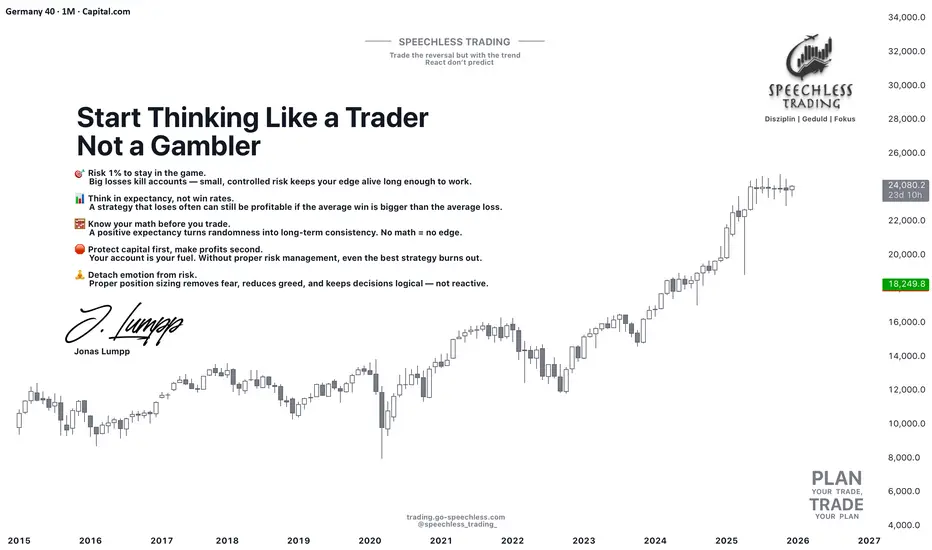
1️⃣ The 1% Rule: Your Built-In Survival System
Most beginners risk 5–20% per trade.
Professionals risk a maximum of 1%. Why?
Because the goal isn’t to win every trade — the goal is to stay in the game long enough for your edge to play out.
Risking only 1% means:
✔ A losing streak won’t destroy your account
✔ Your emotions stay stable and rational
✔ Your system has room to unfold statistically
✔ You avoid the #1 account killer: overexposure
Here’s the key mindset shift:
Risk management is not about fear — it’s about increasing your probability of long-term profitability.
2️⃣ Positive Expectancy: The Math Behind Winning Traders
Most traders judge a setup based on the last one or two trades.
Professionals evaluate it based on expectancy — the average profit per trade across a large sample.
Here’s a simple example:
Win rate: 40%
Average win: +60 pips
Average loss: –30 pips
Expectancy =
(0.4 × 60) – (0.6 × 30) = +6 pips per trade
Meaning:
You can lose more trades than you win — and still be profitable.
This is the principle beginners never understand.
A system with positive expectancy + 1% risk per trade becomes extremely powerful.
You stop caring about individual losses and start thinking in probabilities, not emotions.
The Truth Most Traders Miss
➡️ Risk management is the strategy.
➡️ Expectancy matters more than your win rate.
➡️ Risking 1% won’t make you rich fast — but it will prevent you from blowing up.
➡️ Trading becomes easier when you remove the illusion of certainty.
If traders spent more time understanding expectancy and risk instead of chasing “perfect setups,” half of their frustration would disappear overnight.
Thanks for reading — and have a disciplined start to your trading week!
If you found this post valuable, let me know in the comments.
I might create a full series on applied risk management and expectancy modeling.
Jonas Lumpp
Speechless Trading
Disclaimer: This tutorial is for educational purposes only and does not constitute financial advice. Its goal is to help traders develop a professional mindset, improve risk management, and make more structured trading decisions.
How to choose what to invest inHow to choose what to invest in: a practical checklist for traders and investors
Many beginners start with the question “What should I buy today?” and skip a more important one: “What role does this money play in my life in the next years?”
That is how portfolios turn into random collections of trades and screenshots.
This text gives you a compact filter for picking assets. Not a magic list of tickers, just a way to check whether a coin, stock or ETF really fits your time horizon, risk and skill level.
Start from your life, not from the chart
Asset selection starts before you open a chart. First, you need to see how this money fits into your real life.
Three simple points help:
When you might need this money: in a month, in a year, in five years.
How painful a 10, 30 or 50 % drawdown feels for you.
How many hours per week you truly give to the market.
Example. Money is needed in six months for a mortgage down payment. A 15 % drawdown already feels terrible. Screen time is 2 hours per week. In this case, aggressive altcoins or heavy leverage look more like a stress machine than an investment tool.
Another case. Ten-year horizon, regular contributions, stable income from a job, 30 % drawdown feels acceptable. This profile can hold more volatile assets, still with clear limits on risk.
Filter 1: you must understand the asset
First filter is simple and strict: you should be able to explain the asset to a non-trader in two sentences.
The label is less important: stock, ETF, coin or future. One thing matters: you understand where the return comes from. Growth of company profit. Coupon on a bond. Risk premium on a volatile market. Fees and staking rewards in a network.
If your explanation sounds like “price goes up, everyone buys”, this is closer to magic than to a plan. Better to drop this asset from the list and move on to something more clear.
Filter 2: risk and volatility
The market does not care about your comfort. You can care about it by choosing assets that match your stress level.
Key checks:
Average daily range relative to price. For many crypto names, a 5–10 % daily range is normal. Large caps in stock markets often move less.
Historical drawdowns during market crashes.
Sensitivity to events: earnings, regulator news, large players.
The sharper the asset, the smaller its weight in the portfolio and the more careful the position size. The same asset can be fine for an aggressive profile and a disaster for a conservative one.
Filter 3: liquidity
Liquidity stays invisible until you try to exit.
Look at three things:
Daily traded volume. For active trading, it is safer to work with assets where daily volume is many times larger than your typical position.
Spread. Wide spread eats money on both entry and exit.
Order book depth. A thin book turns a big order into a mini crash.
Filter 4: basic numbers and story
Even if you are chart-first, raw numbers still help to avoid extremes.
For stocks and ETFs, it helps to check:
Sector and business model. The company earns money on something clear, not only on a buzzword in slides.
Debt and margins. Over-leveraged businesses with thin margins suffer in stress periods.
Dividends or buybacks, if your style relies on cash coming back to shareholders.
For crypto and tokens:
Role of the token. Pure “casino chip” tokens rarely live long.
Emission and unlocks. Large unlocks often push price down.
Real network use: transactions, fees, projects building on top.
Build your personal checklist
At some point it makes sense to turn filters into a short checklist you run through before each position.
Example:
Time. I know the horizon for this asset and how it fits my overall money plan.
Risk. Risk per position is no more than X % of my capital, portfolio drawdown stays inside a level I can live with.
Understanding. I know where the return comes from and what can break the scenario.
Liquidity. Volume and spread allow me to enter and exit without huge slippage.
Exit plan. I have a level where the scenario is invalid and levels where I lock in profit, partly or fully.
Connect it with the chart
On TradingView you have both charts and basic info in one place, which makes this checklist easier to apply.
A typical flow:
Use a screener to find assets that match your profile by country, sector, market cap, volatility.
Open a higher-timeframe chart and see how the asset behaved in past crashes.
Check liquidity by volume and spread.
Only then search for an entry setup according to your system: trend, level, pullback, breakout and so on.
Before clicking the button, run through your checklist again.
Common traps when choosing assets
A few classic traps that ruin even a good money management system:
Blindly following a tip from a chat without knowing what the asset is and why you are in it.
All-in on one sector or one coin.
Heavy leverage on short horizons with low experience.
Averaging down without a written plan and clear risk limits.
Ignoring currency risk and taxes.
This text is for educational purposes only and is not investment advice. You are responsible for your own money decisions.

HOW TO WATCHLIST ADVANCED VIEW PART-2 IN TRADINGVIEW1️⃣ Open Advanced View in the Watchlist
Open Trading-View.
On the right side, open the Watchlist panel.
If it is hidden → click the small arrow on the right edge.
At the bottom of the watchlist, click the icon that switches to Advanced View
(it looks like a more detailed/grid style layout).
Your watchlist will now show a table-style advanced view with multiple columns.
2️⃣ Open the Column Selector (where all tools live)
In Advanced View, move your cursor to the top header row (where the column names are).
Look for an option like “Add Column” or a “+” (plus) icon.
Click it → a panel or list opens with different categories:
Price
Financial
Risk
Technical
(names can appear as sections or tabs in the column selector window).
All four tools you mentioned are basically column groups you can add to the advanced view.
3️⃣ How to Use the Price Tool (Price Columns)
In the column selector, click on “Price”.
You will see different price-related fields, for example:
Last Price
Open
High
Low
Close
Change
Change %
Click on the fields you want to use (for example: Last Price, Change %).
These price columns will appear in your Advanced View table.
You can now:
Sort by a price column → click on the column name (e.g., “Change %”) to sort ascending/descending.
Reorder the column → drag the header left or right.
This helps you quickly see which symbols are moving the most in terms of price.
4️⃣ How to Use the Financial Tool (Fundamental Columns)
Open the column selector again → click “Financial”.
You will see fundamental / financial fields, for example (depending on symbol type):
Market Cap
P/E Ratio
EPS
Dividend Yield
Revenue, etc.
Click on the financial fields you want to add.
These financial columns now appear in the Advanced View.
You can:
Sort by any financial column (e.g., Market Cap to find largest companies).
Reorder the columns to keep important financial data together.
This is useful when you are comparing stocks by fundamentals, not just price.
5️⃣ How to Use the Risk Tool (Risk Metrics Columns)
In the column selector, click “Risk”.
Trading-View may show risk-related metrics such as (depending on symbol and your plan):
Volatility
Beta
Average True Range (sometimes under technical/volatility)
Other risk-style metrics, if available
Select the risk fields you want to track.
These risk columns appear in your table.
Now you can:
Sort by risk column (for example, volatility) to see which symbols are more active or more stable.
Combine risk columns with price columns to filter out too volatile instruments if you want.
This helps you understand how aggressive or calm each symbol is from a risk point of view.
6️⃣ How to Use the Technical Tool (Technical Metrics Columns)
Open the column selector → click “Technical”.
You’ll see technical-related fields, for example:
RSI value
Moving Average status (like “Price above/below MA”)
Overall technical rating (e.g., “Strong Buy / Buy / Neutral / Sell”)
Other built-in technical summary metrics.
Click on the technical fields you want to add.
These technical columns appear in Advanced View.
You can:
Scan quickly which symbols have strong technical rating.
Sort by RSI or rating to find overbought/oversold or technically strong/weak symbols.
This turns your watchlist into a mini technical scanner.
7️⃣ How to Reorder, Remove, and Clean Up Columns
🔹 Reorder Columns
Click and hold any column header (Price, Financial, Risk, Technical field).
Drag it left or right.
Release to place it where you want.
🔹 Remove a Column
Hover on the column header you want to remove.
Click the three-dot menu (⋮) or right-click (depending on layout).
Select “Remove Column”.
The column disappears from Advanced View.
8️⃣ Switch Back to Normal Watchlist View
At the bottom of the watchlist, click the List View icon (or original watchlist icon).
The watchlist will return to the compact standard view.
Advanced View settings are usually remembered, so when you come back, your columns are still there.
🔁 Short Recap (Good for on-screen text)
Open Watchlist → Switch to Advanced View
Click Add Column (+) → choose from Price / Financial / Risk / Technical
Add the fields you want → Columns appear in table
Sort by clicking column names
Drag to reorder, menu to remove
Switch back using List View icon

Reading market regime: trend, range or chaos on a single chartReading market regime: trend, range or chaos on a single chart
Many traders treat every chart the same. Same setup, same stop, same expectations. Then one week the pattern works, the next week it bleeds the account.
In practice, the pattern rarely is the real problem. The problem is that the same pattern behaves differently in different market regimes.
First read the regime. Then trust the pattern.
This article focuses on a simple way to classify any chart into three regimes and adjust entries, stops and targets to match the environment.
What “market regime” really means
Forget academic definitions. For a discretionary trader, market regime is simply how price usually behaves on this chart in the recent swings.
A practical split into three buckets:
Trend: price prints higher highs and higher lows, or lower highs and lower lows. Pullbacks respect moving averages or previous structure. Breakouts tend to continue.
Range: price bounces between clear support and resistance. False breaks are frequent. Mean reversion works better than breakouts.
Chaos: candles with long wicks, overlapping bodies, fake breaks in both directions, no clear structure. Liquidity is patchy, stop hunts are common.
The goal is not perfect classification. The goal is to avoid trading a “trend playbook” in a chaotic zone and a “range playbook” in a strong trend.
Three quick checks for any chart
Before opening a trade, run three very simple checks on the last 50–100 candles.
1. Direction of swings
Mark the last 3–5 swing highs and lows with your eyes.
If highs and lows step clearly in one direction, you have a trend.
If highs and lows repeat in the same zones, you have a range.
If swings are messy and overlap, you are closer to chaos.
2. How price reacts to levels
Pick obvious zones that price touched several times.
Clean tests with clear rejection and follow through support the range idea.
Small pauses and then continuation support the trend idea.
Spikes through levels with no follow through point to chaos.
3. Noise inside candles
Look at wicks and bodies.
Moderate wicks and healthy bodies often belong to a stable trend.
Many doji-like candles and long wicks on both sides are classic noisy conditions.
After these three checks, label the chart in your journal: trend, range or chaos. Do not overthink it. One clear label is enough for each trade.
How to adapt the trade to the regime
Same signal, different execution.
Trend regime
Direction: trade only with the main direction of recent swings.
Entry: focus on pullbacks into previous structure or into dynamic zones like moving averages, not on chasing the breakout spike.
Stop: behind the last swing or behind the structure that invalidates the trend.
Target: allow more distance, at least 2R and more while the trend structure holds.
Range regime
Direction: buy near support, sell near resistance. Ignore mid-range.
Entry: wait for rejection from the edge of the range. Wick rejection or failed breakout is often better than a blind limit order.
Stop: behind the range boundary, where the range idea clearly dies.
Target: either the opposite side of the range or a “safe middle” if volatility is low.
Chaos regime
Size: cut risk per trade or stay flat.
Timeframe: either move to higher timeframe to filter noise or skip the instrument.
Goal: defense, not growth. The main job here is to avoid feeding the spread and slippage.
Use a journal to find your best regime
Add one extra column to your trading journal: “regime”. For each trade, assign one of three labels before entry.
After 30–50 trades, group the results by regime. Many traders discover that:
Trends give the main profit.
Ranges give small but stable gains.
Chaos slowly eats everything.
Once this pattern becomes visible in numbers, discipline around regimes stops being an abstract rule. It turns into a very practical filter.
Conclusion
A setup without a regime filter is half a system.
Start every analysis with a simple question to the chart: trend, range or chaos. Then apply the playbook that fits this environment, instead of forcing the same behaviour from the market every day.

How Market Drivers Influence Forex PhasesI examined the key drivers and major players in the Forex market. Price patterns are a direct reflection of human psychology responding to significant events and the subsequent flow of institutional money. Therefore, understanding what influences overall market direction is crucial.
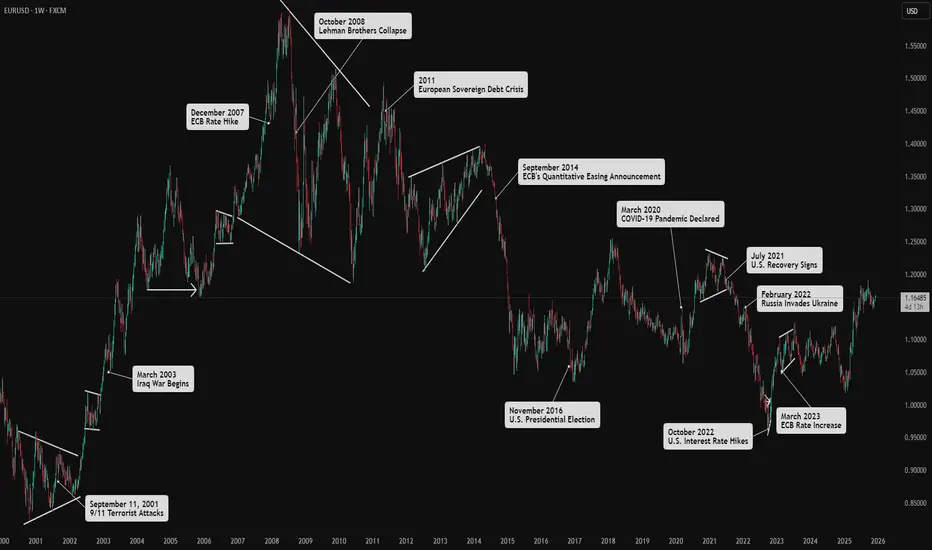
Above, you'll find a few historical events on the EUR/USD chart to analyze their effects on price movements.
Below is a brief overview of the four main drivers and the role of speculation in the Forex market.
******************
Key Triggers for Market Shifts
Market shifts in Forex are influenced by several key drivers. Grasping these drivers enables better identification of market phases and the price patterns that emerge within them.
Economic Health
Refers to consumers' financial stability and purchasing power.
A healthy consumer sector boosts economic growth and strengthens a country's currency.
Positive consumer sentiment leads to bullish currency trends, while negative sentiment results in bearish trends.
Monetary Policy
Central banks influence currency rates through interest rate policies.
Decisions regarding interest rates are high-impact news in Forex.
Central banks aim for maximum employment and inflation control, affecting currency value through their policies.
Fiscal Policy
Government expenditure on services and infrastructure impacts aggregate demand and GDP.
Increased spending can stimulate the economy, leading to currency appreciation.
However, if spending is funded by borrowing, it may lead to a higher budget deficit, causing loss of investor confidence and currency depreciation.
Political Stability
Refers to the reliability of a country's government and policies.
Stability encourages foreign investment and capital inflow, leading to currency appreciation.
Political unpredictability can deter investment and negatively impact currency value.
******************
Role of Speculation
Speculation from investors, based on perceived outcomes of these market drivers, creates volatility.
Major Market Players:
Investment Banks: The largest players in the Forex market, trading significant volumes between themselves and on behalf of clients like hedge funds and governments.
Hedge Funds: The third-largest players, trading pooled capital with long-term strategies.
Retail Traders: Although they contribute a high volume of transactions, their collective impact is smaller compared to institutional investors.
Speculation fuels volatility and price fluctuations.
Understanding these components helps identify patterns in the Forex market, leading to better trading strategies.
The IMF and Currency Stabilization in Global Trade1. The Role of the IMF in Currency Stability
The IMF was established in 1944 during the Bretton Woods Conference to oversee the international monetary system and prevent the financial instability that contributed to the Great Depression. One of its key functions is to provide a framework where exchange rates can remain relatively stable. Stable currencies are essential for smooth global trade because fluctuations in exchange rates create uncertainty in import and export prices, impacting businesses, investors, and consumers alike.
By providing economic guidance, financial resources, and policy advice, the IMF helps member countries avoid currency crises, manage their monetary policies effectively, and maintain confidence in their national currencies.
2. Mechanisms of Currency Stabilization
The IMF uses a combination of financial tools, policy advice, and monitoring to stabilize currencies globally:
a. Financial Assistance Programs:
Countries experiencing balance of payments problems or facing a currency crisis can turn to the IMF for loans. These loans are often conditional upon implementing economic reforms that strengthen fiscal discipline, control inflation, and restore investor confidence. By providing temporary financial support, the IMF helps countries prevent devaluation of their currency, stabilize the economy, and protect trade flows. For instance, during the Asian Financial Crisis in 1997-1998, IMF assistance helped countries like South Korea and Thailand stabilize their currencies and restore market confidence.
b. Exchange Rate Surveillance:
The IMF monitors exchange rate policies of its member countries and evaluates whether they are consistent with economic fundamentals. Through its "Article IV Consultations," the IMF assesses macroeconomic policies, currency stability, and external sector performance. When misalignment or excessive volatility is detected, the IMF provides policy recommendations aimed at reducing speculative attacks and maintaining exchange rate stability.
c. Special Drawing Rights (SDRs):
SDRs are international reserve assets created by the IMF to supplement member countries' official reserves. SDRs can be exchanged for freely usable currencies and serve as a buffer during crises. By increasing global liquidity, SDRs help countries maintain currency stability without resorting to abrupt devaluations that could disrupt trade.
d. Technical Assistance and Capacity Building:
Beyond financial support, the IMF provides technical assistance in areas such as monetary policy, exchange rate management, and debt sustainability. By helping countries design better fiscal and monetary frameworks, the IMF enhances the resilience of national currencies against external shocks and speculative attacks.
3. Stabilizing Global Trade Through Currency Support
Currency stability is directly linked to the health of global trade. Stable currencies reduce uncertainty in import and export pricing, lower transaction costs, and attract foreign investment. When a country’s currency is volatile, it can lead to inflation or deflation in the domestic market, making trade agreements difficult to honor. The IMF’s interventions, therefore, play a crucial role in maintaining the predictability necessary for global commerce.
For example, if a developing country faces a sudden currency depreciation, the cost of imported goods rises sharply. This can lead to inflation, reduce purchasing power, and disrupt trade agreements. By providing IMF loans and policy guidance, the country can stabilize its currency, maintain international trade flows, and avoid a domino effect on regional economies.
4. Crisis Prevention and Management
The IMF is also central in crisis prevention. By monitoring global economic trends and exchange rates, the IMF can identify vulnerabilities before they escalate into full-blown currency crises. Early intervention may include policy recommendations, reserve support, or coordinated efforts with other international institutions.
A notable example is the European debt crisis in the early 2010s. Countries like Greece, Portugal, and Ireland received IMF support to stabilize their economies and prevent currency collapses. This intervention helped prevent broader disruption in the eurozone and protected trade relationships with other countries.
5. Promoting Confidence and Investor Trust
Currency stabilization is not only about technical support but also about psychological confidence. Investors and international traders are more likely to engage with a country that demonstrates stability in its currency. The IMF’s oversight and policy interventions signal to global markets that a country is taking steps to manage its monetary system prudently. This confidence reduces speculative attacks on currencies and lowers the risk premium on trade and investment, indirectly promoting a stable environment for global commerce.
6. Challenges in Currency Stabilization
Despite its efforts, the IMF faces challenges in stabilizing currencies:
Global Economic Interconnectedness: Currency crises in one country can quickly spread due to globalized trade and finance. Stabilizing one currency might not be enough if regional contagion occurs.
Domestic Policy Resistance: IMF programs often require austerity measures, monetary tightening, or structural reforms. These policies can be politically unpopular, leading to delays or partial implementation, which may reduce effectiveness.
Speculative Pressure: Even with IMF support, currencies are subject to market speculation, which can create volatility that is difficult to manage purely through policy interventions.
7. IMF’s Evolving Role in a Modern Context
In recent years, the IMF has adapted its role to address new challenges in currency stabilization:
Global Liquidity Support: During the COVID-19 pandemic, the IMF provided unprecedented liquidity support to member countries, allowing them to stabilize their currencies and maintain trade flows.
Debt Sustainability Focus: IMF programs now increasingly consider long-term debt sustainability to prevent future currency crises that might threaten global trade.
Collaboration with Other Institutions: The IMF often works alongside the World Bank, regional development banks, and central banks to coordinate policy responses to currency instability and trade disruptions.
8. Conclusion
In the complex ecosystem of global trade, currency stability is essential. Fluctuating exchange rates can disrupt trade agreements, create inflationary pressures, and deter investment. The IMF serves as a global stabilizer by providing financial assistance, monitoring exchange rates, issuing SDRs, and advising on economic policy. Its interventions not only stabilize individual currencies but also support the broader global trade environment by promoting confidence, predictability, and sustainable economic policies.
While challenges remain, including market speculation, domestic resistance, and regional contagion, the IMF’s role in currency stabilization is critical for the health of the global economy. By continuing to evolve and coordinate with other institutions, the IMF helps ensure that currencies remain reliable mediums of trade, facilitating economic growth, investment, and prosperity worldwide.
High-Frequency Trading (HFT)1. Introduction to High-Frequency Trading
High-Frequency Trading (HFT) refers to the use of sophisticated algorithms, ultra-low latency systems, and high-speed networks to execute a large number of trades within fractions of a second. Unlike traditional trading strategies, which may focus on long-term investment decisions, HFT capitalizes on small price movements and market inefficiencies that exist for milliseconds or seconds.
HFT strategies typically involve:
Market Making: Providing liquidity by simultaneously placing buy and sell orders.
Statistical Arbitrage: Exploiting small price differences between correlated assets.
Event Arbitrage: Reacting instantly to news releases, economic data, or corporate announcements.
Latency Arbitrage: Capitalizing on delays in market data transmission between exchanges.
The success of HFT is heavily reliant on speed, technology, and market access. Firms invest millions in co-location services, fiber-optic networks, and high-performance computing systems to reduce latency and gain a competitive edge.
2. Understanding Time Zone Gaps in Global Markets
Financial markets operate in different time zones, and their trading hours rarely overlap perfectly. This staggered timing creates “time zone gaps”, periods when some markets are closed while others are open. For example:
The New York Stock Exchange (NYSE) opens at 9:30 AM EST and closes at 4:00 PM EST.
The London Stock Exchange (LSE) opens at 8:00 AM GMT and closes at 4:30 PM GMT.
The Tokyo Stock Exchange (TSE) opens at 9:00 AM JST and closes at 3:00 PM JST.
Because of these differences, there are intervals where one major market is closed while another is active. These gaps can lead to liquidity imbalances, pricing inefficiencies, and delayed reactions to global events—all of which can be exploited by HFT strategies.
3. How HFT Exploits Time Zone Gaps
HFT firms identify and exploit patterns that emerge during time zone gaps. Key strategies include:
a) Pre-Market and Post-Market Trading
Markets often react to overnight news from other regions. For instance, events in Asia can impact European markets, which in turn influence the U.S. market. HFT systems can monitor international markets and place trades in anticipation of opening price movements.
Example: If the Nikkei 225 index rises significantly overnight, HFT algorithms may anticipate a higher opening for related ETFs on the LSE. By pre-positioning orders, firms can profit from the early price adjustments.
b) Arbitrage Across Exchanges
Time zone gaps create price discrepancies between related instruments. HFT algorithms can detect these differences and execute cross-market arbitrage.
Example: Currency pairs traded in Tokyo may have different rates compared to London due to the TSE opening hours. An HFT system can instantly execute trades to exploit these differences before markets fully adjust.
c) Liquidity Gap Exploitation
During time zone gaps, liquidity may be lower in certain markets. Lower liquidity often leads to wider bid-ask spreads, which HFT traders can exploit:
By placing limit orders strategically, HFT algorithms can capture profits from small price movements that would be unnoticeable in high-liquidity periods.
HFT can act as a temporary market maker, providing liquidity while earning the spread in these gaps.
d) Reaction to Global News and Macroeconomic Data
Economic indicators, geopolitical events, and corporate announcements are often released in one time zone while other markets are asleep. HFT systems continuously monitor global news feeds, social media sentiment, and economic calendars. By analyzing this information in real time, HFT can:
Adjust positions before the market reacts fully.
Exploit mispricings caused by delayed responses in other time zones.
For instance, a surprise interest rate announcement in London can impact New York futures contracts hours later. HFT systems react within milliseconds, ahead of most human traders.
4. Technological Requirements for HFT in Time Zone Gaps
Successful exploitation of time zone gaps requires cutting-edge technology:
Low-Latency Infrastructure: Direct connections to global exchanges, often through co-location facilities.
Algorithmic Intelligence: Machine learning and statistical models to predict price movements based on historical and real-time data.
Real-Time Data Feeds: High-speed access to market data across multiple time zones.
Risk Management Systems: Automated systems to limit exposure in volatile periods.
Latency is especially critical when markets are thin or illiquid during off-peak hours. Even milliseconds can determine whether a trade is profitable.
5. Challenges and Risks
While HFT in time zone gaps can be highly profitable, it carries significant risks:
Volatility Risk: Thin markets during off-hours can experience rapid price swings. A sudden large order can move the market against an HFT position.
Technological Risk: System failures, connectivity issues, or data errors can result in substantial losses.
Regulatory Risk: Cross-border trading is subject to multiple jurisdictions, each with its own rules regarding HFT and market manipulation.
Competition: Many HFT firms target the same inefficiencies, reducing potential profits and increasing market competition.
6. Case Studies of HFT in Time Zone Gaps
a) Forex Market Example
The forex market operates 24 hours a day, spanning multiple time zones. HFT algorithms monitor correlations between currency pairs across Tokyo, London, and New York sessions.
A sudden spike in USD/JPY in Tokyo may predict movement in EUR/USD in London.
HFT systems react instantaneously, executing trades before the broader market catches up.
b) Equity Market Example
Global ETFs, ADRs (American Depository Receipts), and index futures often trade asynchronously. HFT algorithms exploit pricing differences during time zone gaps:
ADRs of Asian companies may trade in New York while the underlying shares are closed in Asia.
Price discrepancies between the ADR and the underlying stock can be arbitraged using HFT strategies.
7. The Future of HFT in Time Zone Gaps
As technology evolves, HFT will continue to focus on global market integration. Key trends include:
AI-Driven Predictive Models: Enhanced forecasting of price movements across time zones.
Cross-Asset HFT: Algorithms linking equities, commodities, and currencies to exploit inter-market inefficiencies.
Increased Regulation: Authorities are scrutinizing HFT practices, especially those exploiting off-hour volatility.
Despite these challenges, time zone gaps will remain an area of opportunity, especially for firms with superior technology, speed, and data analytics.
8. Conclusion
High-Frequency Trading in time zone gaps represents the intersection of speed, technology, and global market knowledge. By exploiting arbitrage opportunities, liquidity imbalances, and delayed market reactions across different regions, HFT firms can generate significant profits. However, this approach demands state-of-the-art infrastructure, advanced algorithms, and robust risk management systems.
As global markets become increasingly interconnected, understanding and navigating time zone gaps will be crucial for traders seeking to leverage HFT strategies. The combination of human insight, machine intelligence, and precise timing is what continues to make HFT a dominant force in modern finance.
Trading Global Assets: An Overview1. Types of Global Assets
Global assets can be broadly classified into several categories:
Equities (Stocks): International stocks allow investors to participate in the growth of companies worldwide. For example, investing in technology firms in the U.S., consumer goods companies in Europe, or emerging market businesses in Asia can provide diversified exposure to global economic trends. Stocks are typically traded on exchanges like the NYSE, NASDAQ, London Stock Exchange, or Tokyo Stock Exchange.
Bonds: Sovereign and corporate bonds issued by foreign governments or companies offer opportunities for income generation and portfolio diversification. For instance, U.S. Treasury bonds are considered safe-haven assets, whereas emerging market bonds may offer higher yields but higher risks.
Currencies (Forex): The foreign exchange market is the largest financial market in the world, with daily trading volumes exceeding $6 trillion. Investors trade currency pairs, such as EUR/USD or USD/JPY, to speculate on exchange rate movements or hedge against currency risks. Forex trading is highly liquid and operates 24 hours, providing constant opportunities for global traders.
Commodities: Gold, oil, silver, and agricultural products are traded globally through futures and spot markets. Commodities are influenced by global supply-demand dynamics, geopolitical tensions, and economic growth trends. For instance, oil prices may react to conflicts in the Middle East, while gold often acts as a safe haven during financial instability.
Derivatives: Options, futures, and swaps allow investors to speculate on the price movement of underlying global assets or hedge existing positions. For example, currency futures can protect multinational companies from adverse currency fluctuations, while equity derivatives can help traders leverage their market positions.
ETFs and Mutual Funds: Global exchange-traded funds (ETFs) and international mutual funds pool investor capital to invest in multiple international assets, providing diversification with relatively lower costs. These funds can focus on specific countries, regions, sectors, or themes, such as emerging markets, technology, or green energy.
2. Benefits of Trading Global Assets
Trading global assets offers several strategic advantages:
Diversification: Investing in multiple countries reduces reliance on a single economy or currency. For example, if the U.S. market underperforms, gains in Asia or Europe can offset losses.
Growth Opportunities: Emerging markets often experience higher growth rates compared to developed economies, offering potential for higher returns.
Hedging Against Domestic Risks: Global investments can protect portfolios from domestic inflation, interest rate changes, or political instability. For instance, holding foreign bonds or currencies may offset domestic stock market volatility.
Access to Innovative Sectors: Some sectors or companies may be dominant in specific regions, such as technology in the U.S., renewable energy in Europe, or manufacturing in China. Global trading allows investors to access these growth drivers.
3. Challenges and Risks in Global Asset Trading
While the opportunities are compelling, trading global assets carries specific risks:
Currency Risk: Investments denominated in foreign currencies are exposed to exchange rate fluctuations. A strong domestic currency can erode returns when foreign earnings are converted back.
Political and Regulatory Risks: Changes in government policies, regulations, or trade restrictions can impact asset prices. For instance, sudden capital controls in an emerging market can limit liquidity and access to investments.
Market Liquidity and Volatility: Some global markets, especially in developing countries, may have lower liquidity, leading to higher volatility and transaction costs.
Time Zone Differences: Global trading requires monitoring markets across different time zones, which can be challenging for individual traders. Major market sessions in New York, London, Tokyo, and Sydney affect liquidity and price movements.
Economic and Geopolitical Factors: Global macroeconomic events, such as interest rate changes, recessions, or conflicts, significantly influence asset prices. Commodity-dependent economies, for example, are vulnerable to fluctuations in oil or metal prices.
4. Trading Strategies for Global Assets
Investors and traders employ various strategies to navigate global markets:
Fundamental Analysis: Evaluating macroeconomic indicators, company earnings, interest rates, inflation, and geopolitical conditions helps investors identify undervalued assets and long-term growth opportunities.
Technical Analysis: Traders use price charts, trends, and technical indicators to forecast market movements. Technical analysis is particularly common in currency, commodity, and equity trading.
Arbitrage: Exploiting price differences of the same asset across multiple markets can generate risk-free or low-risk profits. For example, currency or commodity arbitrage takes advantage of exchange rate discrepancies.
Hedging: Corporations and institutional investors use derivatives like options, futures, and swaps to protect against price fluctuations, currency volatility, or interest rate changes.
Thematic and Sectoral Investing: Targeting specific global trends such as renewable energy, artificial intelligence, or emerging market consumerism allows investors to capitalize on long-term growth themes.
5. Role of Technology in Global Trading
Advancements in technology have revolutionized global asset trading:
Electronic Trading Platforms: Online brokerages and trading platforms enable retail and institutional investors to access international markets instantly.
Algorithmic Trading: Automated trading systems analyze market data and execute trades based on pre-set rules, improving efficiency and reducing emotional bias.
Mobile and Cloud Technology: Traders can monitor portfolios, execute orders, and analyze markets from anywhere in real-time.
Data Analytics and AI: Advanced analytics provide insights into market trends, risk management, and predictive modeling for better decision-making.
6. Regulatory Considerations
Trading global assets requires understanding and compliance with international laws and regulations. Each country has specific rules regarding foreign ownership, taxation, reporting, and trading practices. Regulatory bodies, such as the U.S. Securities and Exchange Commission (SEC), European Securities and Markets Authority (ESMA), and local central banks, govern trading activities to ensure transparency and investor protection. Investors must also be aware of tax implications for capital gains, dividends, and foreign income.
7. Conclusion
Trading global assets opens a world of opportunities for diversification, growth, and risk management. It allows investors to participate in the performance of companies, currencies, commodities, and financial instruments across continents. However, it requires careful consideration of risks, including currency fluctuations, geopolitical instability, regulatory differences, and market volatility. A well-structured approach—combining fundamental and technical analysis, leveraging technology, and adhering to risk management principles—can help investors navigate the complexities of global markets successfully.
In the modern financial landscape, globalization, technology, and innovative financial instruments have made global asset trading more accessible than ever. For long-term investors, it offers exposure to growth engines around the world. For traders, it provides opportunities to capitalize on short-term market inefficiencies. Understanding the dynamics of global economics, market psychology, and risk management is essential for anyone aiming to succeed in this interconnected financial ecosystem.
Gold in Global Trade: An Analysis of SafetyHistorical Stability of Gold
Historically, gold has been valued for its scarcity, durability, and universal acceptance. Unlike fiat currencies, which can be printed and devalued by governments, the supply of gold is limited. This scarcity ensures that gold retains intrinsic value, making it a reliable store of wealth. During periods of economic crisis, wars, or geopolitical instability, investors have consistently turned to gold as a safeguard against currency depreciation and inflation.
For example, during the 2008 global financial crisis, while stock markets plunged worldwide, the price of gold surged as investors sought a safe store of value. Similarly, countries with unstable economies often rely on gold reserves to stabilize their currencies and trade imbalances. This historical consistency has cemented gold’s reputation as a safe and liquid asset in global trade.
Gold as a Hedge Against Currency Fluctuations
One of the primary reasons gold is considered safe in global trade is its role as a hedge against currency fluctuations. In international trade, currency values are volatile and can be affected by inflation, monetary policy, and political instability. Gold, priced in major currencies like the US dollar, provides a buffer against these risks. When the dollar weakens, gold prices often rise, maintaining purchasing power for traders and investors.
Central banks around the world also hold substantial gold reserves as a part of their foreign exchange strategy. By diversifying their reserves between currencies and gold, they can mitigate risks associated with sudden currency devaluation. This demonstrates the critical role gold plays not only for individual investors but also in stabilizing global trade systems.
Liquidity and Global Acceptability
Another factor contributing to gold’s perceived safety is its universal acceptability and liquidity. Unlike other commodities, gold can be traded easily in almost any market globally, from New York to Dubai, Singapore, or London. This ease of transaction ensures that gold can be converted into cash quickly in times of need, which is particularly important during trade disruptions or financial crises.
Gold is also highly standardized, with global markets adhering to consistent purity standards (typically 24-karat or 99.99% pure). This standardization reduces transaction friction, making gold a reliable medium in global trade, especially in situations where other financial instruments or fiat currencies may lose value due to instability.
Risks Associated with Gold in Global Trade
Despite its historical reliability, gold is not entirely risk-free. Investors and traders should consider several factors before assuming that gold is “completely safe.”
1. Price Volatility: Although gold is less volatile than stocks or cryptocurrencies, it still experiences significant price fluctuations. Global demand, interest rates, inflation expectations, and geopolitical events can all cause sharp swings in gold prices. For example, during periods of rising interest rates, gold often underperforms because it does not generate income like bonds or equities.
2. Storage and Security Costs: Physical gold requires secure storage, insurance, and sometimes transportation logistics, which can add costs and reduce liquidity. In international trade, shipping large quantities of gold is expensive and risky, particularly in politically unstable regions.
3. Regulatory Risks: Governments may impose taxes, tariffs, or restrictions on gold trading and export, especially during periods of economic crisis. For instance, India historically imposed restrictions on gold imports to manage trade deficits, which affected international trade dynamics.
4. Opportunity Cost: Holding gold exclusively, without diversifying into other assets, carries an opportunity cost. In bullish equity markets or high-growth sectors, gold may underperform relative to other investment vehicles. Traders relying solely on gold may miss opportunities for higher returns elsewhere.
Gold in Modern Financial Systems
In today’s financial ecosystem, gold remains an essential instrument in global trade and investment, albeit with a more nuanced role. Beyond physical gold, financial derivatives such as gold futures, options, and exchange-traded funds (ETFs) have expanded its accessibility. These instruments allow investors and corporations to hedge against currency risk, inflation, and commodity price fluctuations without physically holding gold.
Gold ETFs, for example, have made gold trading more liquid and efficient, allowing smaller investors to participate in global gold markets. Central banks and large corporations also use gold swaps and forward contracts to stabilize their balance sheets and hedge risks in international trade. However, these financial instruments introduce counterparty risk, which is a new dimension compared to physical gold.
Gold and Global Trade Policy
Gold’s role in global trade is also influenced by geopolitical factors. Nations with substantial gold reserves are better positioned to weather economic sanctions, currency crises, or trade disruptions. Conversely, countries with limited access to gold may face vulnerabilities in international trade.
Additionally, the global pricing of gold is heavily influenced by the US dollar, as most gold transactions are denominated in dollars. This dependence means that shifts in US monetary policy or currency valuation can impact the global perception of gold’s safety. Thus, while gold remains a reliable hedge, its safety is not absolute; it is contingent on global economic and geopolitical dynamics.
Conclusion: Safe, But Not Risk-Free
In conclusion, gold is widely regarded as one of the safest assets in the global trade market due to its historical stability, scarcity, liquidity, and role as a hedge against currency fluctuations. It has consistently provided a buffer during financial crises, inflationary periods, and geopolitical instability. Its universal acceptability and standardization make it a reliable medium in international transactions.
However, gold is not entirely free from risks. Price volatility, storage and security costs, regulatory constraints, and opportunity costs mean that relying solely on gold is not a guaranteed safeguard. Modern financial instruments linked to gold, while increasing accessibility, also introduce new dimensions of risk.
Therefore, gold can be considered a relatively safe asset in global trade, but its safety is contextual. Investors, traders, and policymakers should treat it as a critical component of a diversified portfolio, rather than a standalone guarantee of security. In a complex and interconnected global economy, the “safest” strategy is one that balances gold with other financial instruments, currencies, and commodities to mitigate risk and maximize stability.

Technologies and Innovations in the Global Market1. Digital Transformation and Industry 4.0
One of the most significant technological trends in the global market is digital transformation, often encapsulated under the concept of Industry 4.0. This term refers to the integration of digital technologies, the Internet of Things (IoT), artificial intelligence (AI), robotics, and big data analytics into industrial processes. By connecting machines, systems, and data, businesses can optimize production, improve efficiency, and reduce costs.
In manufacturing, smart factories equipped with sensors and AI-driven analytics allow real-time monitoring of operations, predictive maintenance of machinery, and adaptive production lines. These innovations enable companies to respond rapidly to market changes, reduce waste, and customize products according to consumer preferences, a trend known as mass personalization.
2. Artificial Intelligence and Machine Learning
Artificial intelligence has become a central pillar of innovation across multiple sectors. Machine learning, natural language processing, and computer vision technologies are being deployed in industries ranging from finance and healthcare to retail and logistics.
In finance, AI algorithms assist in fraud detection, risk assessment, and automated trading. Healthcare benefits from AI-powered diagnostic tools, predictive analytics for patient care, and drug discovery processes accelerated through computational models. Retailers leverage AI for personalized marketing, demand forecasting, and inventory management. The integration of AI into daily operations has enabled companies to make data-driven decisions faster and with greater accuracy.
3. Blockchain and Decentralized Systems
Blockchain technology, initially associated with cryptocurrencies, has evolved into a transformative innovation for the global market. It provides a secure, transparent, and decentralized way to record transactions, which is particularly valuable for supply chain management, finance, and digital identity verification.
For instance, in the supply chain sector, blockchain allows stakeholders to track products from origin to consumer, ensuring authenticity and reducing the risk of counterfeiting. Financial institutions use blockchain to facilitate cross-border payments more efficiently and with lower costs, bypassing traditional intermediaries. Additionally, smart contracts — self-executing contracts on blockchain networks — are revolutionizing legal, real estate, and business agreements by automating enforcement.
4. Internet of Things (IoT) and Connectivity
The proliferation of IoT devices has connected the physical and digital worlds in unprecedented ways. Sensors embedded in everyday devices—from industrial machinery to home appliances—generate massive amounts of data that can be analyzed to optimize performance, predict failures, and enhance user experiences.
Smart cities are emerging globally, powered by IoT infrastructure that manages traffic, energy, water supply, and waste systems efficiently. In agriculture, precision farming relies on IoT devices to monitor soil health, weather conditions, and crop growth, enabling higher yields and sustainable practices. The expansion of 5G networks further accelerates IoT adoption by providing high-speed, low-latency connectivity, making real-time applications more feasible and scalable.
5. Renewable Energy and Sustainable Technologies
Innovation in renewable energy technologies has become a crucial driver of global market dynamics. Solar, wind, hydro, and bioenergy innovations are reshaping the energy sector, making it more sustainable and economically viable.
Technological advancements in solar panel efficiency, battery storage, and grid management are reducing dependency on fossil fuels. Companies are investing in green hydrogen, carbon capture, and smart energy management systems to align with environmental regulations and meet the growing demand for clean energy. Sustainable innovations not only reduce environmental impact but also create new business opportunities in carbon trading, energy-efficient construction, and electric mobility.
6. Fintech Innovations
Financial technology, or fintech, has revolutionized the global financial market by providing digital alternatives to traditional banking and financial services. Mobile banking apps, digital wallets, peer-to-peer lending platforms, and robo-advisors are making financial services more accessible, faster, and cheaper.
Blockchain and AI technologies are particularly influential in fintech, enabling secure digital payments, real-time credit scoring, and automated investment management. In emerging markets, fintech solutions are bridging the financial inclusion gap, allowing unbanked populations to participate in the economy, transfer funds, and access credit with minimal friction.
7. Biotechnology and Healthcare Innovation
The biotechnology sector is another major area of global technological innovation. Advances in genomics, bioinformatics, and molecular biology are transforming healthcare, agriculture, and environmental management.
In medicine, breakthroughs in gene editing technologies like CRISPR have opened doors for treating genetic disorders. Personalized medicine, driven by genomics and AI, enables treatments tailored to individual patient profiles, improving outcomes and reducing side effects. Additionally, innovations in telemedicine, wearable health devices, and remote monitoring are redefining patient care, especially in areas with limited access to healthcare infrastructure.
8. E-commerce and Digital Platforms
The growth of e-commerce platforms has reshaped global trade and consumer behavior. Innovations in digital payment systems, logistics optimization, and AI-powered recommendation engines have made online shopping seamless, personalized, and efficient.
Global giants in e-commerce and emerging platforms in regional markets have expanded reach, enabling small and medium enterprises to access international markets with minimal upfront costs. The rise of omnichannel strategies, integrating online and offline sales experiences, further reflects the transformative impact of technology on retail and consumer engagement.
9. Autonomous Systems and Robotics
Autonomous systems, including drones, self-driving vehicles, and industrial robots, are driving efficiency and innovation in logistics, transportation, and manufacturing. Drones are used for surveillance, delivery services, and agricultural monitoring. Autonomous vehicles promise safer and more efficient transportation networks, while collaborative robots (cobots) work alongside humans in factories to improve productivity.
These technologies reduce labor-intensive tasks, minimize errors, and enhance operational scalability, enabling businesses to respond faster to market demand while reducing costs.
10. Future Outlook and Challenges
While technological innovation propels the global market forward, it also brings challenges such as cybersecurity risks, data privacy concerns, and workforce displacement due to automation. Governments, businesses, and educational institutions are increasingly focused on developing regulatory frameworks, reskilling programs, and ethical guidelines to ensure technology benefits society broadly.
Looking ahead, emerging technologies like quantum computing, extended reality (XR), and synthetic biology hold the potential to further disrupt global markets. Companies that invest in innovation, adapt rapidly, and embrace digital ecosystems are likely to gain competitive advantage, while traditional players face pressure to evolve or risk obsolescence.
Conclusion
Technologies and innovations have become the engines driving growth, efficiency, and competitiveness in the global market. From AI and IoT to renewable energy and biotech, the integration of advanced technologies across industries is creating new business models, enhancing productivity, and transforming consumer experiences. However, the pace of innovation also demands careful consideration of ethical, social, and economic implications. In the coming decades, the ability of nations and businesses to harness these innovations responsibly will define their position and success in the global economic landscape.
Global Trade and Its Impact: A Comprehensive AnalysisEconomic Impacts of Global Trade
At the core, global trade acts as a catalyst for economic growth. By allowing countries to specialize in the production of goods and services where they have a comparative advantage, trade promotes efficiency and productivity. For instance, countries with abundant natural resources can focus on extraction and export, while those with advanced manufacturing capabilities concentrate on producing high-value goods. This specialization leads to lower production costs, greater product variety, and higher overall economic output.
Trade also contributes to economic diversification. For developing countries, exporting a range of goods reduces reliance on a single sector and mitigates economic risks associated with commodity price fluctuations. For developed economies, imports provide access to raw materials, advanced technologies, and cheaper consumer goods, enhancing competitiveness. Moreover, global trade stimulates foreign direct investment (FDI), as companies establish operations abroad to access new markets, which, in turn, creates jobs and fosters economic development.
However, the economic impact of trade is not uniformly positive. While aggregate national income may rise, certain sectors and communities may face disruptions. Industries unable to compete with imported goods may decline, leading to unemployment and regional economic disparities. Additionally, excessive dependence on global markets can expose countries to external shocks, such as global recessions or supply chain disruptions, as witnessed during the COVID-19 pandemic.
Social and Labor Impacts
Global trade significantly influences labor markets and societal structures. By opening new markets and stimulating economic growth, trade creates employment opportunities across sectors. Export-oriented industries often provide higher wages and skill development opportunities. International companies operating in multiple countries also contribute to knowledge transfer, training local workforces, and raising labor standards.
On the other hand, trade can exacerbate social inequalities. Workers in industries exposed to international competition may face wage stagnation or job losses. The shift of manufacturing to countries with lower labor costs, often called “offshoring,” has led to declining industrial employment in certain developed economies, causing social and political tensions. In developing nations, while trade can lift millions out of poverty, it may also lead to exploitative labor practices if regulatory frameworks are weak.
Global trade also fosters cultural exchange. Exposure to foreign goods, services, and media enables the spread of ideas, lifestyles, and technologies, influencing societal values and consumption patterns. While this cultural interconnection promotes understanding and innovation, it may also challenge local traditions and cultural identities, leading to debates over cultural homogenization.
Technological and Innovation Impacts
One of the less immediately visible but highly transformative impacts of global trade is technological advancement. Trade encourages competition, compelling firms to innovate to maintain market share. Access to international markets allows companies to scale up production, invest in research and development, and adopt best practices from other countries. Technology transfer often accompanies trade, as multinational corporations introduce advanced processes, machinery, and management practices to host countries.
For example, the proliferation of information and communication technologies (ICT) in developing countries has been facilitated by global trade, enabling digital services, e-commerce, and global connectivity. Furthermore, trade in high-tech goods, such as semiconductors, medical equipment, and renewable energy technology, accelerates the diffusion of innovation globally, contributing to economic development and environmental sustainability.
Environmental Impacts
While global trade boosts economic growth, it also has environmental consequences. Increased production and transportation of goods contribute to carbon emissions, resource depletion, and ecological degradation. The demand for agricultural products, minerals, and manufactured goods often leads to deforestation, overfishing, and industrial pollution. Moreover, the carbon footprint associated with global supply chains has become a pressing concern, prompting discussions on “green trade” and sustainable practices.
On the positive side, trade can facilitate the dissemination of environmentally friendly technologies. Countries can import renewable energy equipment, pollution-control technologies, and sustainable agricultural practices, helping to mitigate environmental challenges. International agreements and trade policies increasingly incorporate environmental standards, promoting responsible trade practices that balance economic growth with ecological preservation.
Geopolitical and Strategic Impacts
Global trade is closely linked to geopolitics. Countries that dominate trade in critical goods, such as energy, rare minerals, and advanced technology, wield significant strategic influence. Trade relationships can foster diplomatic cooperation, strengthen alliances, and reduce the likelihood of conflict by creating mutual economic dependencies. Conversely, trade disputes, tariffs, and sanctions can become tools of geopolitical leverage, shaping international relations.
Trade also contributes to regional integration. Organizations like the European Union, ASEAN, and NAFTA (now USMCA) exemplify how trade can promote regional stability, harmonize regulations, and create large economic blocs capable of influencing global markets. However, overreliance on a few trading partners can increase vulnerability to political and economic pressures, highlighting the need for diversified trade strategies.
Globalization, Inequality, and Policy Challenges
Global trade is a driving force behind globalization, connecting economies, societies, and cultures. It has lifted millions out of poverty, expanded consumer choice, and spurred innovation. However, it has also intensified inequality, both within and between nations. Wealthier countries and multinational corporations often capture the lion’s share of trade benefits, while poorer nations may struggle to move up the value chain.
Policymakers face the challenge of maximizing trade benefits while mitigating negative impacts. Trade agreements, tariffs, and subsidies must be designed to protect vulnerable industries and labor forces. Social safety nets, skills training, and investment in infrastructure are essential to ensure that trade-driven growth is inclusive. Furthermore, international cooperation is critical to addressing environmental impacts, labor standards, and fair competition.
Conclusion
In summary, global trade is a double-edged sword with profound and multifaceted impacts. Economically, it promotes growth, efficiency, and diversification, but can disrupt local industries. Socially, it generates jobs and facilitates cultural exchange, yet can exacerbate inequality. Technologically, trade drives innovation and knowledge transfer, while environmentally, it poses both challenges and opportunities. Geopolitically, trade shapes alliances, strategic dependencies, and regional integration.
The ultimate impact of global trade depends on the policies, governance, and strategies implemented by nations. When managed effectively, trade can be a powerful engine for sustainable development, economic prosperity, and international cooperation. Conversely, neglecting its social, environmental, and political dimensions can exacerbate inequality, environmental degradation, and geopolitical tensions. As the world continues to navigate the complexities of globalization, understanding and leveraging the impact of global trade remains essential for shaping a more equitable and prosperous future.
Global Currency StabilityUnderstanding Its Dynamics, Drivers, and Implications
Currency stability is a cornerstone of global economic health. When currencies maintain predictable value relative to one another, international trade, investment, and economic planning become more efficient and less risky. Conversely, volatile or unstable currencies can disrupt markets, reduce investor confidence, and strain national economies. Global currency stability refers to the overall steadiness of major currencies across countries and regions, which plays a vital role in maintaining economic growth, promoting trade, and fostering international financial confidence.
1. The Concept of Currency Stability
Currency stability is often defined by the minimal fluctuations in a currency’s exchange rate over time. A stable currency has predictable purchasing power both domestically and internationally. This stability allows businesses and governments to make long-term financial decisions with greater confidence. Central to the concept is exchange rate stability, which indicates the relative value of one currency compared to others. Stability reduces uncertainty in international transactions, investment flows, and cross-border trade contracts.
Currencies can be stable in nominal terms, meaning their exchange rate relative to another currency does not fluctuate excessively, or in real terms, which takes into account domestic inflation rates. Both forms of stability are crucial, as a nominally stable currency experiencing high domestic inflation may still lose purchasing power and create economic uncertainty.
2. Factors Influencing Global Currency Stability
Currency stability is determined by a combination of domestic and international economic factors. Some of the primary drivers include:
a. Monetary Policy: Central banks play a key role in maintaining currency stability through interest rate adjustments, open market operations, and foreign exchange interventions. A credible and transparent monetary policy can stabilize a currency by controlling inflation, supporting investor confidence, and ensuring liquidity in financial markets. For instance, the Federal Reserve in the United States or the European Central Bank employs policy tools to manage the value of their currencies, indirectly impacting global stability.
b. Fiscal Policy and Government Debt: Governments influence currency stability through their spending and borrowing patterns. Excessive public debt or budget deficits can weaken confidence in a currency, leading to depreciation and volatility. Conversely, responsible fiscal management enhances credibility, attracting foreign investment and supporting stable currency conditions.
c. Trade Balances: Countries with consistent trade surpluses often experience currency appreciation, while persistent trade deficits may lead to depreciation. A balanced trade scenario contributes to predictable currency values and reduces the risk of sudden shifts caused by external imbalances.
d. Capital Flows: Cross-border investment flows, including foreign direct investment and portfolio investment, directly affect currency demand and supply. Sudden inflows can strengthen a currency, while abrupt outflows can trigger instability. Countries with robust capital markets and regulatory frameworks can better manage these fluctuations, contributing to global stability.
e. Political Stability and Governance: Political uncertainty, policy changes, or geopolitical risks can undermine confidence in a currency. Stable governments with transparent institutions are more likely to maintain consistent economic policies, supporting predictable currency values.
f. Global Economic Conditions: Events such as global recessions, commodity price shocks, and financial crises influence currency stability. For example, a decline in oil prices may weaken oil-exporting countries’ currencies, impacting broader trade and investment networks.
3. The Role of Major Currencies in Global Stability
Certain currencies, often referred to as reserve currencies, play a disproportionate role in global stability. The US Dollar (USD), Euro (EUR), Japanese Yen (JPY), and recently, the Chinese Yuan (CNY), are central to international trade, finance, and reserves. These currencies are widely used for cross-border transactions, denominating global commodities, and holding central bank reserves.
The stability of these major currencies directly affects global markets. A stable US Dollar, for instance, reduces transaction risk for international traders and investors. Conversely, volatility in these currencies can trigger ripple effects, affecting emerging markets, global trade pricing, and international debt servicing.
4. Mechanisms for Maintaining Currency Stability
Countries and international institutions employ multiple strategies to maintain currency stability:
a. Fixed and Managed Exchange Rate Systems: Some nations peg their currencies to a stable foreign currency, like the USD or EUR. Pegging provides predictability, reduces speculative volatility, and can anchor inflation expectations. Managed exchange rates allow limited flexibility while preventing extreme fluctuations.
b. Foreign Exchange Reserves: Central banks maintain reserves of foreign currencies to intervene in currency markets when excessive volatility occurs. By buying or selling their own currency or foreign currency, central banks can stabilize exchange rates temporarily or support longer-term credibility.
c. International Coordination: Organizations such as the International Monetary Fund (IMF) provide frameworks for stabilizing currencies through lending, policy advice, and financial monitoring. During crises, coordinated actions by multiple countries can prevent global contagion and stabilize volatile currency markets.
d. Monetary Policy Transparency and Credibility: Consistent communication and clear policy objectives reduce market uncertainty. Investors and traders can anticipate central bank actions, decreasing speculative attacks that could destabilize currencies.
5. Implications of Currency Instability
Unstable currencies have broad economic consequences:
Inflation and Purchasing Power Erosion: Rapid depreciation can increase import prices, fueling domestic inflation and reducing living standards.
Investment Hesitancy: Investors prefer predictable returns. Currency volatility can deter both domestic and foreign investment, slowing economic growth.
Trade Disruption: Unpredictable exchange rates complicate pricing, contract negotiation, and profit planning for exporters and importers.
Debt Servicing Risks: Countries with foreign-denominated debt face higher repayment costs if their currency weakens, potentially triggering defaults or fiscal crises.
6. The Interconnected Nature of Global Currency Stability
In today’s globalized economy, currency stability is not just a national concern but an international one. Global trade, financial markets, and capital flows are deeply interconnected. Instability in a major currency, such as the USD or Euro, can transmit shocks across multiple countries, especially emerging markets with weaker financial systems. Conversely, stable currency regimes promote confidence, facilitate trade, and support sustainable growth worldwide.
7. Challenges to Global Currency Stability
Despite mechanisms to maintain stability, several challenges persist:
Geopolitical Tensions: Conflicts, sanctions, and political instability can disrupt currency markets.
Speculative Attacks: Currency traders sometimes engage in large-scale speculation, causing sudden and severe exchange rate movements.
Emerging Market Vulnerabilities: Less developed financial systems may struggle to manage sudden capital flow reversals or external shocks.
Global Economic Shocks: Events like pandemics, financial crises, or commodity price collapses can trigger synchronized instability across multiple currencies.
8. Conclusion
Global currency stability is a fundamental pillar of international economic health. It ensures predictability in trade, investment, and financial planning, reducing systemic risk and fostering economic growth. Achieving stability requires coordinated monetary and fiscal policies, strong institutional frameworks, and proactive management of trade and capital flows. While challenges such as geopolitical uncertainty and market speculation persist, transparent and credible governance, combined with global cooperation, can support resilient currency systems. Stable currencies not only benefit individual nations but also underpin the smooth functioning of the global economy, enabling sustainable development and prosperity worldwide.

Global IPO Trends and SME Listings1. Evolution of Global IPO Markets
Historically, IPO markets have experienced cyclical trends influenced by macroeconomic conditions, investor confidence, interest rates, and geopolitical developments. In periods of economic expansion, companies are more likely to go public to leverage favorable valuations, while in downturns, IPO activity often slows. For example, the 1990s witnessed a surge in technology IPOs during the dot-com boom, whereas the global financial crisis of 2008 led to a significant contraction in IPO activity.
In the last decade, the IPO landscape has been shaped by several key factors:
Technology and innovation-driven IPOs: Tech giants such as Facebook, Alibaba, and Spotify have demonstrated that high-growth companies can attract massive investor interest, even without immediate profitability. Tech IPOs continue to dominate global IPO volumes.
Emerging markets participation: Countries like China, India, and Brazil have increasingly contributed to global IPO activity. China, for instance, has leveraged domestic exchanges such as Shanghai and Shenzhen to attract high-growth tech and manufacturing firms.
Special Purpose Acquisition Companies (SPACs): Particularly in the United States, SPACs emerged as an alternative to traditional IPOs, offering a faster route to public markets. SPACs peaked in popularity around 2020-2021, though the market has since matured and stabilized.
Sectoral shifts: Traditional sectors such as banking, infrastructure, and consumer goods continue to pursue IPOs, but newer sectors like clean energy, fintech, e-commerce, and biotech have increasingly dominated listings due to investor enthusiasm for innovation and sustainability.
2. Regional Trends in IPO Markets
Different regions have exhibited distinct IPO trends influenced by regulatory environments, capital availability, and investor appetite:
North America: The U.S. IPO market remains the largest globally, supported by deep capital markets, sophisticated investor base, and robust regulatory frameworks. IPOs here tend to attract large valuations and often set benchmarks for global investor sentiment.
Europe: European IPO activity has historically been slower, influenced by more stringent regulations, fragmented markets, and less aggressive investor risk appetite. However, London, Frankfurt, and Amsterdam continue to host significant listings, particularly in fintech and renewable energy.
Asia-Pacific: Emerging economies in Asia have experienced rapid IPO growth. China’s domestic exchanges have become major IPO hubs, while India has seen a surge in both mainboard and SME IPOs. Regulatory reforms, ease of listing, and government support have been critical in this growth.
Middle East and Africa: IPO markets are smaller but growing, with governments increasingly encouraging privatization and public listings as a source of funding. The UAE, Saudi Arabia, and Nigeria are key markets in this region.
3. Drivers of IPO Activity
Several factors drive IPO activity globally:
Capital Requirements: Companies use IPOs to raise funds for expansion, debt repayment, acquisitions, or R&D investments.
Market Valuations: Bull markets with high investor confidence encourage companies to go public to maximize valuations.
Regulatory Support: Simplified listing processes, tax incentives, and supportive policies can stimulate IPO activity.
Investor Appetite: Retail and institutional investors seeking high-growth opportunities influence IPO success. Trends such as ESG (Environmental, Social, and Governance) investing have also affected the types of companies going public.
4. SME Listings: Importance and Trends
Small and Medium Enterprises (SMEs) are a crucial component of global economies, contributing to employment, innovation, and regional development. SME listings refer to the practice of enabling smaller companies to raise capital on stock exchanges through dedicated platforms or mainboards with tailored regulations. Unlike traditional IPOs of large corporations, SME listings often involve lower compliance requirements, smaller funding amounts, and targeted investor bases.
Significance of SME Listings:
Access to Capital: SMEs often struggle to access large-scale institutional funding. Public listings allow them to raise equity capital for growth and expansion.
Enhanced Visibility and Credibility: Being listed provides SMEs with public recognition, which can attract customers, partners, and investors.
Governance and Transparency: Listing requirements instill higher levels of corporate governance, reporting, and transparency, which can improve operational efficiency and investor confidence.
Global SME Listing Trends:
India: India’s SME Exchange platform, such as the BSE SME and NSE EMERGE, has facilitated hundreds of SME listings, helping small companies access public markets with relatively lower listing costs. The Indian government has also encouraged SME participation through policy support.
China: China’s ChiNext and STAR Market cater to high-growth SMEs, particularly in technology and innovation sectors. These platforms have been instrumental in supporting domestic entrepreneurship.
Europe: Several European countries provide SME-specific segments on stock exchanges. For example, AIM in London is a specialized market for smaller companies seeking growth capital.
Other Regions: Emerging markets such as Brazil and Malaysia have also developed SME listing platforms to promote economic growth and entrepreneurship.
5. Challenges in Global IPOs and SME Listings
While IPOs and SME listings present opportunities, they come with significant challenges:
Market Volatility: IPOs are sensitive to macroeconomic conditions, interest rates, and geopolitical risks. Market downturns can result in delayed or underperforming IPOs.
Regulatory Compliance: High compliance costs and complex regulatory requirements can discourage SMEs from going public.
Valuation Pressure: Overvaluation or undervaluation can impact investor perception and post-listing performance.
Liquidity Constraints: SME stocks often face lower trading volumes, which can limit investor participation and affect market perception.
Investor Education: In emerging markets, lack of investor awareness about SMEs can limit participation, impacting the success of public listings.
6. Future Outlook
The global IPO and SME listing markets are poised for continued evolution. Key trends likely to shape the future include:
Digitalization of IPO Processes: Online platforms, automated regulatory filings, and virtual roadshows are making IPOs more accessible.
Sustainable and ESG-Focused Listings: Companies with clear ESG strategies are attracting premium valuations, suggesting that sustainability will play a critical role in future IPOs.
Emerging Market Growth: Countries with expanding middle classes and technology-driven growth are likely to witness increased SME listings and IPO activity.
Innovative Financing Mechanisms: Hybrid models, such as SPACs, crowdfunding, and direct listings, will continue to complement traditional IPO routes.
Cross-Border Listings: Companies may increasingly explore dual or international listings to access global capital and diversify investor bases.
7. Conclusion
Global IPO trends reflect a dynamic interplay of economic conditions, sectoral innovation, and regulatory frameworks. While large-cap IPOs dominate headlines, SME listings have emerged as an equally vital avenue for economic growth, entrepreneurship, and capital formation. The global trend indicates a growing recognition of SMEs’ importance in fostering innovation and employment, with countries developing specialized platforms to facilitate their listing. Despite challenges like volatility, compliance costs, and liquidity issues, the outlook for IPOs and SME listings remains positive, driven by technological advancements, investor enthusiasm, and supportive policy frameworks. The continued evolution of global IPO markets and SME listing platforms will play a pivotal role in shaping the economic and financial landscape of the coming decades.

Elliott Wave or NEoWave? Which on is better?A common question people often ask is: Should I learn Elliott Wave or NEoWave? Which one is better? And do I need to study Elliott Wave first before moving on to NEoWave?
Let’s break it down.
The classic Elliott Wave theory originates from the book Elliott Wave Principle, written and compiled by Robert Prechter and A.J. Frost.
Both authors were not the original creators of the theory .. they simply collected and organized the works of Ralph Nelson Elliott, whose ideas were scattered across various sources, and compiled them into a single book.
Given the context of that era .. the trading environment, technology, and available tools .. it’s fair to say R.N. Elliott developed the theory to a level that was almost complete for his time.
Back then, there were no PCs, no laptops, no internet… and charts had to be drawn by hand.
In that sense, Elliott was genuinely a genius.
But despite its impact and popularity, the classical version still contains many weaknesses.
And someone eventually stepped in to identify those flaws .. a passionate young man named Glenn Neely, who dedicated himself to studying wave theory seriously and wanted to eliminate the criticism that Elliott Wave was nothing more than “a subjective theory that doesn’t work in real trading.”
Because he was born in an era where computers were emerging and technology was accelerating, he had the thought of applying science and mathematics to make wave analysis more accurate and repeatable.
After more than seven years of work, Neely published an extremely complex .. and extremely difficult .. book: Mastering Elliott Wave.
This book essentially became the foundation of early NEoWave, because nearly all of the first-generation NEoWave concepts were packed inside it.
So… which one is better?
The answer, without hesitation: Mastering Elliott Wave wins by a landslide.
Yes, it’s difficult.
But that difficulty comes with benefits:
– Higher accuracy
– Clearer structure
– Much stronger logic
These are things classical Elliott Wave simply cannot do.
The blue book (Elliott Wave Principle) lacks something crucial that the red book (MEW) provides:
a practical and functional Degree system.
(The truth is, even MEW’s Degree system isn’t perfect .. which is why I eventually built my own system on top of it.)
Neely also introduced time and price principles to calculate Degrees .. determining which waves are major, which are minor, etc.
This method does not exist in the classical version at all, which only provides extremely abstract degree labels.
So, do you need to learn Elliott Wave first before studying NEoWave?
Let me give you a simple analogy.
Elliott Wave = manual transmission car
NEoWave = automatic transmission car
The question is:
“If you buy an automatic car, do you need to learn manual first?”
The answer: Absolutely not.
Even though NEoWave originated from Elliott Wave, the internal logic has diverged significantly.
(And in today’s world, NEoWave has already moved far past the classical version.)
In fact, I personally believe you shouldn’t study both at the same time .. especially if you’re a beginner .. because the rules of the two systemas will conflict with ech other and waste your time.
For example, some patterns that classical Elliott Wave strictly prohibits, NEoWave has tested and proven to be possible.
In summary:
NEoWave takes the material from classical Elliott Wave and develops it into a far more precise, detailed system.
But even NEoWave still has flaws that make real-world trading difficult .. which is exactly why I’m working on improving and modernizing it.
At the end of the day, no theory lasts forever, because markets are driven by humans.
The psychology of today’s generation isn’t the psychology of people 100 years ago.
And modern markets influenced by AI-driven trading are not the same as Elliott’s era or Neely’s era.
This is why we need new-generation theories built for new-generation data.
- written by me(brainiak/ew-lab) thanks for reading!
