The market isn’t random. It’s driven by algorithms.The market is not arbitrary. It is powered by algorithms that essentially accomplish just two tasks:
either push the price in the direction of the next liquidity pool or pull it back to fill the orders they missed en route, such as leftover blocks, imbalances, and unfulfilled orders.
Understanding that basic behavior is the foundation of everything I trade.
Since it indicates where the algorithm is attempting to go next, I begin with the higher-timeframe trend.
Then, in order to determine which side is in control, I wait for a powerful push, a distinct, quick displacement.
The algorithm nearly always retraces slowly after that push because it must return to correct imbalances and complete the orders it overlooked.
Additionally, that gradual decline indicates that the trend is still going strong.
A quick or forceful pullback indicates that the algorithm is probably changing course because it is creating new imbalances rather than going back to correct the previous ones.
I therefore only accept trades when the price gradually returns to my order blocks, imbalances, or prior liquidity areas before moving on to the next pool of liquidity.
I don't forecast highs or lows.
I do not oppose the market.
All I'm doing is following the algorithm as it shifts from one liquidity pool to the next, making any necessary corrections before moving on.
Smartmoneyconcepts
The Market Doesn’t Hate You — It’s Just Doing Its JobEvery trader at some point feels attacked by the market.
You take a trade, it hits your stop loss by one pip… and then runs perfectly in your direction.
You think, “The market is against me.”
But the truth is — the market doesn’t hate you.
It’s simply doing its job: collecting liquidity before moving to its real destination.
💡 Here’s What’s Really Happening
The market is a liquidity machine.
It moves where money is resting — not where traders wish it would go.
When you see price sweeping highs or lows before reversing, that’s not manipulation against you —
it’s Smart Money doing what it’s built to do:
Hunt liquidity
Fill institutional orders
Create displacement before the next move
Your stop loss isn’t being targeted personally —
it’s sitting where millions of other traders’ stops are clustered.
The market simply clears those levels before delivering the real move.
🧠 The Lesson
Stop trading emotionally and start thinking structurally.
Ask yourself before every setup:
Where is liquidity resting?
Has the market collected it yet?
Is structure confirming the new direction?
When you learn to think like Smart Money, you stop blaming the market and start understanding it.
You’ll realize every loss was a lesson pointing you toward better timing, discipline, and patience.
📊 Final Thought
The market is not your enemy — it’s your teacher.
Once you align with how liquidity and structure truly work,
you’ll stop feeling trapped and start trading with clarity and confidence.
💬 Follow for more institutional-based educational posts.
No signals. No hype.
Just pure trading knowledge and Smart Money insights that help you grow.

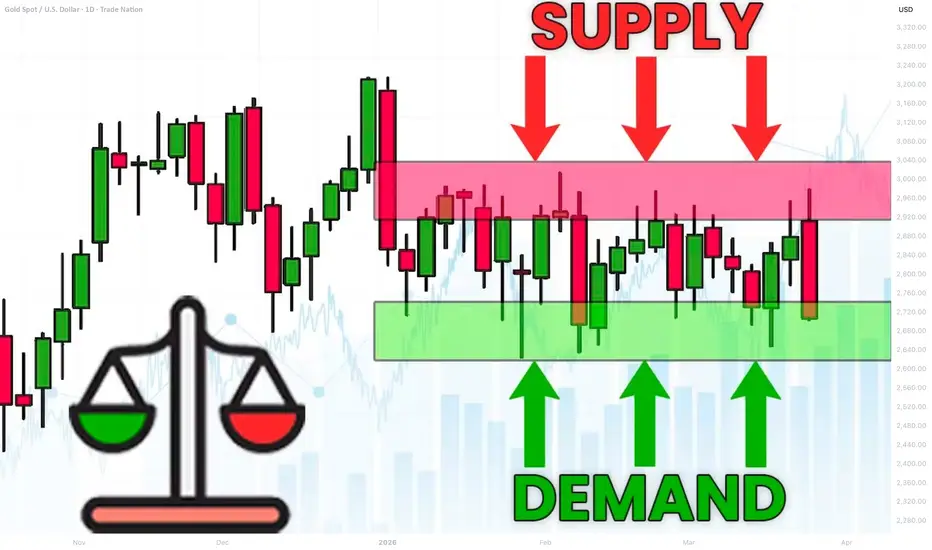
What is Equilibrium in SMC. Balance and Imbalance in Forex Gold
Equilibrium is one of the core elements for understanding market liquidity.
In this article, we will go through the essential basics of liquidity in Forex trading with Smart Money Concepts SMC.
You will learn the interconnections between supply and demand and I will explain how to easily identify balance and imbalance on any market.
Let's start our discussion with understanding how forex pairs move.
The price of an asset goes up if the market demand is stronger than the market supply. The excess of buying activity make the markets update the highs. In smart money concepts, such an event will also be called a buying imbalance.
Look at a strong bullish rally on Gold.
The price is going up because of a buying imbalance.
A strong buying activity creates a massive amount of buyers with unfilled orders.
To entice sellers to start selling, they must offer a higher-better price.
At the same time, if the price of an asset goes down , it means that the market supply is stronger than a demand. The excess of supply will make the markets update the lows. In smc, it will be called a selling imbalance.
That is exactly what is happening with GBPUSD forex pair.
A strong selling activity and the shortage of demand makes the price go down.
The excess of supply or demand on the market can not be eternal.
The lower the price becomes, the more buyers will start buying, and the more sellers will start closing their positions.
At some moment, the surplus of supply will be absorbed by the buyers.
That will be a moment when the market will find equilibrium , the balance between supply and demand.
A strong bearish imbalance on USDJPY made the price drop significantly.
The falling price made 3 things:
It attracted more buyers, because the lower the price the more profitable is buying USDJPY.
It discouraged some buyers from buying, considering that the price is already "too low".
It encouraged some buyers to close their positions in profit.
Because of that, USDJPY stopped falling and found a balance in supply and demand. That is what we call Equilibrium .
In a bull run, the higher the price will go, the more sellers will start selling.
At some moment, buying imbalance will be absorbed by the bears and supply & demand will eventually balance.
Such an event will be called the equilibrium .
EURGBP was rallying strongly.
The higher the price went, the more sellers started to sell, considering selling the pair more and more profitable.
And the same time, fewer buyers were buying and the more started to close their buy positions in profits.
At some moment, the entire excess of the market demand was absorbed by a supply. The market stopped growing and equilibrium was found.
One of the main characteristics of a market equilibrium is sideways price movement and a termination of a formation of new highs or new lows.
Usually, such a sideways price action will form a horizontal range.
That's a real example how a CAD JPY pair found an equilibrium after an extended bearish movement. A formation of a horizontal range confirmed a balance between a supply and a demand.
Please, note that these ranges will form on any time frame that you analyse.
The rule is that the higher is the time frame of the range, the stronger is the market equilibrium.
Above, I have 3 different charts:
USDJPY on a daily time frame, EURJPY on a 4H and GBPUSD on 15 minutes.
All the pairs found an equilibrium in horizontal ranges.
An equilibrium on USDJPY will signify intra week or even intra month balance,
while on EURJPY it will mean intraday/intra week balance.
On GBPUSD, it will signify intraday equilibrium.
Market equilibrium can not last forever.
Fundamentals news and changing market conditions, make the market participants constantly reassess a fair value of an asset.
A violation of the range and a breakout of one of its boundaries will be a trigger of an occurrence of an imbalance .
A bullish violation of the upper boundary of the range will signify a buying imbalance and a highly probable rise to the new highs.
While a bearish violation of the lower boundary of the range will mean a selling imbalance and a highly probable fall to the new lows.
Please, study how GBPCHF was moving for a week on an hourly time frame.
The periods of balance were changed by the periods of bullish or bearish imbalances, that found a new equilibrium on higher/lower price levels.
Understanding of basic principles of supply and demand in trading is essential for profitable trading smart money concepts.
Learn to recognize the periods of imbalance and equilibrium.
It will provide you the edge in understanding and trading any forex pair.
❤️Please, support my work with like, thank you!❤️
I am part of Trade Nation's Influencer program and receive a monthly fee for using their TradingView charts in my analysis.
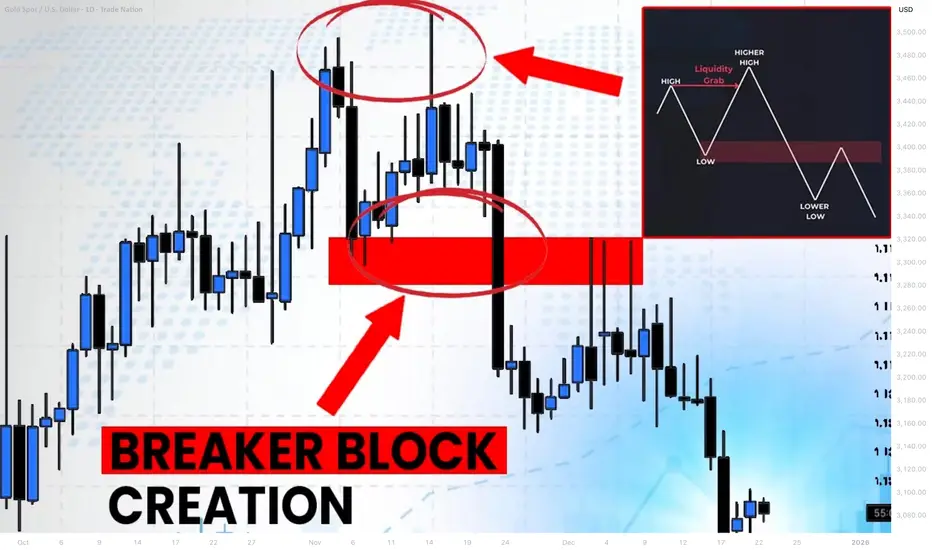
What is Bullish/Bearish Breaker Block & How to Find It Easily
Breaker blocks are easier to find than you think.
In this article, I will share with you very efficient price models for the identification of Order Blocks and Breaker Blocks.
You will learn their meaning, how to draw and use them in trading Smart Money Concepts SMC.
Bullish Trend Model & Breaker Block.
Let's start with an essential theory .
Please, examine a following price model:
In a classic bullish structure where the price consistently updates Higher Highs HH and Higher Lows HH, a bullish order block zone will be the area based on the last Higher How.
I will explain how to draw that zone in the examples below.
In some instances, a bullish order block zone will fail to deliver a bullish wave. Its bearish breakout will follow after its test instead.
It will be a critical event that is called a market structure shift in Smart Money Concepts SMC.
A formation of a new low will signify a violation of a bullish trend and a highly probable change of the market sentiment.
A broken bullish order block zone will turn into a Bearish Breaker Block.
The zone from where the next bearish wave will most likely follow.
It will provide a very safe place to sell from.
Market structure shift in a bullish trend is not a random event.
It usually occurs after a test of a significant supply zone with a liquidity grab.
It can help you to predict the change of the sentiment way before it happens.
That's an example of such a price model on GBPAUD forex pair.
We see a confirmed bullish liquidity sweep in uptrend after a test of a historic supply zone.
A bearish wave followed then and a bullish order block zone was broken.
To draw Order Block Zone, I picked the level of the last higher low as its lower boundary and a low of a body of that candlestick as the upper boundary.
After a breakout, it turned into a Bearish Breaker Block.
A bearish continuation occurred after its test.
Bearish Trend Model & Breaker Block.
Please, check this model:
In a classic bearish structure where the price consistently updates Lower Lows LL and Lower Highs LH, a bearish order block zone will be the area based on the last Lower High.
In some instances, a bearish order block zone will fail to deliver a bearish wave. Its bullish breakout will follow after its test instead.
It will be a significant event that is called a bullish market structure shift in Smart Money Concepts SMC.
A formation of a new high will signify a violation of a bearish trend and a highly probable change of the market sentiment.
A broken bearish order block zone will turn into a Bullish Breaker Block.
The zone from where the next bullish wave will most likely follow.
It will provide a very safe place to buy from.
Market structure shift in a bearish trend is not a random event.
It usually occurs after a test of a significant demand zone with a liquidity grab.
That's a real example of such a price model on WTI Crude Oil.
A bearish structure was violated after a test of a demand zone.
A bearish order block was broken, and it turned into a Bullish Breaker Block Zone then.
(Drawing a bullish order block zone, I picked the level of the last lower high as its upper boundary and a high of a body of that candle as its lower boundary )
A bullish movement followed after a deep test of that.
A proper combination of structure mapping and liquidity analysis will help you to predict a market structure shirt and a breaker block creation before they happen.
The models that I shared will help you to confirm bullish and bearish breaker blocks trading Forex or any other markets with Smart Money Concepts SMC ICT.
❤️Please, support my work with like, thank you!❤️
I am part of Trade Nation's Influencer program and receive a monthly fee for using their TradingView charts in my analysis.
Profitable Multiple Time Frames Smart Money Strategy For Trading
In this post, I will share with you a very accurate and profitable SMC Smart Money trading strategy that combines top-down analysis, liquidity, imbalance, order block and inducement.
Step 1 - Identify liquidity zones on a daily
Liquidity zones are the areas on a price chart, where big players are placing their orders. From such areas, significant bullish and bearish movements initiate.
Liquidity zones that are above the current price will be the supply zones, while the liquidity zones that are below the current price will be the demand zones.
We will look for shorting opportunities from supply areas and for buying opportunities from demand zones.
Here are the liquidity zones that I identified on EURJPY.
Step 2 - Wait for a test of one of the liquidity zones
Let the market test the liquidity zone.
For buying, the price should reach a lower boundary of a demand zone.
For shorting, the price should test an upper boundary of a supply zone.
I underlined the exact levels that the price should test on EURJPY.
Here is the test of the lower boundary of the demand zone.
Step 3 - Look for inducement on an hourly time frame
With the inducement, smart money make the market participants think that the liquidity zone that the price is testing doesn't hold anymore.
When the price tests a supply area, an hourly candle close above its upper boundary will be a bullish inducement.
With that, the smart money incentivize buying orders.
When the price tests a demand area, an hourly candle close below its lower boundary will be a bearish inducement.
With that, the smart money incentivize selling orders.
The price closed below a lower boundary of a demand zone on EURJPY on 1H time frame.
Step 4 - Look for imbalance on an hourly time frame
After a violation of a supply area on an hourly time frame, look for a bearish imbalance.
Bearish imbalance is a strong bearish candle with wide range and big body. With that candle, the market should return within a supply zone and closed within or below that.
After a violation of a demand area on an hourly time frame, look for a bullish imbalance.
Bullish imbalance is a strong bullish candle with wide range and big body. With that candle, the market should return within a demand zone and closed within or above that.
Here is the example of a bullish imbalance on EURJPY.
After a bearish inducement, the price formed a high momentum bullish candle and closed within the demand zone.
The imbalance signify that a liquidity zone violation was a trap .
With that, smart money simply was trying to grab the liquidity.
That will be a signal for you to open an order.
Step 5 - Look for an order block
After the formation of the imbalance, the market becomes locally week and quite often corrects to an order block.
Order block will be the closest hourly liquidity zone.
After a formation of a bearish imbalance, look for a supply zone on an hourly time frame. That will be your perfect zone to sell .
After a formation of a bullish imbalance, look for a demand zone on an hourly. That will be your area to buy from.
Here is the order block on EURJPY.
Step 6 - Set a limit order
Set a sell limit order within a supply area after a formation of bearish imbalance on an hourly time frame.
Set a buy limit order within a demand area after a formation of a bullish imbalance on an hourly.
Here is your buy entry level on EURJPY.
Step 7 - Select the target
If you sell, your target should be the closest daily structure support: horizontal or vertical one.
If you buy, your target should be the closest daily structure resistance: horizontal or vertical one.
In our example, our closest structure resistance if a falling trend line.
Step 8 - Set stop loss
If you sell, stop loss will lie above a bullish inducement.
If you buy, stop loss will lie below a bearish inducement.
Here is a perfect point for a stop loss for a long trade on EURJPY.
Step 9 - Trade
Let the price trigger your entry, and then be prepared to wait.
It took many days for EURJPY to reach the target.
Trading Tips:
1. Make sure that you have a positive reward/ratio. It should be at least 1.2
2. Risk no more that 1% of your trading account per trade
Being applied properly, that strategy shows 70%+ accuracy.
Try it by yourself and let me know your results.
❤️Please, support my work with like, thank you!❤️
I am part of Trade Nation's Influencer program and receive a monthly fee for using their TradingView charts in my analysis.
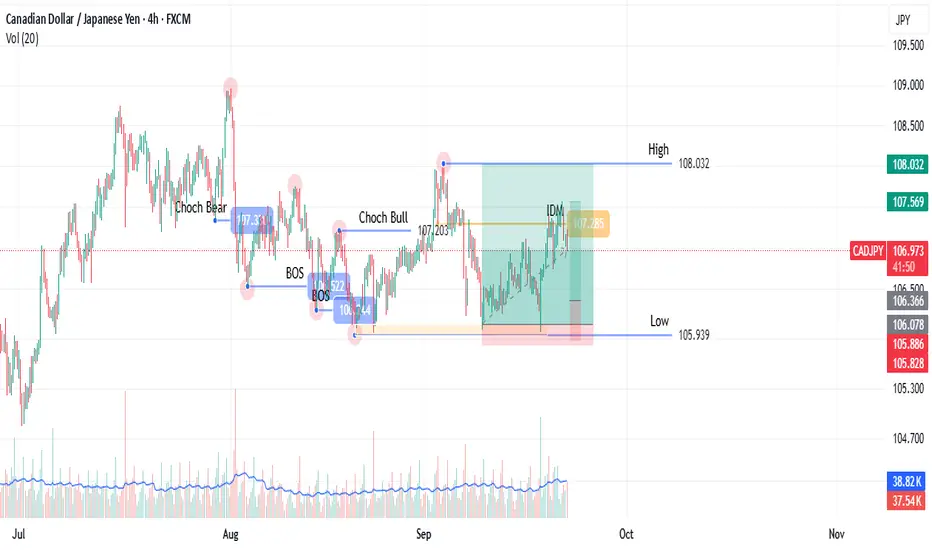
SMC Concept: Defining the Trading Range (Step 1) On CADJPYCAD/JPY, 4H Timeframe (as demonstrated)
This post outlines the first step in a methodology focused on identifying key market structure levels. The goal is to objectively define a trading range, using CAD/JPY as the example.
The Process: Of a bullish Structure
Identify the range Low: Locate the last retracement from the previous high, the low is deepest price level retraced to.
Find the Inducement: Mark the low of the most recent pullback (retracement) before the price made a new high.
Wait for Confirmation: The high is only confirmed once price returns to hit this inducement level. This validates the high as an official range boundary.
A break of the confirmed high is a break of structure (BOS). A break of the confirmed low suggests a change of character (CHoCH), shifting sentiment.
This is the foundational step for identifying future points of interest. The next step involves plotting POIs based on this confirmed range.
This methodology is based on one that I learned from someone else on Youtube, but I have changed many details to suit my style. As a thank you note, I have referred to this person on other paltforms, but unfortunately, I don't think I can do this here as I might be violating this platform's rules.
I will be posting the next steps that would lead to deciding on a trading position on step by step basis.
I am already making videos but I might be using this platforms video option for later posts.
SMC Trading Basics. Liquidity Zones & How to Identify Them
In the today's article, I will teach you the concept of liquidity zones and how to identify them properly, trading Forex, Gold, Crypto and Indexes.
Simply put, a liquidity zone is a certain area on a price chart where a significant concentration of trading volumes occurred.
Huge trading volumes signify the presence of big players: hedge funds, banks, etc...
Correct identification of liquidity zones is essential for smart money trading, because such zones provide the safest and the most profitable trading opportunities.
There are 3 common characteristics of a valid liquidity zone:
1. Huge volume spikes upon its test
Take a look at the underlined blue area on USDCAD.
We see sharp volume spikes when the market was testing that area.
2. Strong rejections from such an area with a formation of long wicks
Look how the price reacts to the liquidity zone on USDJPY.
We see multiple strong rejections from that.
3. Long consolidation within that zone
Bitcoin was "standing" on a liquidity zone for more than 3 weeks, barely moving while trading volumes were quietly accumulating.
4. Multiple strong bullish or bearish reactions to that area
Just look how many times the underlined area was respected by the buyers and by the sellers. That is a perfect example of a liquidity zone.
To underline a liquidity zone properly, follow these simple rules:
1. If the price is ABOVE the liquidity zone, its lower boundary
will be the lowest wick within that area and its upper boundary will be the lowest candle close. Such a liquidity zone will be called a demand area.
Here is the example of drawing a liquidity zone on GBPUSD.
The lower boundary of the zone is the lowest wick, while its upper boundary is the lowest candle close.
2. If the price is BELOW the liquidity zone, its upper boundary will be the highest wick within that area and its lower boundary will be the highest candle close. Such a liquidity zone will be called a supply area.
Here is the liquidity zone that I identified on Gold following our rules.
Remember, that you can identify liquidity zones on any time frame. However, the rule is that the higher is the time frame, the stronger is the liquidity zone.
I prefer to analyze the liquidity zones on a daily time frame.
Once you underlined liquidity zones, you should realize that within these areas, big players are expected to place their orders in the future.
For that reason, after the tests of such areas, a strong bullish or bearish movements will be expected.
Here is a huge liquidity zone that I spotted on GBPJPY.
Look at a strong bearish movement that initiated after its test.
Your task as a smart money trader will be to identify bullish or bearish confirmations and understand the intentions of big players. With experience, you will learn to recognize valid signals.
❤️Please, support my work with like, thank you!❤️
I am part of Trade Nation's Influencer program and receive a monthly fee for using their TradingView charts in my analysis.
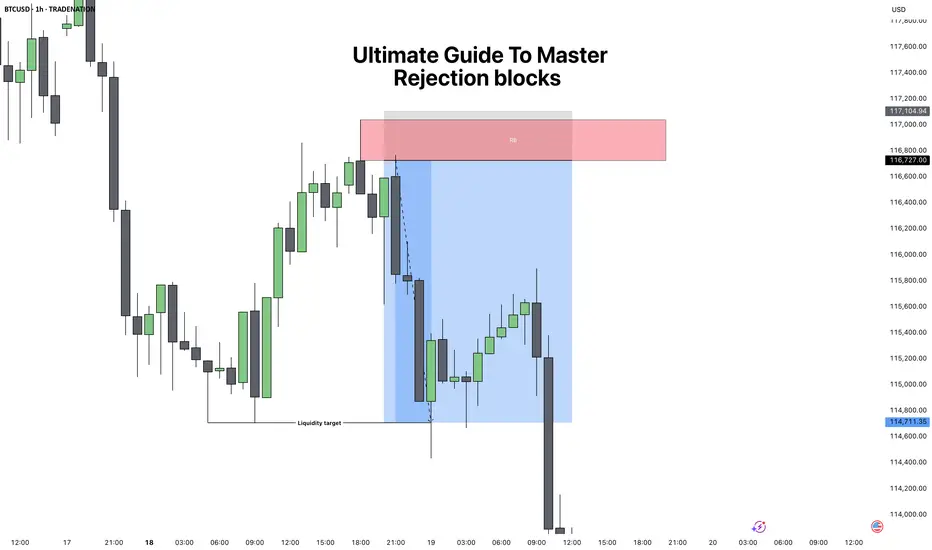
Ultimate Guide to Master: Rejection BlocksRejection Blocks (ICT Concept) – Complete Guide
1. What is a Rejection Block?
A rejection block is a special type of price level that forms when the market attempts to push through but gets denied and reverses. Unlike a traditional order block, which represents accumulation or distribution by institutions, a rejection block shows a failed attempt to continue in one direction. It is a footprint of rejection and often becomes a strong reaction zone in the future.
There are two types:
Bullish Rejection Block:
Forms from a bearish candle whose low is taken out, but price fails to continue lower and closes back above. The low of that candle becomes the key level.
Bearish Rejection Block:
Forms from a bullish candle whose high is breached, but price fails to continue higher and closes back inside. The high of that candle becomes the key level.
These levels can act as hidden support or resistance and often serve as high-probability entry points when combined with market structure.
2. How to Spot a Valid Rejection Block
To correctly identify rejection blocks, you need to look for:
1. Clear Attempt Beyond a Candle
Price must trade beyond the high or low of a prior candle, suggesting continuation.
2. Failure and Return
After breaching the level, price fails and closes back inside the candle’s body.
3. Liquidity Context
A rejection block is more powerful if the wick that caused it swept liquidity (equal highs/lows or a previous key level).
4. Higher Timeframe Confluence
The best rejection blocks line up with higher timeframe bias (for example, spotting a bearish rejection block inside a 4H premium zone during a downtrend).
3. How to Trade Rejection Blocks
Trading them involves waiting for price to come back to the rejection block level and using it as an entry or reaction zone.
Bullish Setup:
When price trades below a bearish candle, fails, and closes higher, mark the low of that candle. On a retracement, price often retests that level as support.
Bearish Setup:
When price trades above a bullish candle, fails, and closes lower, mark the high of that candle. On a retracement, price often retests that level as resistance.
Entry Technique:
You can enter "blindly" when you're understanding the confluences. But to begin with do this Instead, when price returns to the rejection block, drop to a lower timeframe and look for confirmation such as:
* Fair Value Gap (FVG) entries.
* Market Structure Shift (MSS).
* Liquidity sweeps into the level.
Stop Loss Placement:
Always place stops beyond the rejection candle itself (above the high for bearish RB, below the low for bullish RB).
4. Practical Examples and Market Context
Rejection blocks work best when they appear in the following situations:
Liquidity Sweeps:
After equal highs or equal lows are taken out, a rejection block often marks the failure point.
Inside Premium/Discount Zones:
In a bearish bias, look for bearish RBs in premium pricing. In a bullish bias, look for bullish RBs in discount pricing.
During Consolidation Breakouts:
If the market fakes a breakout and closes back inside, the rejection block often becomes the level to fade the fake move.
For example, if BTC takes out a prior daily high, prints a rejection block, and then closes back inside, the odds of reversal are high, especially if price was already in premium territory.
5. Combining Rejection Blocks with ICT Concepts
To increase accuracy, always combine RBs with ICT’s other tools:
Fair Value Gaps:
If a rejection block aligns with an FVG, it adds strength to the level.
Market Structure Shifts:
A rejection block is more powerful if followed by displacement and an MSS.
CISD Pattern:
A rejection block often forms right after the “Stop Hunt” part of the CISD sequence, serving as a clean entry.
Liquidity Pools:
Look for RBs near equal highs/lows, old highs/lows, or session liquidity (London/New York).
Conclusion
Rejection blocks are subtle but highly effective levels that show where the market tried to extend but failed, leaving behind a hidden form of support or resistance. By themselves they are useful, but when combined with ICT concepts like liquidity sweeps, MSS, and FVGs, they become powerful entry tools. The key is to always wait for price to return and confirm the level before entering, and to only trade them in alignment with higher timeframe bias.
Disclosure: I am part of Trade Nation's Influencer program and receive a monthly fee for using their TradingView charts in my analysis.
___________________________________
Thanks for your support!
If you found this idea helpful or learned something new, drop a like 👍 and leave a comment, I’d love to hear your thoughts! 🚀
Break of Structure VS Liquidity Grab. How to Identify Valid BoS
The main problem with break of structure trading is that you can easily confuse that with a liquidity grab.
But don't worry.
There is a secret SMC price model that will help you to confirm a break of structure in a second.
Learn smart money concepts trading secrets and a simple strategy to trade break of structure on any forex pair.
Let's study a break of structure that I spotted on AUDUSD forex pair.
We see that the market is bullish on a daily time frame and the price has just violated a previous high with a break of structure.
The issue with that is the fact that such a violation can easily be a liquidity grab and a bullish trap .
Buying the market immediately after a BoS, we can incur a huge loss .
We need something that would help us to accurate validate that.
Fortunately, there is a simple price model in SMC that will help.
After you spotted a break of structure on a daily time frame,
use a 4h time frame for its validation.
After a BoS on a daily time frame, the market usually starts retracing , setting a new local high.
To confirm that it is not a trap, you will need a break of THAT structure on a 4H time frame.
It will increase the probabilities that the entire bullish movement that you see on a daily is not a manipulation.
Here is what exactly we need.
After the price violated a daily structure and closed above that, we see a minor intraday retracement on a 4h time frame.
A bullish violation of the last high there is our BoS confirmation and a clear indicator of the strength of the buyers.
You can execute a buy trade, following a simple strategy then.
Set a buy limit order on a retest of a broken high on a 4H,
a stop loss should be below the last higher low,
a take profit is based on the next supply zone on a daily.
To avoid the traps, a single time frame is not enough for profitable trading break of structure.
Learn to integrate multiple time frames in smart money concepts trading. It will help you make thousands of pips weekly.
❤️Please, support my work with like, thank you!❤️
I am part of Trade Nation's Influencer program and receive a monthly fee for using their TradingView charts in my analysis.
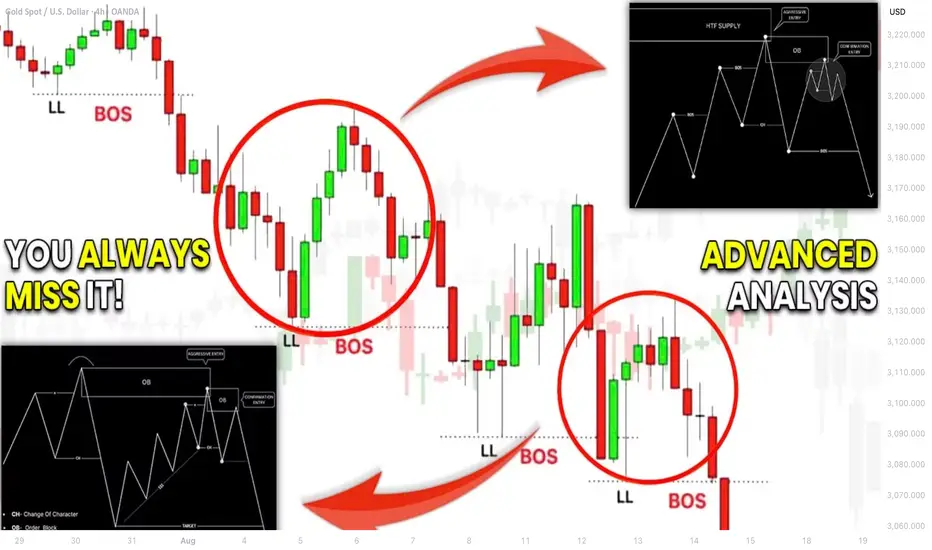
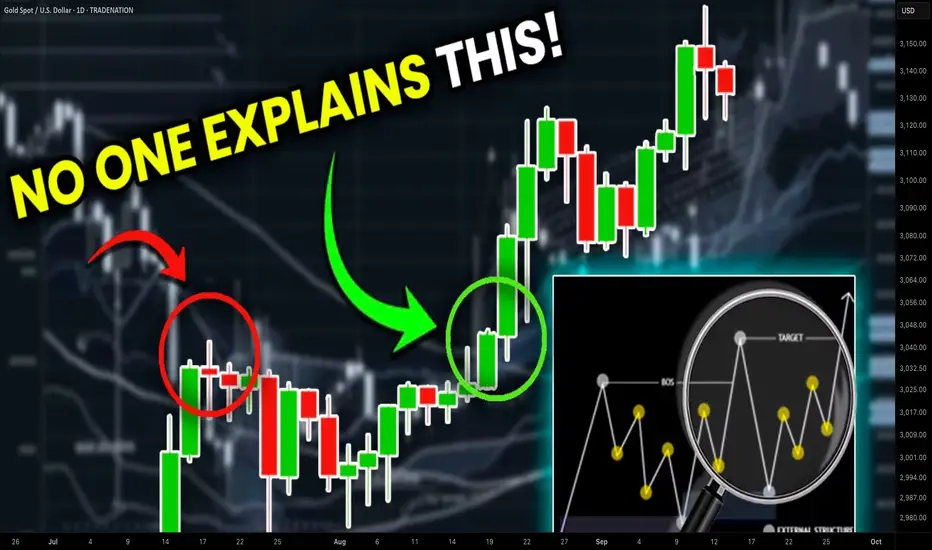
How to Do Structure Mapping with Multiple Time Frames Analysis
If you think that structure mapping is not efficient for profitable trading, you get it wrong .
What newbies traders always miss is that structure mapping works effectively only with multiple time frame analysis.
In this article, I will show you how you can build profitable trading plans and accurate predictions on forex market with structure mapping alone.
Learn top-down analysis secrets and how to map structure properly in Smart Money Concepts SMC ICT.
In order to effectively use structure mapping for scalping, day trading and swing trading , always start it from higher time frames.
Examine my complete structure mapping on USDJPY forex pair on a daily time frame.
You can see that first, the pair was trading in a strong bearish trend.
Then, we had a confirmed bullish reversal with Change of Character.
After that, the market started an extended consolidating movement, not being able to update the highs.
And finally, the last bullish wave managed to update a high , confirming a completion of a consolidation and a resumption of a bullish trend.
Structure mapping reveals that USDJPY is now bullish on a daily and the last bearish movement is a correction in uptrend.
We can expect a start of a new bullish wave soon.
To understand when exactly it is going to happen, you will need to dive your analysis deeper .
You should start structure mapping on lower time frames.
And you should execute a price action analysis there in relation to your structure mapping on a higher time frame.
4H time frame structure mapping will reveal a price action within the last bearish move that we spotted on a daily.
We see that the market is trading in a bearish trend and the price started a local correctional movement after a formation of the last low.
4h time frame structure mapping provided a detailed intra week perspective.
Hourly time frame analysis, we reveal hidden intraday trends that will unveil more insights.
And why are we doing all that?
Remember that big waves always start from minor reversals.
The earlier you are able to find strong confirmations, the earlier you will open a trading position and the more profits you will make.
On an hourly time frame, our structure mapping shows that the market is already bullish. A bearish trend that USDJPY followed is already violated, and the price is updating the highs.
Following our analysis, the only thing that we need to confirm a start of a bullish trend is a confirmed trend reversal and a change of character on a 4H time frame.
It will validate an intra week bullish trend.
We will need the price to break the underlined blue resistance based on the last lower high in a bearish trend.
That will provide an accurate signal for us to buy.
And we can anticipate a rise a least to a current daily higher high then.
When you do structure mapping on forex market, never forget to do that on multiple time frames. Multiple perspectives and short-term/mid-term/long-term projections will help you to build a more efficient trading plan.
Remember that you can expand your structure mapping even for minute time frames. It will provide a unique perspective for scalping forex.
❤️Please, support my work with like, thank you!❤️
Market Manipulations. Bullish Trap (Smart Money Concepts SMC)
In the today's article, we will discuss how smart money manipulate the market with a bullish trap .
In simple words, a bullish trap is a FALSE bullish signal created by big players.
With a bullish trap, the smart money aims to:
1️⃣ Increase demand for an asset, encouraging the market participant to buy it.
2️⃣ Make sellers close their positions in a loss .
When a short position is closed, it is automatically BOUGHT by the market.
Take a look at a key horizontal resistance on AUDCHF.
Many times in the past, the market dropped from that.
For sellers, it is a perfect area to short from.
Bullish violation of the underlined zone make sellers close their position in a loss and attracts buyers.
Then the market suddenly starts falling heavily, revealing the presence of smart money.
Both the sellers and the buyers lose their money because of the manipulation.
There are 2 main reasons why the smart money manipulates the markets in a such a way:
1️⃣ - A big player is seeking to close a huge long position
When a long position is closed, it is automatically SOLD to the market.
In order to sell a huge position, smart money needs a counterpart who will buy their position.
Triggering stop losses of sellers and creating a false demand, smart money sell their position partially to the crowd.
2️⃣ - A big player wants to open a huge short position
But why the smart money can't just close their long position or open short without a manipulation?
A big sell order placed by the institutional trader, closing their long position, can have an impact on the price of the asset. If the sell order is large enough, it can push the price downward as sellers outnumber buyers. Smart money are trying to balance the supply and demand on the market, hiding their presence.
It is quite complicated for the newbies and even for experienced traders to recognize a bullish trap.
One of the efficient ways is to apply multiple time frame analysis and price action.
Remember, that most of the time bullish traps occur on key horizontal or vertical resistances.
After you see a breakout, analyze lower time frames.
Quite often, after a breakout, the market starts ranging .
After a breakout of a key daily resistance, gold started to consolidate within a narrow range on an hourly time frame.
Bearish breakout of the support of the range will indicate a strength of the sellers and a highly probable bullish trap.
Remember, that you can not spot all the traps, and occasionally you will be fooled by smart money. However, with experience, you will learn to recognize common bullish traps.
❤️Please, support my work with like, thank you!❤️
I am part of Trade Nation's Influencer program and receive a monthly fee for using their TradingView charts in my analysis.

Accurate Price Model for Trading Smart Money Concepts SMC (=
If you trade Smart Money Concepts SMC, there is one single pattern that you should learn to identify.
In this article, you will learn an accurate price model that you can use to predict a strong bullish or bearish movement way before it happens.
Read carefully and discover how to track the silent actions of smart money on any market.
The only thing that you need to learn to easily find this pattern is basic Structure Mapping . After you map significant highs and lows, you will quickly recognize it.
This SMC pattern has 2 models: bullish and bearish ones.
Let's start with a bearish setup first.
Examine a structure of this pattern
it should be based on 2 important elements.
The price should set a sequence of equal lows.
These equal lows will compose a demand zone.
The area where a buying interest will concentrate.
The minimum number of equal lows and lowers highs should be 2 to make a model valid.
Exhausting of bullish moves will signify a loss of confidence in a demand zone . Less and less market participants will open buy positions from that.
At some moment, a demand zone will stop holding. Its bearish breakout will provide a strong bearish signal , and a bearish continuation will most likely follow.
This price model will signify a market manipulation by Smart Money.
They will not intentionally let the price fall, not letting it break a demand zone. A buying interest that will arise consequently will be used as a source of liquidity.
Smart money will grab liquidity of the buyers, silently accumulating huge volumes of selling orders.
Once they get enough of that, a bearish rally will start, with a demand zone breakout as a trigger.
Though, the chart model that I shared above has a strong bullish impulse, preceding its formation, remember that it is not mandatory.
The price may also form a bearish impulse first and for a pattern then.
Each bullish movement that initiates after a formation of an equal low should be weaker than a previous one.
So that the price should set a lower high every time after a formation of an equal low.
Look at a price action on USDCHF forex pair. Way before the price dropped, you could easily identify a market manipulation of Smart Money and selling orders accumulation.
A breakout of a horizontal demand zone was a final bearish confirmation signal.
Let's study its bullish model.
It has a similar structure.
The price should set a sequence of equal highs, respecting a horizontal supply zone.
Each bearish move that follows after its test should have a shorter length, forming a higher low with its completion.
This model will be also valid if it forms after a completion of a bearish impulse.
Weakening bearish movements will signify a loss of confidence in a supply zone, with fewer and fewer market participants selling that.
Its bullish breakout will be an important even that will confirm a highly probable strong bullish continuation.
Smart Money will use this price model to manipulate the market and accumulate buying orders, not letting the price go through a supply zone. They will grab a liquidity of the sellers each time a bearish move follows from a supply zone.
When they finally get enough of a liquidity, a bullish rally will initiate and a supply zone will be broken , providing a strong confirmation signal.
That price model was spotted on GBPJPY forex pair.
Smart Money were manipulating the market, not letting it continue rallying by creating a significant horizontal supply zone.
Selling orders that were executed after its tests provided a liquidity for them.
A bullish breakout of the underlined zone provides a strong bullish confirmation signal.
A breakout and a future rise could be easily predicted once this price model appeared.
Why they do it?
But why do Smart Money manipulate the markets that way?
The answer is simple: in comparison to retail traders, they trade with huge trading orders . To hide their presence and to not impact market prices much, they split their positions into a set of tiny orders that they execute, grabbing the liquidity.
The price model that we discussed today is the example how they do it.
The important thing to note about this pattern is that it efficiently works on any market and any time frame. You can use that for scalping, day trading, swing trading. And it can help you find great investing opportunities.
❤️Please, support my work with like, thank you!❤️
I am part of Trade Nation's Influencer program and receive a monthly fee for using their TradingView charts in my analysis.
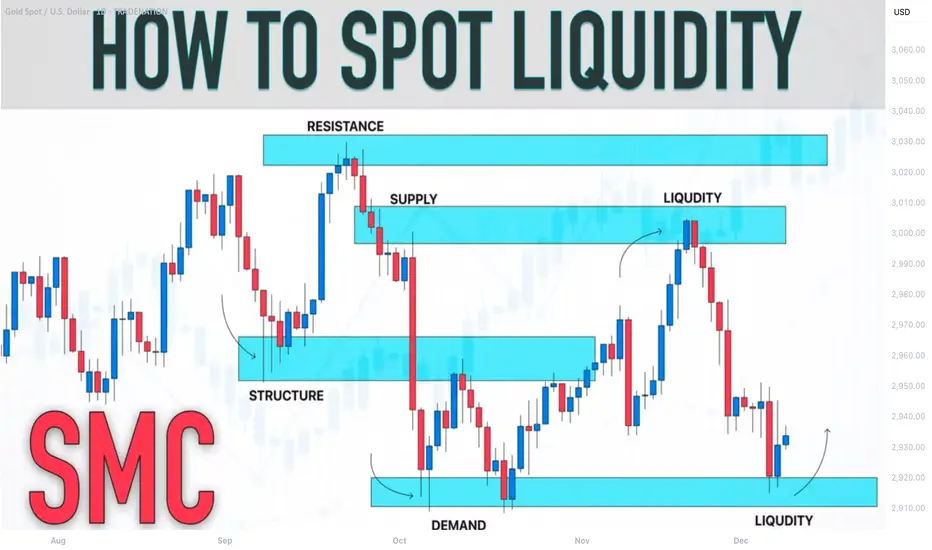
How to Find Liquidity Zones/Clusters on Any Forex Pair (GOLD)
You need just 1 minute of your time to find significant liquidity zones on any Forex pair and Gold.
In this article, I will teach you how to identify supply and demand zones easily step by step.
Liquidity Basics
By a market liquidity, I mean market orders.
The orders are not equally distributed among all the price levels.
While some will concentrate the interest of the market participants,
some levels will be low on liquidity.
Price levels and the areas that will attract and amass trading orders will be called liquidity zones.
How to Find Supply Zones
To find the strongest liquidity clusters, we will need to analyze a daily time frame.
A liquidity zone that is above current prices will be called a supply zone.
High volumes of selling orders will be distributed within.
One of the proven techniques to find such zones is to analyze a historic price action. You should identify a price level that acted as a strong resistance in the past.
4 horizontal levels that I underlined on EURGBP influenced market behavior in the recent past.
The price retraced from these levels significantly.
Why It Happened?
A down movement could occur because of an excess of selling orders and a closure of long positions by the buyers.
These factors indicate a high concentration of a liquidity around these price levels.
How to Draw Supply Zone?
One more thing to note about all these horizontal levels is that they cluster and the distance between them is relatively small .
To find a significant liquidity supply zone, I advise merging them into a single zone.
To draw that properly, its high should be based on the highest high among these levels. Its low should be based on the highest candle close level.
Following this strategy, here are 2 more significant supply zones.
We will assume that selling interest will concentrate within these areas and selling orders will be spread across its price ranges.
How to Find Demand Zones
A liquidity zone that is below current spot price levels will be called a demand zone . We will assume that buying orders will accumulate within.
To find these zones, we will analyze historically important price levels that acted as strong supports in the past.
I found 3 key support levels.
After tests of these levels, buying pressure emerged.
Why It Happened?
A bullish movement could occur because of an excess of buying orders and a closure of short positions by the sellers. Such clues strongly indicate a concentration of liquidity.
How to Draw Demand Zones?
Because these levels are close to each other, we will unify them into a one liquidity demand zone.
To draw a demand zone, I suggest that its low should be the lowest low among these key levels and its high should be the lowest candle close.
Examine 2 more liquidity zones that I found following this method.
Please, note that Demand Zone 2 is based on one single key level.
It is not mandatory for a liquidity zone to be based on multiple significant levels, it can be just one.
We will assume that buying interest will concentrate within these areas and buying orders will be allocated within the hole range.
Broken Liquidity Zones
There is one more liquidity zone that I did not underline.
That is a broken supply zone. After a breakout and a candle close above, it turned into a demand zone. For that reason, I plotted that based on the rules of supply zone drawing.
Start Market Analysis From Liquidity
Liquidity zones are one of the core elements of forex trading.
Your ability to recognize them properly is the key in predicting accurate price reversals.
Identify liquidity zones for:
spotting safe entry points,
use these zones as targets,
set your stop losses taking them into consideration.
They will help you to better understand the psychology of the market participants and their behavior.
I hope that the today's tutorial demonstrated you that it is very easy to find them.
❤️Please, support my work with like, thank you!❤️
I am part of Trade Nation's Influencer program and receive a monthly fee for using their TradingView charts in my analysis.

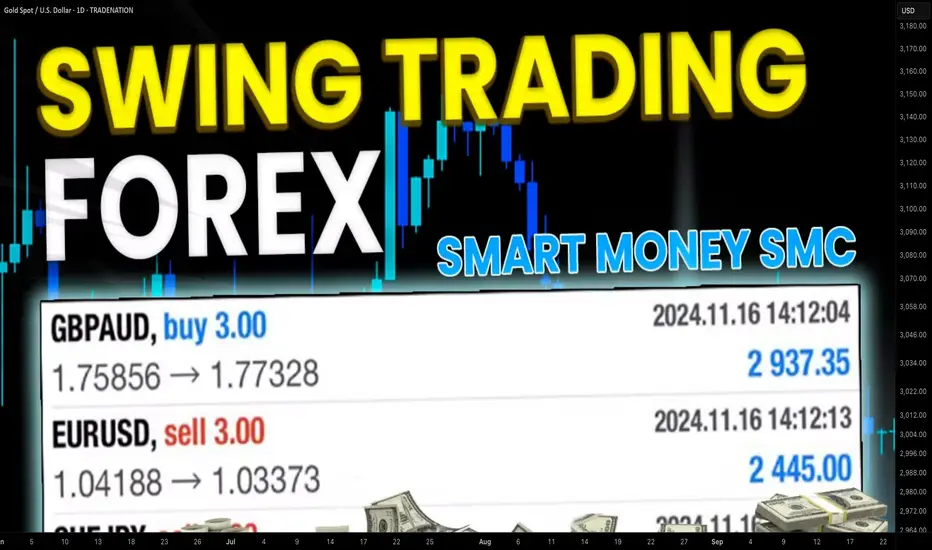
Simple Swing Trading Strategy with Smart Money Concept Explained
I will share with you the essential basics of swing trading forex gold with Smart Money Concepts.
You will learn how to do swing trading with the best SMC strategy.
I will teach you to c ombine order blocks, liquidity zones and imbalances to spot accurate entries and confirmation signals.
If you just started learning swing trading Forex with Smart Money Concepts, I strictly recommend trading with the trend only.
The cases and examples that we will discuss will be strictly trend-following ones.
Swing Trading with SMC in Uptrend
For swing buying any forex pair, we will look for the market that is trading in a bullish trend.
To confirm that the market is rising, you will need to execute structure mapping and find a forex pair that updates Higher Highs HH and Higher Lows HL.
Above is the example how I confirmed that GBPUSD is bullish with structure mapping. You can see that the pair consistently updates the highs.
Once you identified a bullish pair, your next step will be to find the zone from where the next swing move will follow.
According to the rules, the market remains in uptrend till the price is staying above or on the level of the last Higher Low HL.
Here is such a zone on GBPUSD.
It is based on the last Higher Low and current price levels.
We will assume that buying orders will concentrate within that area and from that a bullish rally will follow.
The problem is that this area is extremely wide, and we can not just buy randomly within.
Our next step will be to find liquidity zones within.
To buy, we need demand areas.
I found 4 price action based historic demand zones on GBPUSD.
We will need to wait for the test of one of these zones and then wait for an order block - a place where smart money are placing their buy orders.
The problem is that we don't know in which of these areas the order block is, so we will need to wait for tests of these zones and a consequent imbalance to confirm it.
To confirm a bullish imbalance for swing trading Forex, I recommend analyzing a 4H time frame after a test of a demand zone.
According to Smart Money Concepts, a bullish imbalance can be any sign of strength of the buyers : bullish breakout of a vertical/horizontal resistance, change of character, high momentum bullish candle, bullish price action pattern, etc.
An order block on GBPUSD was confirmed with a breakout of a resistance line of a falling channel on a 4H time frame.
That was the signal that Smart Money are buying, and that is your signal to open a swing long trade.
You place a buy position then with a stop loss below the order block and a target - at least a current high.
Swing Trading with SMC in Downtrend
For swing selling any forex pair, you will need to find a market that is trading in a bearish trend.
I suggest applying structure mapping to identify such a pair.
It simply should update Lower Lows LL and Lower Highs consistently.
USDCAD is trading in a bearish trend.
Structure mapping helps to easily confirm that.
Then, we will need to identify the zone from where the next bearish wave will start.
According to Smart Money Concepts structure mapping rules, the market remains bearish till the price is staying below or on the level of the last Lower High LH.
That's such a zone on USDCAD.
It is based on current prices and the last Lower High.
We will assume that selling orders will be distributed along the entire lenth of our zone.
Of course, we can not sell randomly within that zone because it is relatively extended.
Our next task will be to find liquidity supply zones within.
I found 2 price action based supply zones within our underlined area.
Before we sell, we will need to find an order block.
A place from where smart money are selling big.
To spot that, I suggest waiting for a test of one of our supply zones and wait for a bearish imbalance on a 4H time frame.
According to SMC, a bearish imbalance can be a bearish high momentum candle, a bearish CHoCH, a bearish price action pattern, a bearish breakout of a horizontal/vertical support , etc.
You can see that a lower supply zone was tested on USDCAD.
Our bearish order block confirmation is a bearish Change of Character, a formation of a high momentum bearish candle and a breakout of a rising trend line.
After that we can open a swing sell position and expect a bearish movement at least to a current low.
Stop loss should lie strictly above the order block.
TP should be at least a c urrent low.
That is how a trade should be executed on USDCAD pair.
Remember that there is no guarantee that the order block will be within a liquidity zone. You should learn to track the signs of smart money and their operations.
A proper combination of a trend analysis, liquidity zones and order block is the essential basis of a profitable swing trading Forex.
Mastering that, practice recognizing the imbalances and confirmations for spotting the best swing trading entries.
❤️Please, support my work with like, thank you!❤️
I am part of Trade Nation's Influencer program and receive a monthly fee for using their TradingView charts in my analysis.
How to Trade Liquidity Sweep in Forex Market (SMC Trading)
I will show you a real example of trading liquidity sweep with Smart Money Concepts.
You will learn the essential SMC liquidity basics, a simple and profitable strategy to identify and trade liquidity sweep.
I will share with you an accurate entry confirmation signal that works perfectly on any Forex pair.
Liquidity Basics
In order to trade liquidity sweeps profitably, you should learn to identify significant liquidity zones.
To spot them, analyze a historic price action and find clusters of important historic key levels.
Examine a price action on EURUSD on an hourly time frame.
I underlined multiple horizontal key levels.
The price respected each level, found support on them, and rebounded.
What is so specific about these levels is that they are lying close to each other, composing a liquidity cluster.
That fact that EURUSD strongly bounced from these levels suggests that buying interest and high buying volumes were concentrated around them.
We can unite these levels and treat them as a single demand zone that has just been broken and turned into a supply zone.
After we found a valid liquidity zone, we can look for a liquidity sweep.
First, we should let the price approach that area and look for a specific price behavior then.
That is a perfect example of a liquidity sweep.
You can see that the price formed a wide range candle with a long tail.
Its high went way beyond the underlined area, but its body closed within.
In order to understand, why a liquidity sweep occurred, let's zoom in our chart and try to understand a behavior of the market participants.
Our supply zone concentrated selling orders , we assume that sellers were placing their orders across its entire length.
Their stop losses were presumably lying above that area.
Smart Money know that and with a liquidity sweep they manipulate the market, making sellers close their positions in a loss (buying back their positions from the market) and providing a liquidity for big players.
After a formation of a such a candlestick, a reliable confirmation of a saturation of the Smart Money is a formation of a strong bearish candle - a clear sign of strength of the sellers.
A bearish engulfing candle above confirmed a completion of a liquidity sweep and indicates a highly probable bearish continuation.
Your perfect sell entry is immediately after a close of such a candlestick.
Stop loss should strictly lie above the high of a liquidity sweep.
Take profit is based on a local low.
Look, how quickly the price reached the goal.
Your strategy of trading liquidity sweeps of demand zones is absolutely the same.
Let the price test a demand zone, wait for a formation of wide range bearish candle with a tail going below its lows.
Wait for a bullish imbalance candle and buy immediately then.
Stop loss will be below the low of a liquidity sweep, take profit - a local high.
This SMC strategy works on any time frame and can be applied for trading any Forex pair, Gold, Silver, Crypto and commodities.
Try it by your own and let me know your results.
❤️Please, support my work with like, thank you!❤️
I am part of Trade Nation's Influencer program and receive a monthly fee for using their TradingView charts in my analysis.

SMC Trading Basics. Change of Character - CHoCH (GOLD FOREX)
In the today's post, we will discuss one of the most crucial concepts in SMC - Change of Character.
Change of Character relates to market trend analysis.
In order to understand its meaning properly, first, we will discuss how Smart Money traders execute trend analysis.
🔘Smart Money Traders apply price action for the identification of the direction of the market.
They believe that the trend is bullish ,
if the price forms at least 2 bullish impulse with 2 consequent higher highs and a higher low between them.
The market trend is considered to be bearish ,
if the market forms at least 2 bearish impulses with 2 consequent lower lows and a lower high between them.
Here is how the trend analysis looks in practice.
One perceives the price action as the set of impulse and retracement legs.
According to the rules described above, USDCAD is trading in a bullish trend because the pair set 2 higher lows and 2 higher highs.
🔘Of course, trends do not last forever.
A skill of the identification of the market reversal is a key to substantial profits in trading.
Change of Character will help you quite accurately identify a bullish and bearish trend violation.
📉In a bearish trend, the main focus is the level of the last lower high.
While the market is trading below or on that, the trend remains bearish .
However, its bullish violation is a very important bullish signal,
it is called a Change of Character, and it signifies a confirmed violation of a bearish trend.
In a bearish trend, CHoCH is a very powerful bullish pattern.
Take a look, how accurate CHoCH indicated the trend reversal on Gold.
After a massive selloff, a bullish breakout of the level of the last lower high confirmed the initiation of a strong bullish wave.
📈In a bullish trend, the main point of interest is the level of the last higher low. While the price is trading above that or on that, the trend remains bullish.
A bearish violation of the last higher low level signifies the violation of a current bullish trend. It is called a Change of Character, and it is a very accurate bearish pattern.
Take a look at the example on Dollar Index below.
In a bullish trend, bearish violation of the last higher low level
quite accurately predicted a coming bearish reversal.
Change of Character is one of the simplest , yet accurate SMC patterns that you should know.
First, learn to properly execute the price action analysis and identify HH, HL, LL, LH and then CHoCH will be your main tool for the identification of the trend reversal.
❤️Please, support my work with like, thank you!❤️
I am part of Trade Nation's Influencer program and receive a monthly fee for using their TradingView charts in my analysis.

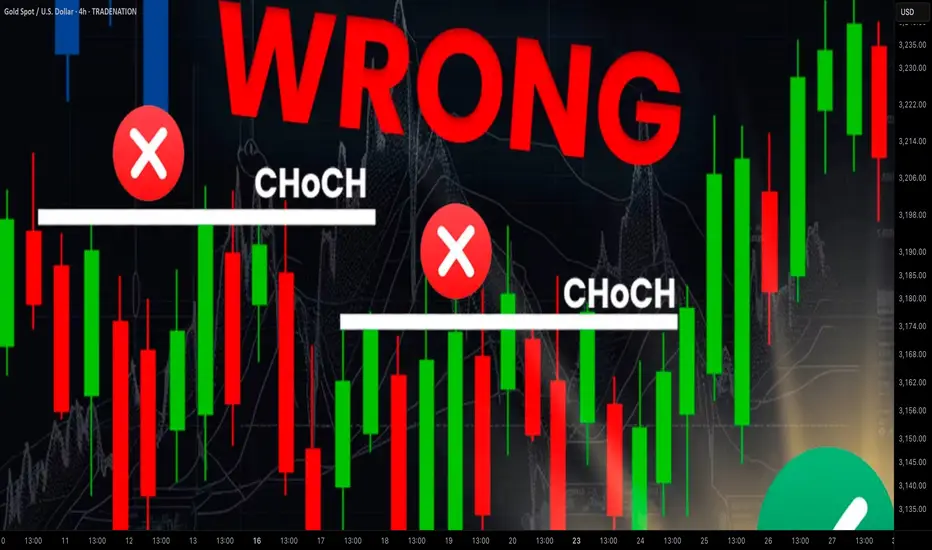
Learn Best Change of Character CHoCH Model in Trading with SMC
Most of the SMC traders get Change of Character CHoCH WRONG!
In this article, I will share with you Change of Character models that have a low accuracy and better to be avoided.
I will teach you the best CHoCH model for Forex Gold trading and show you how to identify it easily.
Let's start with the basic theory first and discuss what Change of Character signifies.
Change of Character in Bearish Trend
In a downtrend, Change of Character CHoCH is an important event that signifies a violation of a bearish trend.
CHoCH is confirmed when the price breaks and closes above the level of the last lower high.
Above, is a text book Change of Character model in a bearish trend.
For the newbie traders, such a price action provides a strong signal to buy while it fact it is NOT .
One crucial thing is missing in this model to confirm a bullish reversal.
According to basic trend analysis rules, we say that the market trend is bullish if the price forms a bullish impulse, retraces and sets a Higher Low HH , forms a new bullish impulse with a new Higher High HH.
Only then, we can say that the market is trading in up trend.
CHoCH model above confirms a bearish trend violation BUT it does not confirm a trend change.
Such a model may easily signify a deeper correction.
Look what happened with GBPNZD.
Though the price formed a confirmed bearish CHoCH, it was a false signal and just an extended correction.
That's a perfect bullish reversal model.
It combines CHoCH and conditions for a bullish trend.
Such a union is extremely accurate in predicting up movements.
Examine a price action on USDJPY.
Not only the price formed a confirmed CHoCH but also we see a start of a new bullish trend.
Change of Character in Bullish Trend
In an uptrend, Change of Character CHoCH is a significant event that signifies a violation of a bullish trend.
CHoCH is confirmed when the price breaks and closes below the level of the last higher low.
Above is a typical model of a bearish CHoCH.
For many traders, that is the signal to open short.
However, it is not that accurate and one important component is missing there.
According to basic price action rules, the market trend is bearish
if the price forms at least 2 bearish impulses with Lower Lows LL and a pullback between them with a Lower High LH.
Only when these 3 conditions are met, a bearish trend is confirmed .
Perfect bearish Change of Character model should include both CHoCH and a bearish trend price action. That will confirm a violation of a bullish trend and start of a new bearish trend.
EURCAD has a very strong potential to continue falling:
not only we see a valid bearish Change of Character but also
a start of a new bearish trend based on a price action.
Next time when you identify CHoCH on forex market, make sure that you check the preceding price action. It will help you to more accurate assess reversal probabilities and make a wiser trading decision.
❤️Please, support my work with like, thank you!❤️
I am part of Trade Nation's Influencer program and receive a monthly fee for using their TradingView charts in my analysis.
How to Trade Liquidity Sweeps Using PDH/PDL Levels (Smart Money This guide shows how to use the **Liquidity Sweep Detector – PDH/PDL Levels** script, now live on my profile.
**What It Does:**
- Accurately plots the previous day's high and low on intraday charts (15m, 1H)
- Detects when price *sweeps* above or below those levels (potential liquidity grabs)
- Visually marks sweeps with a dashed line and alerts you in real time
- Optional table to show current sweep status (can be toggled off)
**How I Use It:**
- Wait for a sweep above PDH or below PDL
- Look for rejection candles or structure shift afterward (e.g., CHoCH or BOS)
- Combine with session timing (e.g., London/NY) for confluence
**Pro Tip:**
Set alerts to catch sweeps even when you're away from the screen. Just click "Add Alert" and use:
- `PDH Sweep Triggered`
- `PDL Sweep Triggered`
This is part of how I approach Smart Money trading — combining market structure with real liquidity events.
Script is open and free to use — find it on my profile:
**Liquidity Sweep Detector – PDH/PDL Levels**

What Is SMT Divergence, and How Can You Use It in Trading?What Is SMT Divergence, and How Can You Use It in Trading?
SMT divergence, or Smart Money Technique divergence, is a concept used by traders to analyse imbalances in correlated markets. By identifying when price movements deviate between related instruments, traders can uncover potential shifts in market momentum, often linked to institutional activity. This article explores what SMT divergence is, how SMT divergence trading works, and its practical applications.
What Is SMT Divergence?
SMT divergence, short for Smart Money Technique divergence, refers to a specific type of price discrepancy between two correlated financial instruments. Part of the Inner Circle Trader (ICT) methodology, this divergence is often interpreted as a sign of institutional or "smart money" activity, as it highlights potential inefficiencies or imbalances in the market.
Here’s how an ICT SMT divergence works: correlated instruments—like EUR/USD and GBP/USD in forex, or major stock indices like the S&P 500 and NASDAQ—typically move in the same direction under normal market conditions. SMT divergence occurs when one instrument makes a higher high or lower low, while the other fails to follow suit. This inconsistency suggests that buying or selling pressure may be uneven across these markets, often caused by larger market participants adjusting their positions.
For example, if EUR/USD forms a new high, while GBP/USD lags behind and fails to break its previous high. This divergence could indicate waning momentum in one pair, hinting at a potential reversal or shift in the overall market structure. Traders analysing SMT divergence often see these moments as key opportunities to assess whether institutional players might be involved.
To identify an SMT divergence, you can monitor two correlated assets’ charts and observe discrepancies. Also, there are SMT divergence indicators for MT4, MT5, and TradingView available online that can automate the process.
The Core Components of SMT Divergence
SMT divergence relies on three key components: correlated instruments, divergence between price movements, and the involvement of institutional players. Understanding these elements is crucial for applying this concept.
1. Correlated Instruments
At the heart of SMT divergence is the relationship between correlated markets. These are instruments that typically move in tandem due to shared economic drivers. For instance, in forex, pairs like EUR/USD and GBP/USD often exhibit similar trends because they’re influenced by the strength of the US dollar, as well as their close regional ties and trade relationships. In equities, indices like the Nasdaq 100 and S&P 500 often align because they reflect broader market sentiment and contain overlapping stocks.
2. Divergence in Price Movements
The divergence occurs when these typically correlated instruments fail to move in sync. For example, one instrument may reach a higher high, while the other stalls or even reverses. This mismatch is more than just noise—it can signal a deeper imbalance in the market, often linked to uneven supply and demand dynamics. It’s these price discrepancies that traders scrutinise to identify potential turning points.
3. Institutional Activity
One of the reasons SMT divergence is so closely watched is its potential link to smart money behaviour. Institutions often use correlated instruments to mask their actions, creating subtle imbalances that only become apparent through careful analysis. For instance, when one correlated pair lags, it might reflect deliberate accumulation or distribution by larger players.
How Traders Analyse SMT Divergence
Analysing SMT divergence helps in understanding the nuanced relationship between correlated instruments and interpreting these imbalances correctly. Unlike leading correlations—such as oil influencing the Canadian dollar—SMT divergence doesn’t rely on one asset consistently driving the other. Instead, it focuses on shifts in momentum where neither instrument is the leader, but their combined behaviour hints at potential market moves.
Identifying Divergence
Traders start by observing price action in two correlated instruments or timeframes. SMT divergence becomes apparent when one instrument forms a higher high or lower low, while the other fails to do so. For example, if EUR/USD makes a higher high, but GBP/USD stalls below its previous peak, this inconsistency could signal fading bullish momentum in the broader market. The key is that neither asset leads; instead, the divergence itself provides the signal.
Some common correlations traders use include:
- Forex Pairs:
EUR/USD and GBP/USD
USD/JPY and USD/CHF
DXY and USD/CAD
- Cryptocurrencies*:
BTC/USD and ETH/USD
- Equity Indices:
S&P 500 and NASDAQ
FTSE 100 and DAX
- Treasuries:
US 10-Year Treasury Yield and USD/JPY
- Commodities:
Brent Crude and WTI Crude Oil
Interpreting Divergence at Extremes
SMT divergence is particularly significant when it occurs at market highs or lows. When divergence appears at highs—such as one instrument making a higher high while the other fails—it often signals a potential bearish reversal in the stronger instrument. Conversely, at lows, if one makes a lower low while the other holds firm, it may indicate a potential bullish reversal in the weaker one. This imbalance highlights where momentum might shift.
Adding Context
Traders rarely rely on an SMT divergence strategy alone. They often look for supporting evidence, such as volume analysis, market structure shifts, or order flow data, to confirm the signal. For instance, divergence combined with signs of institutional selling near a high could strengthen the case for a bearish move.
SMT Divergence in Different Market Conditions
SMT divergence behaves differently depending on market conditions, offering traders insights that vary between trending and ranging environments. Its effectiveness hinges on the context in which it appears, so understanding how it adapts to different scenarios is key.
Trending Markets
In trending markets, SMT divergence often signals potential reversals or pauses in momentum. For example, in a strong uptrend, divergence at a new high (where one correlated instrument makes a higher high while the other does not) can indicate waning buying pressure. This inconsistency might suggest that institutional players are beginning to reduce their positions or shift market direction.
A similar principle applies in downtrends: divergence at a fresh low, where one instrument breaks lower while the other doesn’t, could signal that bearish momentum is losing steam. Traders often use these moments to reassess their analysis and consider the possibility of a reversal or pullback within the trend.
Ranging Markets
In a range-bound environment, SMT divergence takes on a different role. Rather than hinting at trend reversals, it often highlights potential breakouts or false moves. For instance, during a consolidation phase, if one correlated instrument makes a sharp move outside the range while the other stays contained, it may signal that the breakout is unsustainable and a reversal back into the range is likely.
Alternatively, if both instruments diverge significantly at the edges of the range, it could suggest that smart money is accumulating or distributing positions in preparation for a breakout.
Different Asset Classes
SMT divergence isn’t limited to one market type. In forex, it often reveals imbalances caused by macroeconomic drivers like central bank policies. In equities, it can signal sector rotation or institutional adjustments. Commodities, particularly oil or gold, may show divergence influenced by supply and demand dynamics.
Limitations and Common Misconceptions
While SMT divergence is a powerful tool for analysing market imbalances, it’s important to understand its limitations and avoid common misconceptions. Misinterpreting divergence can lead to flawed decisions, especially if it’s viewed in isolation or without proper context.
Limitations
- False Signals: Not all divergences indicate institutional activity or meaningful shifts in the market. Low liquidity or erratic price movements can create divergence that doesn’t hold significance.
- Context Dependency: SMT divergence requires a solid understanding of market conditions. Its reliability decreases in highly volatile or choppy environments where correlations break down temporarily.
- Not a Standalone Tool: Relying solely on SMT divergence can be risky. Traders use it alongside other forms of analysis, such as market structure or volume data.
Common Misconceptions
- Always Linked to Institutional Activity: Not every instance of SMT divergence involves smart money. Divergences can also result from retail trading activity or macroeconomic events.
- Predicting Market Direction: SMT divergence doesn’t guarantee outcomes; it highlights imbalances. Further analysis is needed to evaluate whether the market will reverse, continue, or consolidate.
- Universal Applicability: While it works across various markets, not all instruments are equally suitable for SMT divergence due to differences in liquidity or drivers.
Practical Applications of SMT Divergence
SMT divergence is a versatile analytical method that traders use to refine their strategies and deepen their understanding of market dynamics. Here’s how it’s typically applied in practice:
Identifying Market Turning Points
One of the most common uses of SMT divergence is spotting potential reversals. When divergence appears at key highs or lows, it often signals that momentum is shifting. When combined with other common trading tools, such as support and resistance, as well as ICT methodology concepts like order blocks and fair value gaps, this can be used to time entries or adjust risk exposure.
Potentially Enhancing Risk Management
SMT divergence can potentially enhance risk management by offering early warnings about changes in market conditions. If divergence aligns with other factors—such as weakening volume or significant resistance/support levels—it can serve as a signal to tighten stops or reduce position sizes, depending on the trader’s broader approach.
At the same time, it can also provide clear boundaries for setting stop losses. If a trader has confidence that a reversal in one asset is likely due to an SMT divergence, then a stop loss can be placed immediately after the maximum or minimum of the divergence.
The Bottom Line
The SMT divergence is a valuable tool for understanding market imbalances and spotting potential turning points. By combining it with other analysis methods, traders can gain deeper insights into price action.
FAQ
What Does Divergence Mean in Trading?
Divergence in trading refers to a mismatch between the price action of an asset and a technical indicator or between two correlated instruments. It often signals a potential change in trend, as the imbalance suggests a shift in market momentum.
What Is SMT in Trading?
SMT in trading stands for Smart Money Technique. SMT divergence is one of the ICT trading concepts. It focuses on identifying market imbalances that may reflect the activity of institutional traders, seen through divergence between correlated instruments.
What Does SMT Divergence Mean?
The SMT divergence meaning refers to an occasion when two correlated instruments fail to move in sync. One can make a higher high while the other does not or one can make a lower low while the other doesn’t. This indicates potential smart money involvement and signals a possible trend shift.
What Is an Example of SMT Divergence?
A common example is in forex, where EUR/USD forms a higher high, but GBP/USD does not. This divergence could suggest fading bullish momentum, signalling a possible reversal in EUR/USD.
What Is the Strongest Divergence Indicator?
While SMT divergence itself is powerful, traders often combine it with indicators like RSI or volume profiles for added confirmation. The strongest signals come from divergence paired with a broader market context.
*Important: At FXOpen UK, Cryptocurrency trading via CFDs is only available to our Professional clients. They are not available for trading by Retail clients. To find out more information about how this may affect you, please get in touch with our team.
This article represents the opinion of the Companies operating under the FXOpen brand only. It is not to be construed as an offer, solicitation, or recommendation with respect to products and services provided by the Companies operating under the FXOpen brand, nor is it to be considered financial advice.

Examples of invalid setups | Judas Swing Strategy 07/04/2025As traders, it's crucial to spend time in the lab backtesting your strategy and exploring ways to optimize it for better performance in live markets. You’ll start to notice recurring patterns, some that work in your favor, and others that consistently lead to unnecessary losses. It might take time to spot these patterns and even longer to refine them to fit your trading system, but going through this process is what helps you evolve. In the long run, this is what you need to do to become a better trader.
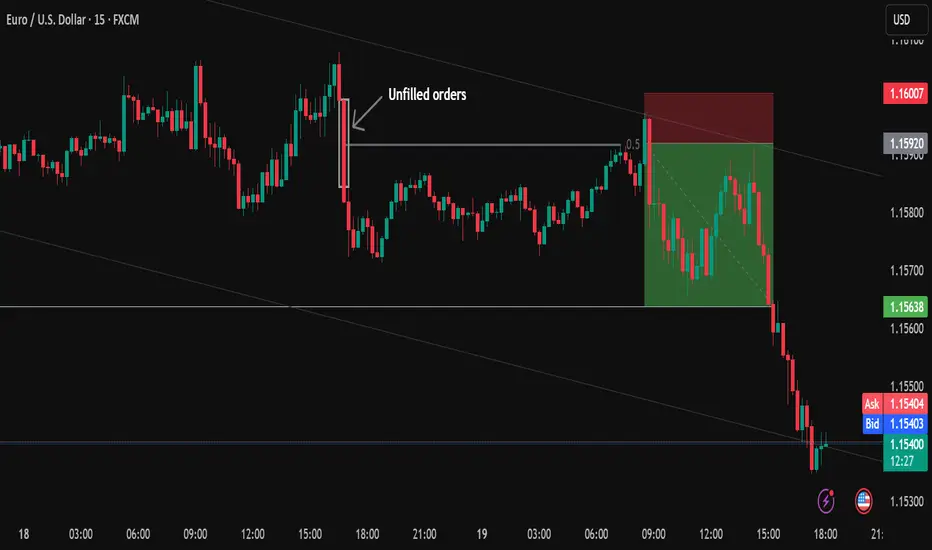
We spent a considerable amount of time refining our entry technique for the Judas Swing strategy after noticing a recurring issue where entering with a limit order sometimes gets us stopped out on the very same candle. After testing a few alternative entry methods and making some key adjustments, we finally found an approach that worked consistently for us. On Monday, April 7th, 2025, this refinement proved its worth by saving us from two potentially painful losses. In this post, we’ll walk you through exactly what happened and how the improved entry made all the difference.
We got to our trading desks ready to scout for setups and were drawn to promising setups forming on both FX:AUDUSD and $NZDUSD. This was exciting since the previous week offered no solid trading opportunities. As price swept the liquidity resting above the highs of the zone our bias quickly shifted toward potential selling setups for the session. But before taking any trade, we always ensure every item on our entry checklist is met. Here’s what we look for:
1. A break of structure to the sell side
2. The formation of a Fair Value Gap (FVG)
3. A retracement into the FVG
4. Entry only after a confirmed candle close
With the first two requirements on our checklist confirmed, all that remained were the final two and at this stage, patience is key. As price began retracing toward the FVG on both FX:AUDUSD and OANDA:NZDUSD , things got interesting. Price came into the Fair Value Gap on both pairs, checking off the third requirement. Now, all that was left was to wait for the current candle to close.
But that’s where things will be clear to you now.
Had we jumped in early with a limit order, we would’ve been stopped out on the same candle. This moment served as a perfect reminder of why we now wait for a confirmed candle close before taking any trade. It’s this extra step that helps us avoid unnecessary losses and stick to high-quality setups.
This entry technique like any other, comes with its own set of pros and cons. At times a limit order might offer a more favorable entry price compared to waiting for a candle close and that can influence both your stop-loss and take-profit placements. On the flip side, there are also instances where waiting for the candle close gives you a better entry than the limit order would have. That’s why it’s so important to backtest.
Your job as a trader is to put in the time to study and test what works best for your system. We chose this candle close entry method because we did the work. After extensive backtesting and data analysis, we found this approach aligns best with the results we aim for in the long run.

Trading EURUSD and NZDUSD | Judas Swing Strategy 17/01/2024Last Friday was an exciting day trading the Judas Swing strategy! We were fortunate to spot two solid opportunities, one on EURUSD and the other on NZDUSD. Both trades presented similar setups, and once they ticked all the boxes on our trading checklist, we didn’t hesitate to execute. In this post, we’ll walk you through the entire process, from setup to outcome and share key insights from these trades.
By 8:25 EST, we were at our trading desk, prepping for the session to kick off at 8:30 EST. During that brief wait, we marked our trading zones and patiently watched for liquidity resting at the highs or lows of the zones to be breached. It didn’t take long, NZDUSD breached its low within 20 minutes, while EURUSD followed suit just 40 minutes into the session. With the liquidity sweep at the lows complete, we quickly shifted our focus to spotting potential buying opportunities for the session ahead.
Even though we had a bullish bias for the session, we never jump into trades blindly. Instead, we wait for confirmation—a break of structure to the upside, accompanied by the formation of a Fair Value Gap (FVG). A retrace into the FVG serves as our signal to enter the trade. On this occasion, both currency pairs we were monitoring met these criteria perfectly. All that remained was for price to retrace into the FVG, setting us up to execute the trade with confidence.
Price retraced into the FVG on both EURUSD and NZDUSD, meeting all our entry requirements. We executed the trades risking 1% on each setup, putting a total of 2% on the line. Our target? A solid 4% return. The setup was clear, the risk was calculated, and we were ready to let the trades play out
After executing the NZDUSD trade, it was pure momentum—zero drawdown as the trade went straight into profit without hesitation. The same was true for EURUSD, which also faced minimal to no drawdown and quickly hit our take-profit target. Both trades wrapped up in just 25 minutes, netting us a solid 4% return. These are the kinds of sniper entries traders dream of!
But let’s be real, trading isn’t always this smooth. There will be times when you face deep drawdowns and even losses. The key is ensuring your strategy wins more often than it loses. And if your losses outweigh your wins, make sure your winners are big enough to cover those losses. Consistency and proper risk management are what keep traders in the game for the long haul

Trading GBPUSD and NZDUSD | Judas Swing Strategy 30-03/01/25The past week offered a subtle reminder that trading isn't always about pushing the buy or sell button. Sometimes, when market conditions are less predictable, it is advisable to sit back and concentrate on tape reading to allow market to reveal its intentions before engaging in trades. During the festive season and approaching the New Year, the market often exhibits erratic behaviour, making trading a bit difficult, and traders are often slaughtered under these conditions. Using the Judas Swing strategy, we scouted for trades during this period to evaluate how the strategy would perform under these conditions.
On Monday, we did not find any trading opportunities on the four currency pairs we were monitoring. Fortunately the next day, we saw a potential trading setup forming on GBPUSD which caught our attention. We saw a sweep of liquidity on the sell side, signalling potential buying opportunities on GBPUSD. This followed a break of structure to the buy side, that price leg also left behind a fair value gap (FVG). With these conditions aligning, all we need is a retrace into the FVG to fulfil the entry requirements on our checklist.
Twenty minutes later, we saw the retracement needed to enter the GBPUSD trade, triggered by the candle that closed within the FVG. We executed the trade with a 1% risk allocation from our trading account, aiming for a 2% return on this setup.
This trade barely showed any profit before hitting our stop loss within twenty five minutes, leaving us down by 1% for the day. Did losing that amount bother us? Not at all. We were fully comfortable with the risk we had allocated for the trade.
Wednesday didn’t present any trading opportunities, but on Thursday, we identified a promising setup on AUDUSD that we were eager to capitalize on. Once the price retraced into the FVG and all the requirements on our checklist were met, we executed the trade, risking 1% of our trading account with the goal of achieving a 2% return
The AUDUSD trade came within a few pips of hitting our take profit (TP) before reversing and going the other way. From our backtest data, we’ve observed that taking partial profits negatively impacts the strategy’s overall performance over time. Instead, allowing trades to play out fully either hitting the stop loss or the take profit has consistently delivered better results in the long run. While reviewing our data, we also noted that it’s not uncommon for trades to come very close to hitting TP, only to reverse and hit the stop loss. Although this doesn’t happen often, it’s a pattern we’ve seen before during our backtesting sessions, so it wasn’t surprising when it occurred here.
Taking a loss like this can be emotionally taxing, especially if you risked more than you could afford to lose or weren’t prepared for such scenarios due to a lack of backtesting. That’s why we can’t stress enough the importance of backtesting—it allows you to observe various scenarios in action and equips you to handle these situations more effectively.
Friday didn’t present any trading opportunities, leaving us down 2% on our trading account for the week. However, we’re okay with this outcome, knowing that one good trade can offset those losses.

Silver Bullet Strategy AUDUSD | 17/12/2024At 9:55 EST, we arrived at our trading desk to scout for trades using silver bullet strategy. We focused on these pairs EURUSD, AUDUSD, GBPUSD, and USDCAD, hoping to get favorable trading conditions during the session.
After 15 minutes, our first FVG formed on GBPUSD, indicating a buying opportunity when price retraces into the FVG on this currency pair. Five minutes later, a similar setup to that which formed on GBPUSD appeared on USDCAD as well indicating that we also look for buying opportunities on this pair when we get a retrace into the FVG. Shortly, a FVG formed on AUDUSD, suggesting a selling opportunity when the price retraces into the newly formed FVG.
Immediately after identifying the FVG on AUDUSD, the next candle entered the FVG fulfilling all the requirements for our entry criteria. We executed the trade and monitored the other pairs to check if any of them met the entry criteria. However, none of them had at that time, so we entered one trade and waited to see others would give us an entry.
We had only 25 minutes to enter the two other setups we observed, otherwise, we would not be able to take those trades due to our trade deadline being at 11:00 EST. We checked USDCAD and realized we got a retrace, but it failed to go lower to give us an entry, so we did nothing. A similar situation was encountered on GBPUSD.
We failed to get an entry on the other pairs, however, the positive aspect was that our trade on AUDUSD was progressing well in our intended direction. After waiting a while, we checked on the position again to assess its performance only to realize it had retraced back to our entry point. An ideal situation? No, but this was the reality, we remained unfazed because we had only risked an amount we were comfortable losing.
The trade consolidated around our entry price for a while, but we were in no rush. We had three options:
1. Trade reaches the take profit
2. The trade hits the stop loss
3. We manually close the trades at 16:00 EST
These are the rules we have on our checklist and we intend to stick by them
This trade neither hit our TP nor SL, so we decided to manually close it at 16:00 EST for a small profit, which we’re perfectly okay with. Remember, simply following your trading rules is a win on its own. Your rules exist for a reason!
