Stop Getting Trapped: How Smart Money Manipulates the MarketWhat's up traders! 👋
Tired of always playing catch-up? The real action is with smart money—the pros who move the market. Learn how to spot their moves, track liquidity, and catch the big waves before they crash. Ready to trade like a pro? Let's dive in.
What is Smart Money?
Smart money refers to the capital controlled by financial institutions, hedge funds, and professional investors who have more information, capital, and resources than individual retail traders. These players drive the market with calculated, informed decisions, creating price movements that less experienced traders often follow without understanding the full context.
Key Components of Smart Money Concept
The Smart Money Concept is not a single indicator or formula. Instead, it’s a framework that helps traders decode the market’s true intention. Here are the key principles that define SMC trading:
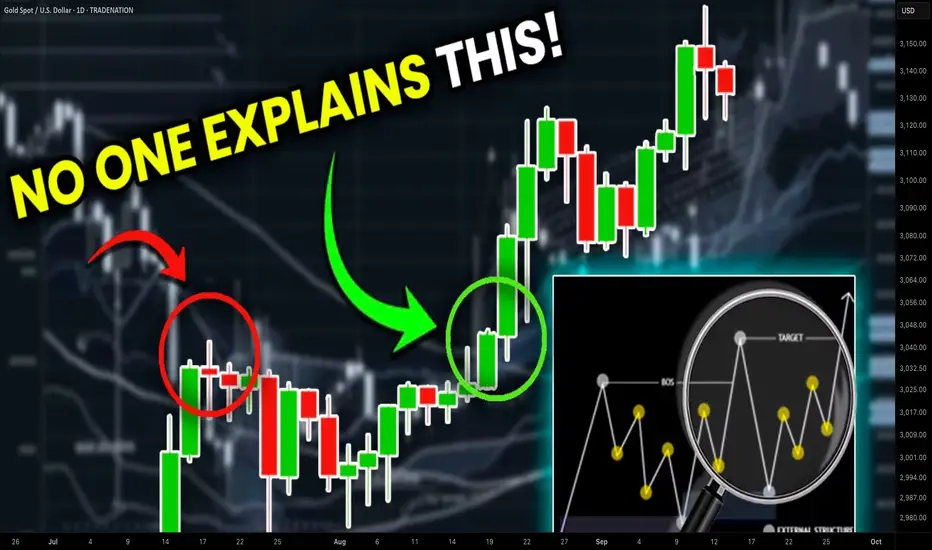
Market Structure
By analyzing patterns such as higher highs and higher lows in uptrends, or lower highs and lower lows in downtrends, traders identify trend direction. A critical concept here is the Break of Structure (BOS), where price breaks through established patterns, indicating a potential trend reversal or continuation.
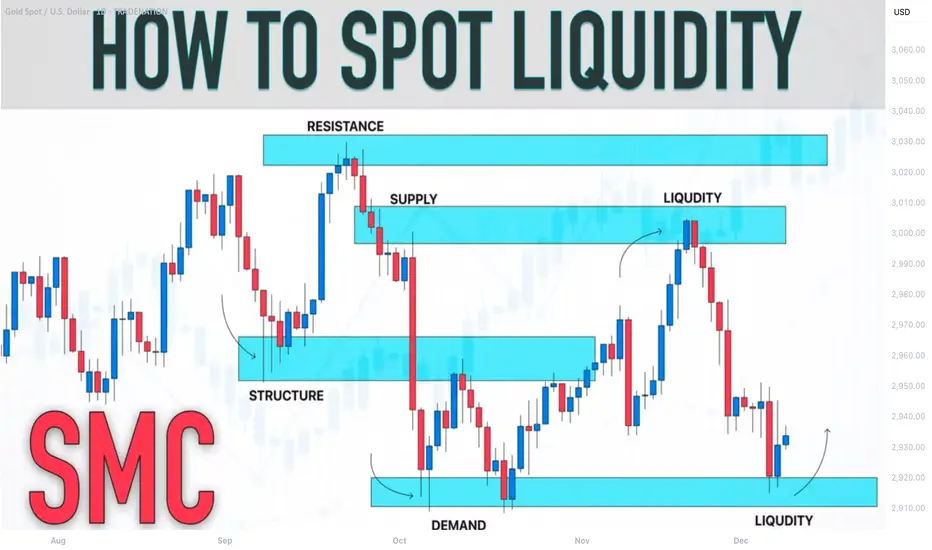
Liquidity Pools and Stop Hunts
Smart money players often seek liquidity pools, typically formed by retail traders' stop-loss orders. These areas are targeted to ensure large transactions can be completed with minimal slippage. Retail traders are often caught off guard when their stop-losses are triggered, allowing institutions to capitalize on this liquidity sweep.
Order Blocks
Order blocks are zones where large institutions have previously placed significant buy or sell orders. These areas often act as support or resistance levels in the future. Recognizing these zones gives traders an edge in predicting where price may react and reverse.
Fair Value Gaps
Fair Value Gaps (FVGs) occur when there is an imbalance between aggressive institutional orders and slower retail participation. These gaps often indicate that price will revisit these areas to fill the void left by unexecuted trades. Smart money traders use these imbalances to plan entries and exits.
How to Trade Smart Money?
The key to trading using the Smart Money Concept lies in understanding where institutional traders are likely to be active and when their movements will influence the broader market. Here’s how to apply SMC principles in practice:
Identify Market Structure: Look for clear trend direction and structural shifts, such as Breaks of Structure (BOS) or Changes of Character (ChoCH).
Spot Liquidity Pools: Identify where retail traders place stop-losses and anticipate institutional activity around these zones.
Look for Order Blocks: Analyze historical price action to locate institutional entry zones.
Monitor Fair Value Gaps: Track price imbalances caused by institutional activity and anticipate price revisits.
While retail traders react to price movement using lagging indicators, smart money traders lead the market. They exploit retail behavior, push price toward liquidity zones, and reverse direction once sufficient liquidity has been collected. This interaction between retail and institutional participants is the core of the Smart Money Concept.
By reading market structure, liquidity zones, and institutional behavior, traders can make more informed decisions and improve their edge. However, always remember — no strategy is foolproof. Apply your own analysis, manage risk carefully, and stay adaptable. The market rewards those who think ahead.
SMC

High Probability Setups: Divergence in Price and VolumePrice defines direction, but volume defines participation. High probability setups emerge when both align. When they separate, conditions change. Divergence between price and volume is one of the clearest tools for assessing whether a move is supported by real commitment or driven by diminishing participation.
In strong market conditions, impulsive price movements are accompanied by stable or increasing volume. This shows that traders are actively committing capital in the direction of the move. Pullbacks during these phases typically show reduced volume, confirming that counter-moves are corrective rather than a shift in control. This alignment between price expansion and volume participation supports continuation.
Divergence forms when price continues to extend while volume contracts. The market is still moving, but fewer participants are involved. This shift indicates that momentum is weakening beneath the surface. The move becomes more fragile, and continuation requires increasingly less resistance to fail. These conditions often develop before structural changes become visible on price alone.
The relevance of divergence increases at key locations. When price reaches major highs or lows, premium or discount zones, or obvious liquidity pools, declining volume signals absorption. Orders are being filled without follow-through. Late participants provide liquidity rather than fuel. This explains why many apparent breakouts stall or reverse shortly after forming.
Volume behaviour also clarifies breakout quality. Breaks that occur with low or declining volume often lack acceptance. Price may move beyond a level, but without participation the market struggles to sustain the new range. When price quickly re-enters the prior structure, divergence explains the failure before structural confirmation appears.
During consolidation phases, volume provides insight into preparation. Falling volume reflects compression and balance. Rising volume within a range reflects active engagement and positioning. Divergence during these phases often precedes resolution, especially when combined with liquidity interaction at range boundaries.
High probability setups form when divergence aligns with location and structure. Volume refines what price presents. It helps identify whether a move is being supported, absorbed, or exhausted. Reading this relationship consistently improves timing, reduces false entries, and keeps execution aligned with real market participation rather than surface-level movement.

"The Myth of Confirmation - What Retail Gets Wrong Every Day"🔥 THE TRUTH ABOUT MARKET “CONFIRMATION” (What Retail Never Realizes)
Most traders think confirmation comes from indicators, patterns, candle shapes, or repeating formations on lower timeframes.
This is the greatest misunderstanding in trading.
Confirmation does NOT come from the LTF.
Confirmation comes from alignment of the delivery cycle — and the LTF only expresses what the HTF already decided.
Retail thinks the 5M “creates” trend.
Institutions know the 5M merely reflects it.
Here’s the real breakdown institutions use:
⸻
1. Confirmation = Completion of a Phase, Not a Pattern
A market only confirms when a structural phase fully completes, meaning:
• Liquidity objective hit
• Internal structure reset
• Order flow aligned
• Efficient price or imbalance corrected
• Pullback cycle finished
• New impulsive leg prepared
This is confirmation.
Not a candle.
Not an indicator.
Not a shape on your chart.
⸻
2. LTF Structure Means NOTHING Without HTF Context
Retail loves reacting to:
• 5M BOS
• 1M pullback
• 15M FVG
• Candle patterns
• Trend lines
None of these matter if the HTF hasn’t finished its development cycle.
This is why traders lose:
They see “confirmation” while the HTF is still in a build-up, not a release phase.
⸻
3. The Market Confirms Twice — Retail Only Sees One
Institutional traders track two confirmations:
Macro Confirmation (HTF)
This tells the market what it wants to do next
— continuation or pullback.
Micro Confirmation (LTF)
This tells the market when it’s safe to execute
— trend shift + pullback + OB tap + displacement.
Retail only waits for micro confirmation.
They skip macro confirmation.
So they trade inside noise.
⸻
4. Candles Don’t Confirm — the Cycle Confirms
People over-read 5M candles, ignoring the fact that candles are only expressions of liquidity movement.
You can’t read intent from shape.
You read intent from position in the cycle.
The same candle means:
• continuation in one phase
• reversal in another
• manipulation in another
Only the cycle gives it meaning.
⸻
5. The Market Doesn’t Confirm For You — It Confirms ITSELF
This is the coldest truth most will never learn:
Price never confirms your bias.
Price only confirms where it is in the timeline.
If you don’t know the timeline,
you don’t know the confirmation.
TL;DR
(Beginner/Simple)
Confirmation = Cycle Completion + Alignment
NOT a candle pattern or indicator.
You don’t follow confirmation.
You follow timing.
My Steps On how To Improve Forex Trading Win / Loss Ratio In this video we talk about the three elements of the new plan that I have designed based on different types of schools and educational sources.
The plan elements consist of SMC (Smart Money Concepts), Classical School (Support & Resistance, Trend Lines, Febonacci Retracement (not all the time)), and the Stochastic Indicator.
The stochastic is of two timeframes, One is weekly and the other is daily but both are shown on the daily timeframe. This is something that I loved here about TradingView; is the ability to show an indicator of a different timeframe.
Last week I opened a couple of positions based on the new plan, but one of them was opened with haste and not totally adhered to my trading Plan rules.
I show the exact trading rules that I am using and how this will affect my risk management plan.

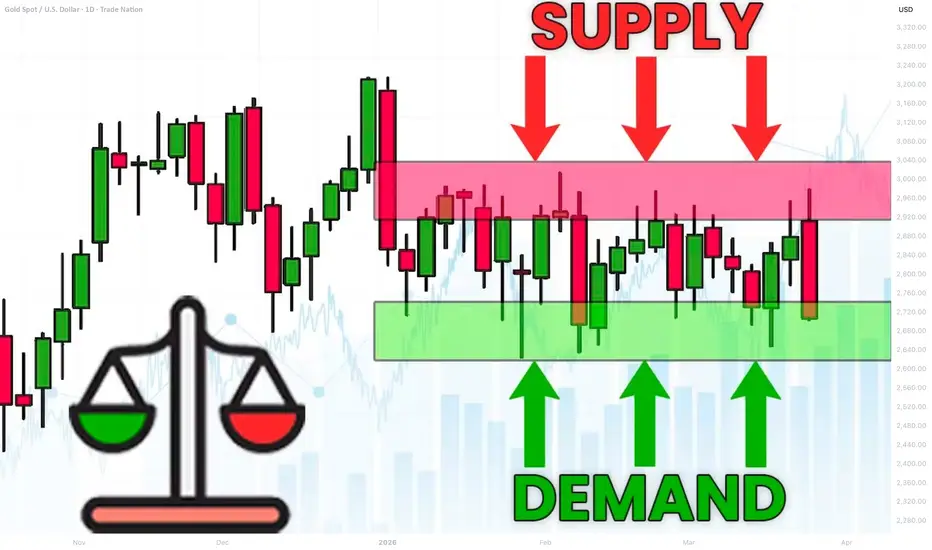
What is Equilibrium in SMC. Balance and Imbalance in Forex Gold
Equilibrium is one of the core elements for understanding market liquidity.
In this article, we will go through the essential basics of liquidity in Forex trading with Smart Money Concepts SMC.
You will learn the interconnections between supply and demand and I will explain how to easily identify balance and imbalance on any market.
Let's start our discussion with understanding how forex pairs move.
The price of an asset goes up if the market demand is stronger than the market supply. The excess of buying activity make the markets update the highs. In smart money concepts, such an event will also be called a buying imbalance.
Look at a strong bullish rally on Gold.
The price is going up because of a buying imbalance.
A strong buying activity creates a massive amount of buyers with unfilled orders.
To entice sellers to start selling, they must offer a higher-better price.
At the same time, if the price of an asset goes down , it means that the market supply is stronger than a demand. The excess of supply will make the markets update the lows. In smc, it will be called a selling imbalance.
That is exactly what is happening with GBPUSD forex pair.
A strong selling activity and the shortage of demand makes the price go down.
The excess of supply or demand on the market can not be eternal.
The lower the price becomes, the more buyers will start buying, and the more sellers will start closing their positions.
At some moment, the surplus of supply will be absorbed by the buyers.
That will be a moment when the market will find equilibrium , the balance between supply and demand.
A strong bearish imbalance on USDJPY made the price drop significantly.
The falling price made 3 things:
It attracted more buyers, because the lower the price the more profitable is buying USDJPY.
It discouraged some buyers from buying, considering that the price is already "too low".
It encouraged some buyers to close their positions in profit.
Because of that, USDJPY stopped falling and found a balance in supply and demand. That is what we call Equilibrium .
In a bull run, the higher the price will go, the more sellers will start selling.
At some moment, buying imbalance will be absorbed by the bears and supply & demand will eventually balance.
Such an event will be called the equilibrium .
EURGBP was rallying strongly.
The higher the price went, the more sellers started to sell, considering selling the pair more and more profitable.
And the same time, fewer buyers were buying and the more started to close their buy positions in profits.
At some moment, the entire excess of the market demand was absorbed by a supply. The market stopped growing and equilibrium was found.
One of the main characteristics of a market equilibrium is sideways price movement and a termination of a formation of new highs or new lows.
Usually, such a sideways price action will form a horizontal range.
That's a real example how a CAD JPY pair found an equilibrium after an extended bearish movement. A formation of a horizontal range confirmed a balance between a supply and a demand.
Please, note that these ranges will form on any time frame that you analyse.
The rule is that the higher is the time frame of the range, the stronger is the market equilibrium.
Above, I have 3 different charts:
USDJPY on a daily time frame, EURJPY on a 4H and GBPUSD on 15 minutes.
All the pairs found an equilibrium in horizontal ranges.
An equilibrium on USDJPY will signify intra week or even intra month balance,
while on EURJPY it will mean intraday/intra week balance.
On GBPUSD, it will signify intraday equilibrium.
Market equilibrium can not last forever.
Fundamentals news and changing market conditions, make the market participants constantly reassess a fair value of an asset.
A violation of the range and a breakout of one of its boundaries will be a trigger of an occurrence of an imbalance .
A bullish violation of the upper boundary of the range will signify a buying imbalance and a highly probable rise to the new highs.
While a bearish violation of the lower boundary of the range will mean a selling imbalance and a highly probable fall to the new lows.
Please, study how GBPCHF was moving for a week on an hourly time frame.
The periods of balance were changed by the periods of bullish or bearish imbalances, that found a new equilibrium on higher/lower price levels.
Understanding of basic principles of supply and demand in trading is essential for profitable trading smart money concepts.
Learn to recognize the periods of imbalance and equilibrium.
It will provide you the edge in understanding and trading any forex pair.
❤️Please, support my work with like, thank you!❤️
I am part of Trade Nation's Influencer program and receive a monthly fee for using their TradingView charts in my analysis.
How to find algorithmic levels of support and resistanceUsing repeating pinpoint levels to form meaning of opens and closes around these levels give you an advantage in your analysis.
As price gives us clues to what levels are affecting price, we should mark the new candles that are responding to these levels by breaking and retesting these very levels.
Please let me know your thoughts! 🙏🏾

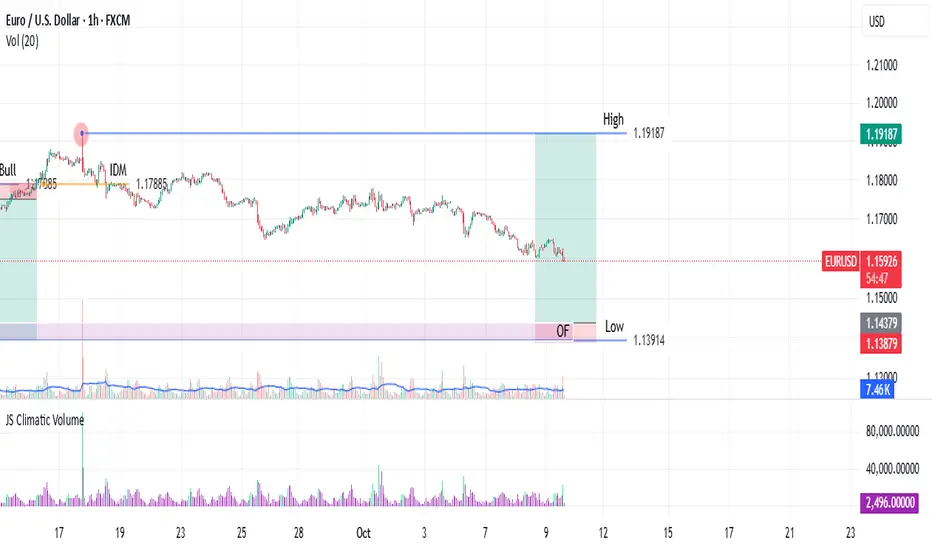
Testing a POI (Point of Interest) & Inducement FrameworkThis script is a visual aid for my personal testing of a systematic trading plan. It is designed to help me manually identify and mark key structural components on the chart. The core concepts I am testing are Trading Ranges, Inducement Levels, and Points of Interest (POI), specifically Order Flows and Order Blocks. (On this chart, an Order Flow)
This is a work in progress and represents my personal learning process. It is not intended as financial advice or a complete trading system.
Key Features I am Testing:
Trading Range Identification: The script helps mark the high and low of a defined trading range, which I identify based on a confirmed break of structure or change of character. In this case what is depicted is a change of character from Bearish to Bullish Sentiment on the EURUSD One-Hour Frame.
Inducement Visualization: It allows for the marking of key inducement levels. In my testing, an inducement is the pullback high (in a bearish move) or low (in a bullish move) immediately preceding the most recent significant low or high. A range is considered valid once its corresponding inducement is traded through.
Order Flow/Block Marking: The tool assists in highlighting potential OFs or OBs. These ranges or candles, located near range extremes, are the Points of Interest I test for potential entries.
My Testing Notes & Disclaimer:
This visual tool is part of my journaling process to build discipline and consistency. I use it to document my hypothesis for each trade setup. The market does not always respect these levels, and a key part of my testing is learning to distinguish between valid and invalid POIs.
My risk management rules are separate and non-negotiable. I always define my stop loss and position size before entering any test trade.
I am sharing this as a documentation of my own testing framework, not as a recommendation.
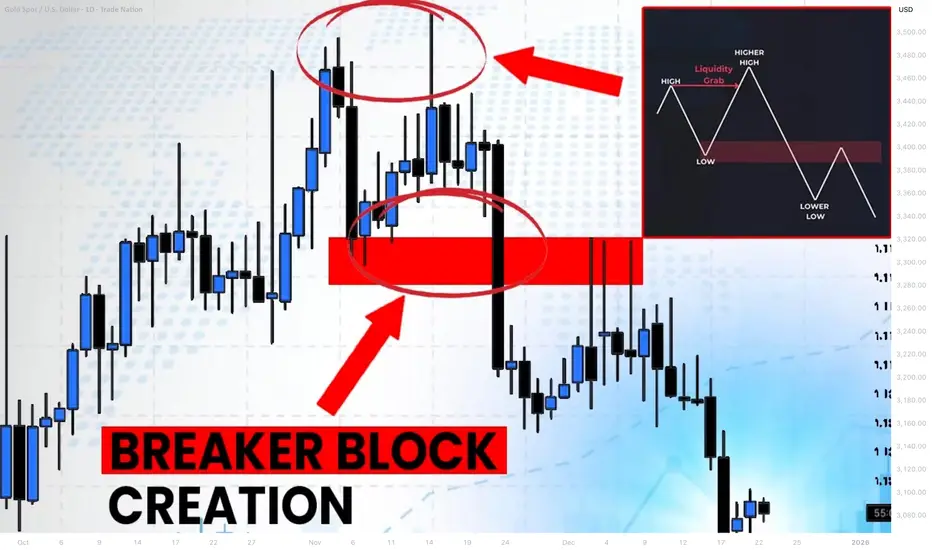
What is Bullish/Bearish Breaker Block & How to Find It Easily
Breaker blocks are easier to find than you think.
In this article, I will share with you very efficient price models for the identification of Order Blocks and Breaker Blocks.
You will learn their meaning, how to draw and use them in trading Smart Money Concepts SMC.
Bullish Trend Model & Breaker Block.
Let's start with an essential theory .
Please, examine a following price model:
In a classic bullish structure where the price consistently updates Higher Highs HH and Higher Lows HH, a bullish order block zone will be the area based on the last Higher How.
I will explain how to draw that zone in the examples below.
In some instances, a bullish order block zone will fail to deliver a bullish wave. Its bearish breakout will follow after its test instead.
It will be a critical event that is called a market structure shift in Smart Money Concepts SMC.
A formation of a new low will signify a violation of a bullish trend and a highly probable change of the market sentiment.
A broken bullish order block zone will turn into a Bearish Breaker Block.
The zone from where the next bearish wave will most likely follow.
It will provide a very safe place to sell from.
Market structure shift in a bullish trend is not a random event.
It usually occurs after a test of a significant supply zone with a liquidity grab.
It can help you to predict the change of the sentiment way before it happens.
That's an example of such a price model on GBPAUD forex pair.
We see a confirmed bullish liquidity sweep in uptrend after a test of a historic supply zone.
A bearish wave followed then and a bullish order block zone was broken.
To draw Order Block Zone, I picked the level of the last higher low as its lower boundary and a low of a body of that candlestick as the upper boundary.
After a breakout, it turned into a Bearish Breaker Block.
A bearish continuation occurred after its test.
Bearish Trend Model & Breaker Block.
Please, check this model:
In a classic bearish structure where the price consistently updates Lower Lows LL and Lower Highs LH, a bearish order block zone will be the area based on the last Lower High.
In some instances, a bearish order block zone will fail to deliver a bearish wave. Its bullish breakout will follow after its test instead.
It will be a significant event that is called a bullish market structure shift in Smart Money Concepts SMC.
A formation of a new high will signify a violation of a bearish trend and a highly probable change of the market sentiment.
A broken bearish order block zone will turn into a Bullish Breaker Block.
The zone from where the next bullish wave will most likely follow.
It will provide a very safe place to buy from.
Market structure shift in a bearish trend is not a random event.
It usually occurs after a test of a significant demand zone with a liquidity grab.
That's a real example of such a price model on WTI Crude Oil.
A bearish structure was violated after a test of a demand zone.
A bearish order block was broken, and it turned into a Bullish Breaker Block Zone then.
(Drawing a bullish order block zone, I picked the level of the last lower high as its upper boundary and a high of a body of that candle as its lower boundary )
A bullish movement followed after a deep test of that.
A proper combination of structure mapping and liquidity analysis will help you to predict a market structure shirt and a breaker block creation before they happen.
The models that I shared will help you to confirm bullish and bearish breaker blocks trading Forex or any other markets with Smart Money Concepts SMC ICT.
❤️Please, support my work with like, thank you!❤️
I am part of Trade Nation's Influencer program and receive a monthly fee for using their TradingView charts in my analysis.
Building a Trading Plan: The 2nd StepMy trading journey has been defined by a search for consistency. For years, I operated under the belief that a trading plan was a strict list of entry and exit rules. I would follow these rules, yet my results remained unpredictable. The turning point came when I began to understand what is a successful Forex trading plan is. Surely, it is not a rigid document, but a dynamic decision-making system.
The first component of this system is identifying the trading range. This foundational step seems simple, but I learned that its execution is critical. The range establishes the market's current context. It defines the battle between buyers and sellers, creating a clear framework for all subsequent analysis. Without accurately identifying this zone, every decision that follows is built on an unstable foundation. I spend a significant portion of my analysis time confirming these boundaries, knowing that everything else depends on it.
The second component, and the one that brought the entire process into focus for me, is the concept of inducement. In the methodology I am testing, inducement represents a key liquidity area. It is a level where the market is likely to see significant activity from larger participants. Learning to identify these zones clarifies both ends of the trading range. It was no longer just a box on a chart; it became a map with highlighted areas of strategic importance.
This understanding created a powerful filter. It helped me distinguish between a simple break of a level and a meaningful move targeting a specific liquidity pool. My plan specifically focuses on what is classified as a major inducement, which allows me to ignore the minor. This step directly addressed the inconsistency in my earlier trading, as it provided a logical reason for price action beyond basic support and resistance.
Perhaps the most important lesson has been the dynamic nature of a true trading plan. The market is not static, and neither can a Forex trading plan be. I recall a specific backtesting session analyzing the GBPUSD pair on the 15 Minute time frame where a clear change of character occurred. The price action broke a previously defined range. A clear rule shows the difference between a break of strucutre and change of character. Now, I just need to redefine the new trading range with the help of the inducement level. As simple as that.
This proves that a plan’s value is not in preventing change, but in providing a structured method to adapt to it. The plan I am building is a living system. It guides me not only on when to enter a trade but, just as crucially, on when to stand aside and reassess the market structure. This ongoing process of learning and adaptation is, for me, the true essence of what a Forex trading plan must be.

Order Blocks: Where Smart Money Leaves Its Footprints“The market doesn’t move randomly.
Every big push leaves a shadow — a clue of who was in control.”
That clue is what traders call an Order Block .
What is an Order Block?
An Order Block (OB) is the last bullish or bearish candle before a strong impulsive move in the opposite direction.
Think of it as the area where institutions placed their orders to fuel that move.
In an uptrend , look for the last down candle before a strong rally.
In a downtrend , look for the last up candle before a sharp drop.
These zones often act like magnets — price revisits them to “retest” before continuing.
Why Do Order Blocks Matter?
They reveal where the big money entered.
They create high-probability zones for entries.
They help traders avoid chasing moves at highs or lows.
How to Spot an Order Block
Identify a strong impulsive move (long-bodied candles, clear displacement).
Mark the last opposite candle before that move.
Wait for price to return to that zone.
Look for LTF confirmation — a ChoCH, BOS, or rejection wick.
Align with higher timeframe bias (H4/H1) for best results.
Example
Refer to the XAUUSD M15 chart above:
Gold formed a strong bullish rally, leaving behind a bullish order block zone at 3764.5 – 3757.5 .
When price retraced into this OB, it tapped liquidity from the stop area, then gave LTF confirmation (micro structure shift).
This long setup delivered an impressive 1:8 RR rally for disciplined traders who waited for the OB mitigation and entry confirmation.
Smart money doesn’t chase price — it waits for the market to come back home.
But here’s the secret most traders miss:
Order blocks alone are never the full story.
They work best when combined with liquidity sweeps, structure shifts, and precise timing .
That’s where the deeper edge lies — and it’s what separates surface-level knowledge from mastery.
📘 Shared by @ChartIsMirror

Profitable Multiple Time Frames Smart Money Strategy For Trading
In this post, I will share with you a very accurate and profitable SMC Smart Money trading strategy that combines top-down analysis, liquidity, imbalance, order block and inducement.
Step 1 - Identify liquidity zones on a daily
Liquidity zones are the areas on a price chart, where big players are placing their orders. From such areas, significant bullish and bearish movements initiate.
Liquidity zones that are above the current price will be the supply zones, while the liquidity zones that are below the current price will be the demand zones.
We will look for shorting opportunities from supply areas and for buying opportunities from demand zones.
Here are the liquidity zones that I identified on EURJPY.
Step 2 - Wait for a test of one of the liquidity zones
Let the market test the liquidity zone.
For buying, the price should reach a lower boundary of a demand zone.
For shorting, the price should test an upper boundary of a supply zone.
I underlined the exact levels that the price should test on EURJPY.
Here is the test of the lower boundary of the demand zone.
Step 3 - Look for inducement on an hourly time frame
With the inducement, smart money make the market participants think that the liquidity zone that the price is testing doesn't hold anymore.
When the price tests a supply area, an hourly candle close above its upper boundary will be a bullish inducement.
With that, the smart money incentivize buying orders.
When the price tests a demand area, an hourly candle close below its lower boundary will be a bearish inducement.
With that, the smart money incentivize selling orders.
The price closed below a lower boundary of a demand zone on EURJPY on 1H time frame.
Step 4 - Look for imbalance on an hourly time frame
After a violation of a supply area on an hourly time frame, look for a bearish imbalance.
Bearish imbalance is a strong bearish candle with wide range and big body. With that candle, the market should return within a supply zone and closed within or below that.
After a violation of a demand area on an hourly time frame, look for a bullish imbalance.
Bullish imbalance is a strong bullish candle with wide range and big body. With that candle, the market should return within a demand zone and closed within or above that.
Here is the example of a bullish imbalance on EURJPY.
After a bearish inducement, the price formed a high momentum bullish candle and closed within the demand zone.
The imbalance signify that a liquidity zone violation was a trap .
With that, smart money simply was trying to grab the liquidity.
That will be a signal for you to open an order.
Step 5 - Look for an order block
After the formation of the imbalance, the market becomes locally week and quite often corrects to an order block.
Order block will be the closest hourly liquidity zone.
After a formation of a bearish imbalance, look for a supply zone on an hourly time frame. That will be your perfect zone to sell .
After a formation of a bullish imbalance, look for a demand zone on an hourly. That will be your area to buy from.
Here is the order block on EURJPY.
Step 6 - Set a limit order
Set a sell limit order within a supply area after a formation of bearish imbalance on an hourly time frame.
Set a buy limit order within a demand area after a formation of a bullish imbalance on an hourly.
Here is your buy entry level on EURJPY.
Step 7 - Select the target
If you sell, your target should be the closest daily structure support: horizontal or vertical one.
If you buy, your target should be the closest daily structure resistance: horizontal or vertical one.
In our example, our closest structure resistance if a falling trend line.
Step 8 - Set stop loss
If you sell, stop loss will lie above a bullish inducement.
If you buy, stop loss will lie below a bearish inducement.
Here is a perfect point for a stop loss for a long trade on EURJPY.
Step 9 - Trade
Let the price trigger your entry, and then be prepared to wait.
It took many days for EURJPY to reach the target.
Trading Tips:
1. Make sure that you have a positive reward/ratio. It should be at least 1.2
2. Risk no more that 1% of your trading account per trade
Being applied properly, that strategy shows 70%+ accuracy.
Try it by yourself and let me know your results.
❤️Please, support my work with like, thank you!❤️
I am part of Trade Nation's Influencer program and receive a monthly fee for using their TradingView charts in my analysis.
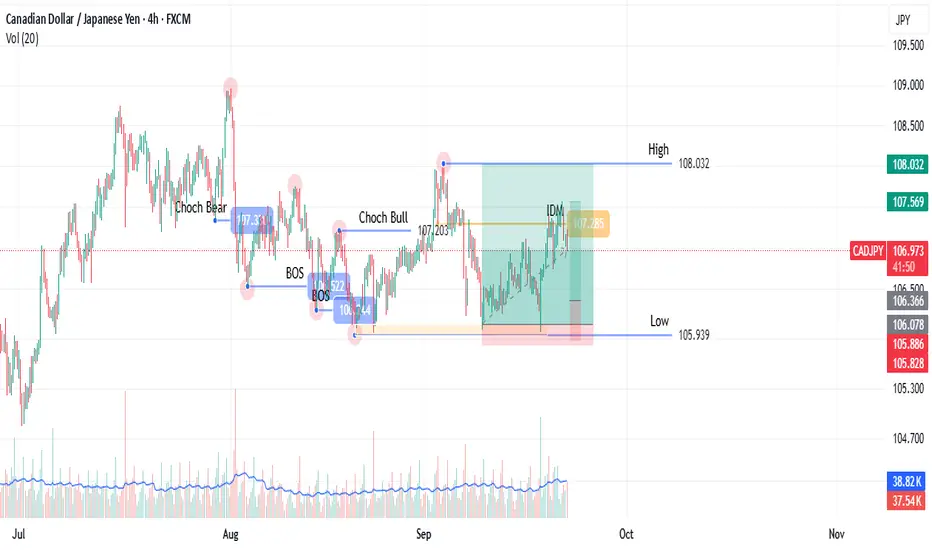
SMC Concept: Defining the Trading Range (Step 1) On CADJPYCAD/JPY, 4H Timeframe (as demonstrated)
This post outlines the first step in a methodology focused on identifying key market structure levels. The goal is to objectively define a trading range, using CAD/JPY as the example.
The Process: Of a bullish Structure
Identify the range Low: Locate the last retracement from the previous high, the low is deepest price level retraced to.
Find the Inducement: Mark the low of the most recent pullback (retracement) before the price made a new high.
Wait for Confirmation: The high is only confirmed once price returns to hit this inducement level. This validates the high as an official range boundary.
A break of the confirmed high is a break of structure (BOS). A break of the confirmed low suggests a change of character (CHoCH), shifting sentiment.
This is the foundational step for identifying future points of interest. The next step involves plotting POIs based on this confirmed range.
This methodology is based on one that I learned from someone else on Youtube, but I have changed many details to suit my style. As a thank you note, I have referred to this person on other paltforms, but unfortunately, I don't think I can do this here as I might be violating this platform's rules.
I will be posting the next steps that would lead to deciding on a trading position on step by step basis.
I am already making videos but I might be using this platforms video option for later posts.
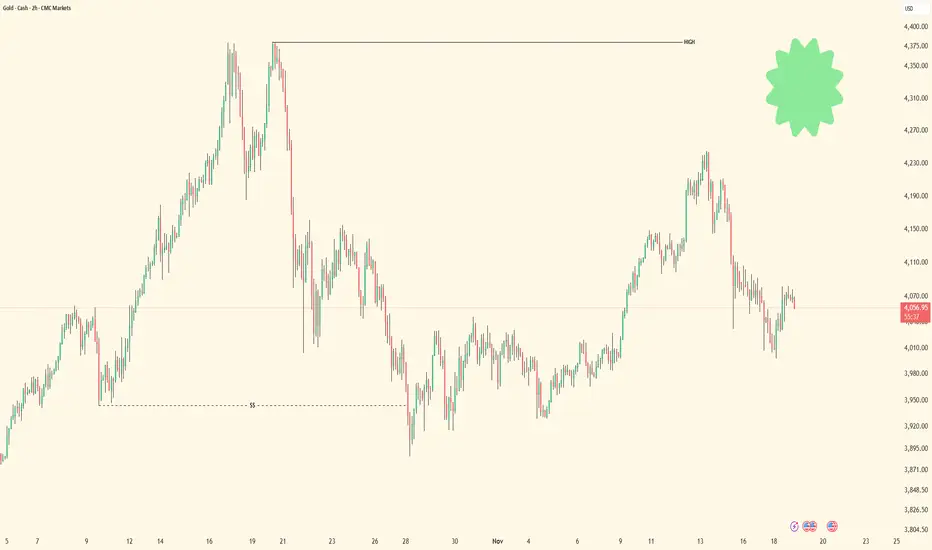
Review of Gold's expected rally and why we entered long todayLook at this chart and understand why it was the only move that was likely to happen today:
Firstly we already corrected all of the range down (balanced), that was the first key that we're potentially going to correct the drop next.
This is how markets work; correction of imbalances and continuations of the master trend direction.
The master/macro trend target is always the easiest no brain target for those of us who actually make money trading. Anytime we correct imbalances, we are looking to buy, only degenerates are looking for the short target and never realize where it is or when it's been hit--hello? It's the imbalanced ranges below, write this down:
When we are bullish, price will only go down to correct the major imbalanced ranges and then continue bullish.
There is no supply zone until the large wick range.
I will help you understand this stuff tirelessly even for free although I charge a $100/mo mentorship I don't care if people pay me, I just want you to see the easy truths about the chart most don't see 🫡

Sniper Entries Made Simple: The Power of Confirmation“Smart traders don’t predict.
They wait for the market to confirm their idea — then act.”
Finding a mitigation zone is only half the job.
Confirmation is what separates professional patience from random guessing.
It’s the step that keeps you from catching a falling knife or buying too soon.
Why Confirmation Matters
Jumping in blindly at the zone can work sometimes — but most of the time, it’s a gamble.
Confirmation gives you:
Higher probability setups (not every zone holds)
Tighter entries (better RR)
Fewer unnecessary stop-outs
The Confirmation Playbook
Here’s a simple process you can use.
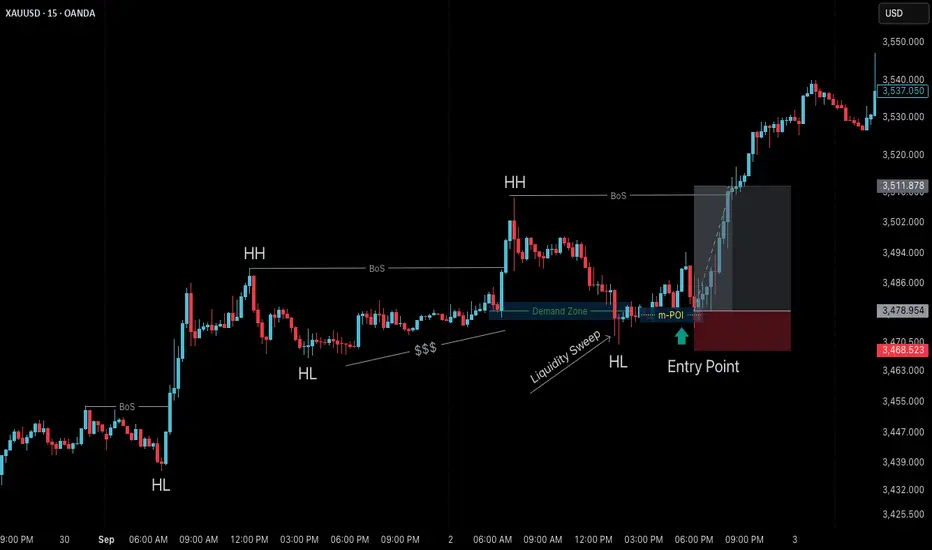
Refer to the Gold M15 Bullish Chart (Sep 2, 2025) above — it shows this process step by step.
Step 1: Mark the Zone
Identify your mitigation block or demand zone after a BoS.
Step 2: Wait for Price to Tap
Be patient — let price react at this zone.
Step 3: Look for a Sweep
Notice how price often sweeps liquidity below the zone first — this fuels the reversal.
Step 4: Drop to Lower Timeframe (M1 or M5)
Watch for micro-structure shift in your favor:
micro-ChoCH
micro-BoS
Strong rejection wicks or engulfing candles
Step 5: Enter with Tight Risk
Take the trade after confirmation and set SL just beyond the sweep.
This gives you a small stop with a high RR potential.
Live Example (Gold)
In the XAUUSD bullish M15 chart above, you can see:
BoS creates a demand zone
Price returns and sweeps liquidity below demand zone
On lower timeframe, we get micro-ChoCH → micro-BoS confirmation
Entry is taken at micro-POI with tight SL, catching the next impulsive leg
Notice how confirmation turned a risky breakout buy into a sniper entry with a clean risk-reward profile.
📘 Shared by @ChartIsMirror
Do you already use confirmation techniques like ChoCH + BoS, or do you prefer instant entries at zones?
Share your experience in the comments — what’s your go-to trigger?
Master TradingView Like a Pro – Tools, Alerts, and Hidden Gems!Are you really using everything TradingView has to offer?
In this video, I’m breaking down 8 powerful features inside TradingView that most traders don’t fully use — even though they can save time, improve your analysis, and help you catch better setups.
Here’s what I’ll walk you through step by step:
✅ How I use Drawing Tools to map market structure
✅ Why I rarely use indicators — but why you should still know them
✅ How to scan markets fast using the Screener & Heatmap
✅ The right way to use the Economic Calendar and avoid news traps
✅ The feature I use daily: Price Alerts (a total game changer)
✅ How to practice with zero risk using Paper Trading
✅ Using Multi-Chart Layouts to watch multiple timeframes
✅ And finally — how the TradingView Community helped me grow and connect
Whether you're just getting started or already experienced — this video is packed with value.
Watch it till the end, and if you find it helpful — like, comment, and share it to support my work!
Best, Arman Shaban

SMC Trading Basics. Liquidity Zones & How to Identify Them
In the today's article, I will teach you the concept of liquidity zones and how to identify them properly, trading Forex, Gold, Crypto and Indexes.
Simply put, a liquidity zone is a certain area on a price chart where a significant concentration of trading volumes occurred.
Huge trading volumes signify the presence of big players: hedge funds, banks, etc...
Correct identification of liquidity zones is essential for smart money trading, because such zones provide the safest and the most profitable trading opportunities.
There are 3 common characteristics of a valid liquidity zone:
1. Huge volume spikes upon its test
Take a look at the underlined blue area on USDCAD.
We see sharp volume spikes when the market was testing that area.
2. Strong rejections from such an area with a formation of long wicks
Look how the price reacts to the liquidity zone on USDJPY.
We see multiple strong rejections from that.
3. Long consolidation within that zone
Bitcoin was "standing" on a liquidity zone for more than 3 weeks, barely moving while trading volumes were quietly accumulating.
4. Multiple strong bullish or bearish reactions to that area
Just look how many times the underlined area was respected by the buyers and by the sellers. That is a perfect example of a liquidity zone.
To underline a liquidity zone properly, follow these simple rules:
1. If the price is ABOVE the liquidity zone, its lower boundary
will be the lowest wick within that area and its upper boundary will be the lowest candle close. Such a liquidity zone will be called a demand area.
Here is the example of drawing a liquidity zone on GBPUSD.
The lower boundary of the zone is the lowest wick, while its upper boundary is the lowest candle close.
2. If the price is BELOW the liquidity zone, its upper boundary will be the highest wick within that area and its lower boundary will be the highest candle close. Such a liquidity zone will be called a supply area.
Here is the liquidity zone that I identified on Gold following our rules.
Remember, that you can identify liquidity zones on any time frame. However, the rule is that the higher is the time frame, the stronger is the liquidity zone.
I prefer to analyze the liquidity zones on a daily time frame.
Once you underlined liquidity zones, you should realize that within these areas, big players are expected to place their orders in the future.
For that reason, after the tests of such areas, a strong bullish or bearish movements will be expected.
Here is a huge liquidity zone that I spotted on GBPJPY.
Look at a strong bearish movement that initiated after its test.
Your task as a smart money trader will be to identify bullish or bearish confirmations and understand the intentions of big players. With experience, you will learn to recognize valid signals.
❤️Please, support my work with like, thank you!❤️
I am part of Trade Nation's Influencer program and receive a monthly fee for using their TradingView charts in my analysis.
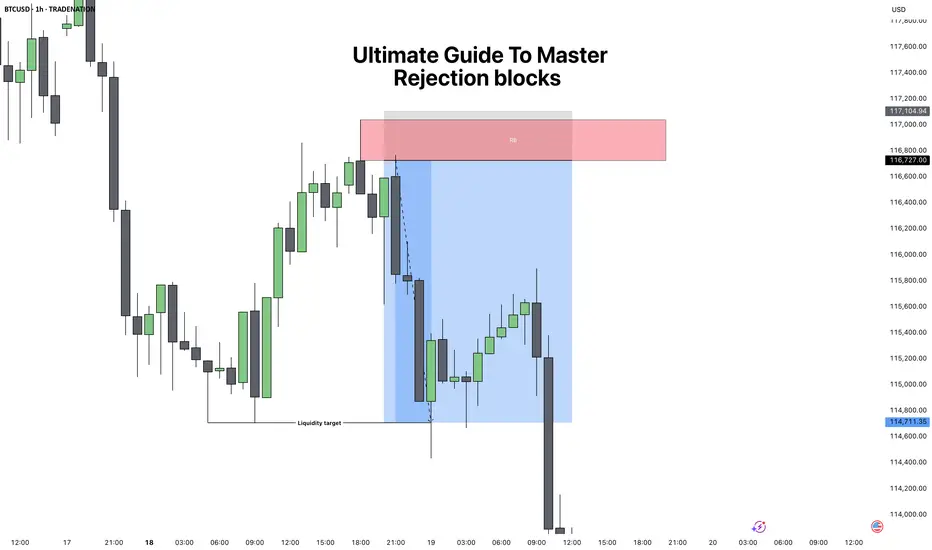
Ultimate Guide to Master: Rejection BlocksRejection Blocks (ICT Concept) – Complete Guide
1. What is a Rejection Block?
A rejection block is a special type of price level that forms when the market attempts to push through but gets denied and reverses. Unlike a traditional order block, which represents accumulation or distribution by institutions, a rejection block shows a failed attempt to continue in one direction. It is a footprint of rejection and often becomes a strong reaction zone in the future.
There are two types:
Bullish Rejection Block:
Forms from a bearish candle whose low is taken out, but price fails to continue lower and closes back above. The low of that candle becomes the key level.
Bearish Rejection Block:
Forms from a bullish candle whose high is breached, but price fails to continue higher and closes back inside. The high of that candle becomes the key level.
These levels can act as hidden support or resistance and often serve as high-probability entry points when combined with market structure.
2. How to Spot a Valid Rejection Block
To correctly identify rejection blocks, you need to look for:
1. Clear Attempt Beyond a Candle
Price must trade beyond the high or low of a prior candle, suggesting continuation.
2. Failure and Return
After breaching the level, price fails and closes back inside the candle’s body.
3. Liquidity Context
A rejection block is more powerful if the wick that caused it swept liquidity (equal highs/lows or a previous key level).
4. Higher Timeframe Confluence
The best rejection blocks line up with higher timeframe bias (for example, spotting a bearish rejection block inside a 4H premium zone during a downtrend).
3. How to Trade Rejection Blocks
Trading them involves waiting for price to come back to the rejection block level and using it as an entry or reaction zone.
Bullish Setup:
When price trades below a bearish candle, fails, and closes higher, mark the low of that candle. On a retracement, price often retests that level as support.
Bearish Setup:
When price trades above a bullish candle, fails, and closes lower, mark the high of that candle. On a retracement, price often retests that level as resistance.
Entry Technique:
You can enter "blindly" when you're understanding the confluences. But to begin with do this Instead, when price returns to the rejection block, drop to a lower timeframe and look for confirmation such as:
* Fair Value Gap (FVG) entries.
* Market Structure Shift (MSS).
* Liquidity sweeps into the level.
Stop Loss Placement:
Always place stops beyond the rejection candle itself (above the high for bearish RB, below the low for bullish RB).
4. Practical Examples and Market Context
Rejection blocks work best when they appear in the following situations:
Liquidity Sweeps:
After equal highs or equal lows are taken out, a rejection block often marks the failure point.
Inside Premium/Discount Zones:
In a bearish bias, look for bearish RBs in premium pricing. In a bullish bias, look for bullish RBs in discount pricing.
During Consolidation Breakouts:
If the market fakes a breakout and closes back inside, the rejection block often becomes the level to fade the fake move.
For example, if BTC takes out a prior daily high, prints a rejection block, and then closes back inside, the odds of reversal are high, especially if price was already in premium territory.
5. Combining Rejection Blocks with ICT Concepts
To increase accuracy, always combine RBs with ICT’s other tools:
Fair Value Gaps:
If a rejection block aligns with an FVG, it adds strength to the level.
Market Structure Shifts:
A rejection block is more powerful if followed by displacement and an MSS.
CISD Pattern:
A rejection block often forms right after the “Stop Hunt” part of the CISD sequence, serving as a clean entry.
Liquidity Pools:
Look for RBs near equal highs/lows, old highs/lows, or session liquidity (London/New York).
Conclusion
Rejection blocks are subtle but highly effective levels that show where the market tried to extend but failed, leaving behind a hidden form of support or resistance. By themselves they are useful, but when combined with ICT concepts like liquidity sweeps, MSS, and FVGs, they become powerful entry tools. The key is to always wait for price to return and confirm the level before entering, and to only trade them in alignment with higher timeframe bias.
Disclosure: I am part of Trade Nation's Influencer program and receive a monthly fee for using their TradingView charts in my analysis.
___________________________________
Thanks for your support!
If you found this idea helpful or learned something new, drop a like 👍 and leave a comment, I’d love to hear your thoughts! 🚀
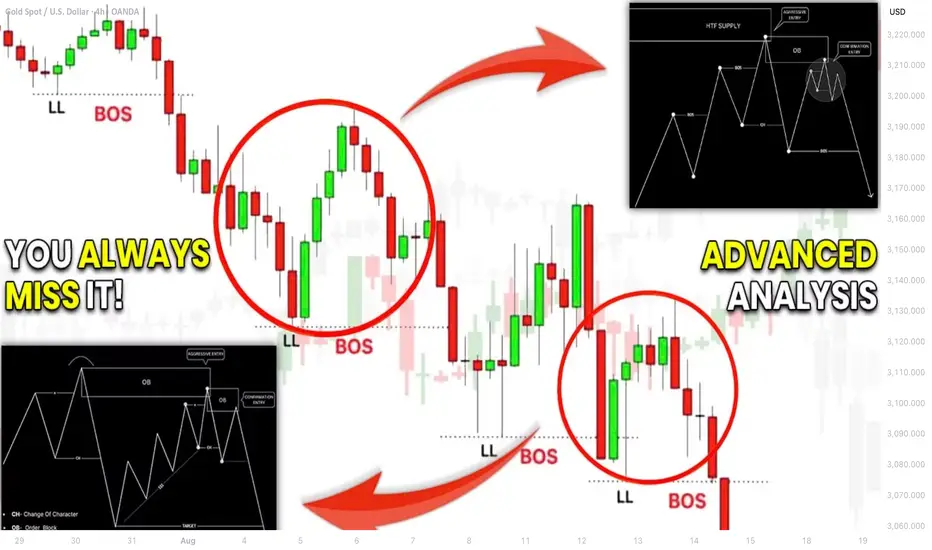
Break of Structure VS Liquidity Grab. How to Identify Valid BoS
The main problem with break of structure trading is that you can easily confuse that with a liquidity grab.
But don't worry.
There is a secret SMC price model that will help you to confirm a break of structure in a second.
Learn smart money concepts trading secrets and a simple strategy to trade break of structure on any forex pair.
Let's study a break of structure that I spotted on AUDUSD forex pair.
We see that the market is bullish on a daily time frame and the price has just violated a previous high with a break of structure.
The issue with that is the fact that such a violation can easily be a liquidity grab and a bullish trap .
Buying the market immediately after a BoS, we can incur a huge loss .
We need something that would help us to accurate validate that.
Fortunately, there is a simple price model in SMC that will help.
After you spotted a break of structure on a daily time frame,
use a 4h time frame for its validation.
After a BoS on a daily time frame, the market usually starts retracing , setting a new local high.
To confirm that it is not a trap, you will need a break of THAT structure on a 4H time frame.
It will increase the probabilities that the entire bullish movement that you see on a daily is not a manipulation.
Here is what exactly we need.
After the price violated a daily structure and closed above that, we see a minor intraday retracement on a 4h time frame.
A bullish violation of the last high there is our BoS confirmation and a clear indicator of the strength of the buyers.
You can execute a buy trade, following a simple strategy then.
Set a buy limit order on a retest of a broken high on a 4H,
a stop loss should be below the last higher low,
a take profit is based on the next supply zone on a daily.
To avoid the traps, a single time frame is not enough for profitable trading break of structure.
Learn to integrate multiple time frames in smart money concepts trading. It will help you make thousands of pips weekly.
❤️Please, support my work with like, thank you!❤️
I am part of Trade Nation's Influencer program and receive a monthly fee for using their TradingView charts in my analysis.
How to Do Structure Mapping with Multiple Time Frames Analysis
If you think that structure mapping is not efficient for profitable trading, you get it wrong .
What newbies traders always miss is that structure mapping works effectively only with multiple time frame analysis.
In this article, I will show you how you can build profitable trading plans and accurate predictions on forex market with structure mapping alone.
Learn top-down analysis secrets and how to map structure properly in Smart Money Concepts SMC ICT.
In order to effectively use structure mapping for scalping, day trading and swing trading , always start it from higher time frames.
Examine my complete structure mapping on USDJPY forex pair on a daily time frame.
You can see that first, the pair was trading in a strong bearish trend.
Then, we had a confirmed bullish reversal with Change of Character.
After that, the market started an extended consolidating movement, not being able to update the highs.
And finally, the last bullish wave managed to update a high , confirming a completion of a consolidation and a resumption of a bullish trend.
Structure mapping reveals that USDJPY is now bullish on a daily and the last bearish movement is a correction in uptrend.
We can expect a start of a new bullish wave soon.
To understand when exactly it is going to happen, you will need to dive your analysis deeper .
You should start structure mapping on lower time frames.
And you should execute a price action analysis there in relation to your structure mapping on a higher time frame.
4H time frame structure mapping will reveal a price action within the last bearish move that we spotted on a daily.
We see that the market is trading in a bearish trend and the price started a local correctional movement after a formation of the last low.
4h time frame structure mapping provided a detailed intra week perspective.
Hourly time frame analysis, we reveal hidden intraday trends that will unveil more insights.
And why are we doing all that?
Remember that big waves always start from minor reversals.
The earlier you are able to find strong confirmations, the earlier you will open a trading position and the more profits you will make.
On an hourly time frame, our structure mapping shows that the market is already bullish. A bearish trend that USDJPY followed is already violated, and the price is updating the highs.
Following our analysis, the only thing that we need to confirm a start of a bullish trend is a confirmed trend reversal and a change of character on a 4H time frame.
It will validate an intra week bullish trend.
We will need the price to break the underlined blue resistance based on the last lower high in a bearish trend.
That will provide an accurate signal for us to buy.
And we can anticipate a rise a least to a current daily higher high then.
When you do structure mapping on forex market, never forget to do that on multiple time frames. Multiple perspectives and short-term/mid-term/long-term projections will help you to build a more efficient trading plan.
Remember that you can expand your structure mapping even for minute time frames. It will provide a unique perspective for scalping forex.
❤️Please, support my work with like, thank you!❤️
Market Manipulations. Bullish Trap (Smart Money Concepts SMC)
In the today's article, we will discuss how smart money manipulate the market with a bullish trap .
In simple words, a bullish trap is a FALSE bullish signal created by big players.
With a bullish trap, the smart money aims to:
1️⃣ Increase demand for an asset, encouraging the market participant to buy it.
2️⃣ Make sellers close their positions in a loss .
When a short position is closed, it is automatically BOUGHT by the market.
Take a look at a key horizontal resistance on AUDCHF.
Many times in the past, the market dropped from that.
For sellers, it is a perfect area to short from.
Bullish violation of the underlined zone make sellers close their position in a loss and attracts buyers.
Then the market suddenly starts falling heavily, revealing the presence of smart money.
Both the sellers and the buyers lose their money because of the manipulation.
There are 2 main reasons why the smart money manipulates the markets in a such a way:
1️⃣ - A big player is seeking to close a huge long position
When a long position is closed, it is automatically SOLD to the market.
In order to sell a huge position, smart money needs a counterpart who will buy their position.
Triggering stop losses of sellers and creating a false demand, smart money sell their position partially to the crowd.
2️⃣ - A big player wants to open a huge short position
But why the smart money can't just close their long position or open short without a manipulation?
A big sell order placed by the institutional trader, closing their long position, can have an impact on the price of the asset. If the sell order is large enough, it can push the price downward as sellers outnumber buyers. Smart money are trying to balance the supply and demand on the market, hiding their presence.
It is quite complicated for the newbies and even for experienced traders to recognize a bullish trap.
One of the efficient ways is to apply multiple time frame analysis and price action.
Remember, that most of the time bullish traps occur on key horizontal or vertical resistances.
After you see a breakout, analyze lower time frames.
Quite often, after a breakout, the market starts ranging .
After a breakout of a key daily resistance, gold started to consolidate within a narrow range on an hourly time frame.
Bearish breakout of the support of the range will indicate a strength of the sellers and a highly probable bullish trap.
Remember, that you can not spot all the traps, and occasionally you will be fooled by smart money. However, with experience, you will learn to recognize common bullish traps.
❤️Please, support my work with like, thank you!❤️
I am part of Trade Nation's Influencer program and receive a monthly fee for using their TradingView charts in my analysis.

Accurate Price Model for Trading Smart Money Concepts SMC (=
If you trade Smart Money Concepts SMC, there is one single pattern that you should learn to identify.
In this article, you will learn an accurate price model that you can use to predict a strong bullish or bearish movement way before it happens.
Read carefully and discover how to track the silent actions of smart money on any market.
The only thing that you need to learn to easily find this pattern is basic Structure Mapping . After you map significant highs and lows, you will quickly recognize it.
This SMC pattern has 2 models: bullish and bearish ones.
Let's start with a bearish setup first.
Examine a structure of this pattern
it should be based on 2 important elements.
The price should set a sequence of equal lows.
These equal lows will compose a demand zone.
The area where a buying interest will concentrate.
The minimum number of equal lows and lowers highs should be 2 to make a model valid.
Exhausting of bullish moves will signify a loss of confidence in a demand zone . Less and less market participants will open buy positions from that.
At some moment, a demand zone will stop holding. Its bearish breakout will provide a strong bearish signal , and a bearish continuation will most likely follow.
This price model will signify a market manipulation by Smart Money.
They will not intentionally let the price fall, not letting it break a demand zone. A buying interest that will arise consequently will be used as a source of liquidity.
Smart money will grab liquidity of the buyers, silently accumulating huge volumes of selling orders.
Once they get enough of that, a bearish rally will start, with a demand zone breakout as a trigger.
Though, the chart model that I shared above has a strong bullish impulse, preceding its formation, remember that it is not mandatory.
The price may also form a bearish impulse first and for a pattern then.
Each bullish movement that initiates after a formation of an equal low should be weaker than a previous one.
So that the price should set a lower high every time after a formation of an equal low.
Look at a price action on USDCHF forex pair. Way before the price dropped, you could easily identify a market manipulation of Smart Money and selling orders accumulation.
A breakout of a horizontal demand zone was a final bearish confirmation signal.
Let's study its bullish model.
It has a similar structure.
The price should set a sequence of equal highs, respecting a horizontal supply zone.
Each bearish move that follows after its test should have a shorter length, forming a higher low with its completion.
This model will be also valid if it forms after a completion of a bearish impulse.
Weakening bearish movements will signify a loss of confidence in a supply zone, with fewer and fewer market participants selling that.
Its bullish breakout will be an important even that will confirm a highly probable strong bullish continuation.
Smart Money will use this price model to manipulate the market and accumulate buying orders, not letting the price go through a supply zone. They will grab a liquidity of the sellers each time a bearish move follows from a supply zone.
When they finally get enough of a liquidity, a bullish rally will initiate and a supply zone will be broken , providing a strong confirmation signal.
That price model was spotted on GBPJPY forex pair.
Smart Money were manipulating the market, not letting it continue rallying by creating a significant horizontal supply zone.
Selling orders that were executed after its tests provided a liquidity for them.
A bullish breakout of the underlined zone provides a strong bullish confirmation signal.
A breakout and a future rise could be easily predicted once this price model appeared.
Why they do it?
But why do Smart Money manipulate the markets that way?
The answer is simple: in comparison to retail traders, they trade with huge trading orders . To hide their presence and to not impact market prices much, they split their positions into a set of tiny orders that they execute, grabbing the liquidity.
The price model that we discussed today is the example how they do it.
The important thing to note about this pattern is that it efficiently works on any market and any time frame. You can use that for scalping, day trading, swing trading. And it can help you find great investing opportunities.
❤️Please, support my work with like, thank you!❤️
I am part of Trade Nation's Influencer program and receive a monthly fee for using their TradingView charts in my analysis.
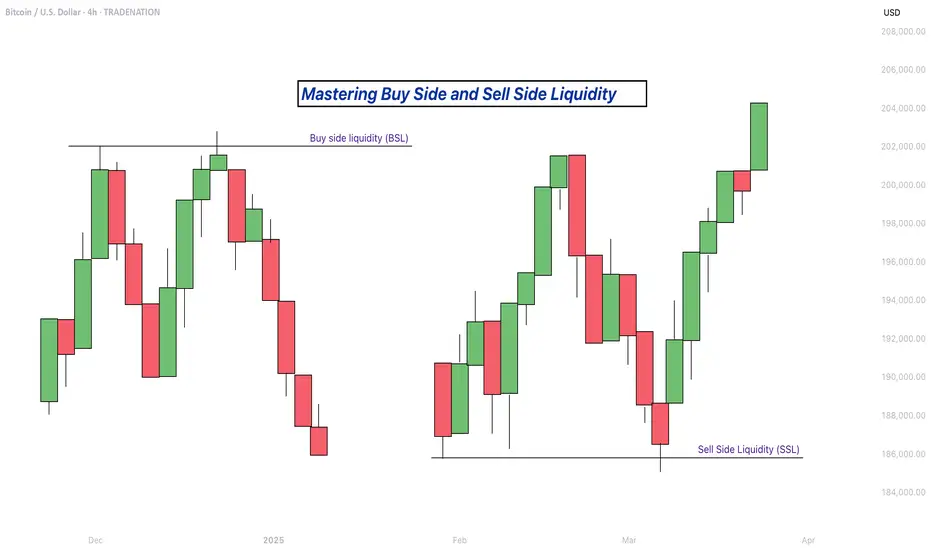
Mastering Buy Side and Sell Side Liquidity - How to trade it!In trading, understanding liquidity is one of the keys to predicting where the market might go next. The Inner Circle Trader (ICT) method teaches traders how to recognize where big players like banks and institutions are likely to enter or exit trades. Two important ideas in ICT trading are buy side liquidity and sell side liquidity. Once you understand what these terms mean and how to spot them on a chart, you can start using them to find better trading opportunities.
What will be discussed?
- What is Buy Side Liquidity?
- What is Sell Side Liquidity?
- How do you see Buy and Sell Side Liquidity?
- Examples
- How to trade BSL and SLL Liquidity?
What is Buy Side Liquidity
Buy side liquidity is found above market highs. It refers to all the stop loss orders from people who are holding short positions. When the market is going down, some traders sell (or go short) and place their stop losses above recent highs to protect themselves. These stop losses are actually buy orders because closing a short position requires buying. Big institutions know this, so they push price upward to trigger those stop losses and grab that liquidity. That’s why you’ll often see the market spike above a recent high before reversing. That spike is the market grabbing buy side liquidity.
What is Sell Side Liquidity
Sell side liquidity is the opposite. It’s found below recent lows. This is where traders who are buying (going long) place their stop losses. If someone buys a market, they’ll usually put a stop loss just below a previous low. That stop loss is a sell order. Smart money looks at these areas as pools of sell side liquidity. So when the market moves down quickly and breaks a recent low, it’s likely collecting those sell stop orders. After that, you’ll often see a reversal because the liquidity has been taken.
How do you see Buy and Sell Side Liquidity?
You can spot buy side and sell side liquidity by looking at the chart and identifying recent highs and lows where many traders might have placed stop losses. These are usually obvious swing highs and swing lows. If you look at a chart and see a clean high where price previously reversed, that’s likely where traders are placing stops. That makes it a target for buy side liquidity. Same for a recent low, if it’s a clean level where people might have bought in the past, that low probably holds sell side liquidity. The more obvious the level looks, the more likely it’s full of stops and therefore a liquidity target.
Examples
How to trade BSL and SLL Liquidity?
Trading liquidity means watching for the market to run above a recent high (to take buy side liquidity) or below a recent low (to take sell side liquidity), and then looking for signs of reversal. Once liquidity has been taken, the market often changes direction.
When you’re trading the ICT concept of liquidity, the key is not just spotting where liquidity lies, but also knowing when price is likely to reverse after that liquidity has been taken. Reversals don’t happen randomly, they leave clues on the chart. Here’s how you can recognize those signs in a simple way:
1. Market Structure Break
This is one of the clearest signs of a reversal. Let’s say the market grabs sell side liquidity by breaking below a recent low. If price then quickly starts moving up and breaks above the last lower high, that’s a break in structure. It shows that sellers are losing control and buyers are stepping in. It’s the first confirmation that the direction might be changing.
2. Rejection Wicks or Strong Candles
After price runs into liquidity (above a high or below a low), watch the candlesticks closely. If you see a long wick rejecting the level, or a strong candle in the opposite direction right after the liquidity grab, that’s a clue. It means price went there, collected the orders, and got rejected fast. That rejection shows the market might be reversing.
3. Fair Value Gaps (FVGs)
Fair value gaps are small “windows” left in price when it moves quickly in one direction. After liquidity is taken and price starts reversing, it often leaves an FVG behind. If price pulls back into that gap and holds, that can be a great entry point. FVGs act like magnets and support zones in ICT.
4. Displacement
Displacement is a strong, impulsive move that breaks structure. It usually happens right after liquidity is taken. If price moves very fast in the opposite direction after hitting a liquidity level, that’s a good sign smart money is behind the move and it’s not just random noise. That strong push is a hint that a new trend might be forming.
5. Change in Character (CHOCH)
This is a shift in how the market behaves. For example, price might be making lower highs and lower lows (a bearish trend), but after liquidity is taken, it suddenly starts making higher highs and higher lows. That change in character tells you the trend might be reversing.
-------------------------
Disclosure: I am part of Trade Nation's Influencer program and receive a monthly fee for using their TradingView charts in my analysis.
Thanks for your support. If you enjoyed this analysis, make sure to follow me so you don't miss the next one. And if you found it helpful, feel free to drop a like 👍 and leave a comment 💬, I’d love to hear your thoughts!
Simple Swing Trading Strategy with Smart Money Concept Explained
I will share with you the essential basics of swing trading forex gold with Smart Money Concepts.
You will learn how to do swing trading with the best SMC strategy.
I will teach you to c ombine order blocks, liquidity zones and imbalances to spot accurate entries and confirmation signals.
If you just started learning swing trading Forex with Smart Money Concepts, I strictly recommend trading with the trend only.
The cases and examples that we will discuss will be strictly trend-following ones.
Swing Trading with SMC in Uptrend
For swing buying any forex pair, we will look for the market that is trading in a bullish trend.
To confirm that the market is rising, you will need to execute structure mapping and find a forex pair that updates Higher Highs HH and Higher Lows HL.
Above is the example how I confirmed that GBPUSD is bullish with structure mapping. You can see that the pair consistently updates the highs.
Once you identified a bullish pair, your next step will be to find the zone from where the next swing move will follow.
According to the rules, the market remains in uptrend till the price is staying above or on the level of the last Higher Low HL.
Here is such a zone on GBPUSD.
It is based on the last Higher Low and current price levels.
We will assume that buying orders will concentrate within that area and from that a bullish rally will follow.
The problem is that this area is extremely wide, and we can not just buy randomly within.
Our next step will be to find liquidity zones within.
To buy, we need demand areas.
I found 4 price action based historic demand zones on GBPUSD.
We will need to wait for the test of one of these zones and then wait for an order block - a place where smart money are placing their buy orders.
The problem is that we don't know in which of these areas the order block is, so we will need to wait for tests of these zones and a consequent imbalance to confirm it.
To confirm a bullish imbalance for swing trading Forex, I recommend analyzing a 4H time frame after a test of a demand zone.
According to Smart Money Concepts, a bullish imbalance can be any sign of strength of the buyers : bullish breakout of a vertical/horizontal resistance, change of character, high momentum bullish candle, bullish price action pattern, etc.
An order block on GBPUSD was confirmed with a breakout of a resistance line of a falling channel on a 4H time frame.
That was the signal that Smart Money are buying, and that is your signal to open a swing long trade.
You place a buy position then with a stop loss below the order block and a target - at least a current high.
Swing Trading with SMC in Downtrend
For swing selling any forex pair, you will need to find a market that is trading in a bearish trend.
I suggest applying structure mapping to identify such a pair.
It simply should update Lower Lows LL and Lower Highs consistently.
USDCAD is trading in a bearish trend.
Structure mapping helps to easily confirm that.
Then, we will need to identify the zone from where the next bearish wave will start.
According to Smart Money Concepts structure mapping rules, the market remains bearish till the price is staying below or on the level of the last Lower High LH.
That's such a zone on USDCAD.
It is based on current prices and the last Lower High.
We will assume that selling orders will be distributed along the entire lenth of our zone.
Of course, we can not sell randomly within that zone because it is relatively extended.
Our next task will be to find liquidity supply zones within.
I found 2 price action based supply zones within our underlined area.
Before we sell, we will need to find an order block.
A place from where smart money are selling big.
To spot that, I suggest waiting for a test of one of our supply zones and wait for a bearish imbalance on a 4H time frame.
According to SMC, a bearish imbalance can be a bearish high momentum candle, a bearish CHoCH, a bearish price action pattern, a bearish breakout of a horizontal/vertical support , etc.
You can see that a lower supply zone was tested on USDCAD.
Our bearish order block confirmation is a bearish Change of Character, a formation of a high momentum bearish candle and a breakout of a rising trend line.
After that we can open a swing sell position and expect a bearish movement at least to a current low.
Stop loss should lie strictly above the order block.
TP should be at least a c urrent low.
That is how a trade should be executed on USDCAD pair.
Remember that there is no guarantee that the order block will be within a liquidity zone. You should learn to track the signs of smart money and their operations.
A proper combination of a trend analysis, liquidity zones and order block is the essential basis of a profitable swing trading Forex.
Mastering that, practice recognizing the imbalances and confirmations for spotting the best swing trading entries.
❤️Please, support my work with like, thank you!❤️
I am part of Trade Nation's Influencer program and receive a monthly fee for using their TradingView charts in my analysis.