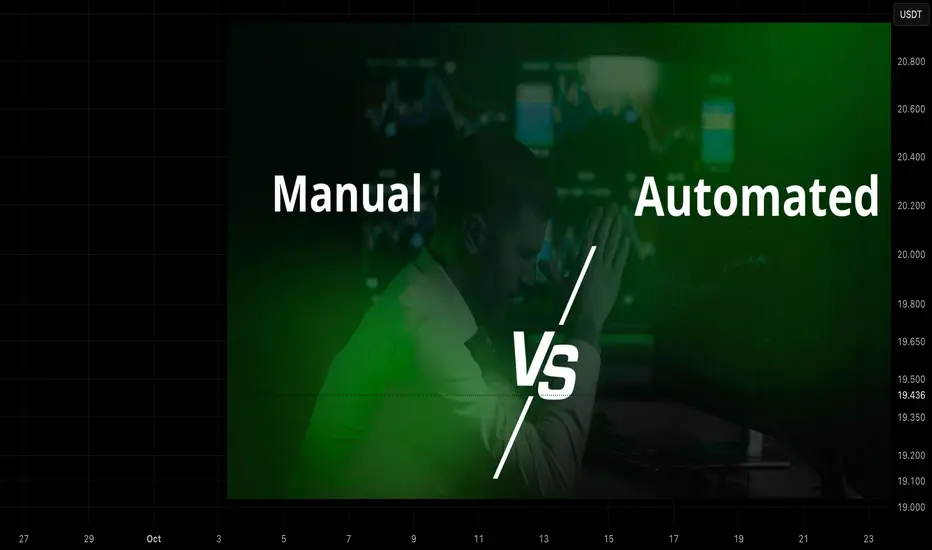
Automated vs Manual Trading — Which One Really Wins?Most traders start out manually, staring at charts for hours, hunting for that perfect setup, trying to outsmart the market.
It feels alive. You’re in control.
But after a while, you realize something brutal:
the real opponent isn’t the market, it’s you.
Fear, greed, hesitation, fatigue. The emotions that ruin good trades. That’s when automation steps in.
Manual Trading
Manual trading builds skill, but it also exposes every weakness you’ve got.
If this sounds familiar, you’re not alone:
Entering late because you hesitated.
Moving your stop loss “just one more time.”
Doubling down after a loss.
Missing setups because you needed sleep.
Manual trading gives flexibility, sure.
But it also gives you the freedom to sabotage your own plan.
Automated Trading
Benefits
Consistency: trades follow predefined rules, eliminating impulsive deviations from the plan.
Scale: automation handles higher frequency and 24/7 market coverage beyond human capacity.
Speed and precision: orders execute with lower latency and exact risk parameters.
Backtest + deploy: strategies validated historically can be deployed reliably across multiple markets.
Operational leverage: frees human time for strategy development, risk oversight, and portfolio decisions.
Disadvantages and risks
Model risk: historical backtests do not guarantee future performance; edge can decay.
Overfitting and brittle rules: overly specific parameters may break under regime changes.
Misaligned incentives: automated systems execute mechanically; they cannot judge rare macro events or qualitative news.
Monitoring burden: automation reduces manual trading work but increases need for robust monitoring, alerts, and contingency plans beforehand.
⚔️ Two Traders, One Market
Here’s the truth: two traders can run the same strategy and get completely different results.
Trader A trades manually, emotional, inconsistent.
Trader B runs automation, same logic, perfect execution.
Same system. Different outcome.
Guess which one ends up consistent?
Trend Analysis
TradeCityPro Academy | Support & Resistance Part 2👋 Welcome to TradeCityPro Channel
🎓 Educational Section Technical Analysis Training Series
Welcome to the Educational Content Section of our channel!
Here, we aim to teach you technical analysis from A to Z through structured playlists.
We’ll cover everything from risk and capital management, Dow Theory, support and resistance, trends, and market cycles, to more advanced concepts.
Our lessons are based on both real market experience and The Handbook of Technical Analysis.
🎨 What is Technical Analysis?
Technical Analysis (TA) is a method used to forecast price movements in financial markets by analyzing historical data, especially price and volume.
It’s based on the idea that history tends to repeat itself, and that recurring patterns can reveal profitable trading opportunities.
📚 Complete Guide to Support and Resistance in Technical Analysis
🧩 Introduction
In technical analysis, two key concepts form the foundation of nearly every trading strategy: Support and Resistance.
These levels represent areas on the chart where the price is likely to change direction, as buyers or sellers regain control.
But to truly understand them, you must go beyond the chart — because their origin lies in human psychology and collective behavior.
🟢 What Is Support?
A support level is an area where buying pressure increases and prevents the price from falling further.
It acts like a floor where buyers believe the asset has become cheap enough to buy.
As a result, the market tends to bounce upward from that area.
For example, if Bitcoin has repeatedly reversed near $55,000, that zone is considered a support level.
🔴 What Is Resistance?
A resistance level is an area where selling pressure increases and stops the price from rising higher.
When the price approaches this level, traders often feel the asset is “too expensive” and start selling.
For example, if Ethereum has failed multiple times to break above $3,800, that area is considered resistance.
💭 Why Do Support and Resistance Form?
Markets are not just numbers — they’re the reflection of human emotion and crowd behavior.
When large groups of traders make similar decisions (to buy or sell) around the same price zone, it creates a psychological memory in the market.
If price has reacted there before, traders remember it — and react the same way next time.
This repetition forms the backbone of how support and resistance levels develop and strengthen over time.
🧠 The Role of Emotion and Crowd Psychology
Emotions drive markets.
When prices rise quickly, people experience FOMO (Fear of Missing Out) and rush to buy — until demand runs out and price reverses (resistance).
When prices fall, fear of losing money triggers panic selling — until sellers dry up and price rebounds (support).
This constant emotional cycle repeats endlessly, creating recurring support and resistance zones on every chart.
⚙️ The Structure Behind the Levels
From a technical perspective, these levels form because large clusters of orders are placed around them.
Traders typically set buy orders below the current price (near support) and sell orders above it (near resistance).
So when the market reaches those areas, there’s a strong battle between buyers and sellers.
That’s why these zones are not just psychological — they’re also built into the order flow and liquidity structure of the market.
📈 Reactions and Breakouts
When price approaches a key level, two outcomes are possible: Reaction or Breakout.
In a reaction, price touches the level and reverses — meaning buyers or sellers defend it successfully.
In a breakout, price pushes through with strong momentum and high volume, breaking the market’s previous belief.
After a breakout, the level often changes its role:
A broken resistance becomes new support.
A broken support becomes new resistance.
This behavior is known as Role Reversal, one of the most powerful principles in chart analysis.
⚖️ The Professional Mindset
Support and resistance are zones, not exact numbers.
The market may slightly move above or below them before reacting — this is known as a fake breakout.
Professional traders look for confirmation such as reversal candles, volume spikes, or RSI divergences before acting.
The key is not to memorize lines but to read crowd behavior.
Once you understand why people buy or sell at certain points, you gain a true edge over the average trader.
🧩 Conclusion
Support and resistance are not just lines on a chart; they are the visible footprints of fear, greed, and collective memory in the market.
By understanding their psychological and structural roots, you can identify better entry and exit zones,
predict reactions more accurately, and avoid emotional mistakes.
Learn to read the emotions behind the candles — because at its core, the market is simply a crowd of human minds trying to win.

3 Cognitive Traps That Prevent You from Closing Losses!Hello, friends 😊
Today I want to talk not about indicators or patterns, but about why, even if we know everything "correctly", we still hold unprofitable positions longer than we should. Even when the price doesn't go according to plan and the situation becomes more obvious, we still convince ourselves that " is about to turn around "
Honestly? I sometimes struggle with it myself , but now it's not as panicky as it used to be.
🤔 And yes, I also had moments when I looked at the graph and realized that "that's it, the hypothesis didn't work," but I still thought, "Well, I'll wait a little longer... what if?"
It's not a matter of weak will. The fact is that our brain is designed in such a way that it literally prevents us from making rational decisions at a loss . And today we will analyze 3 such cognitive traps , and see how to work with them.
Let's start, 🚩 Trap #1: The Concorde effect or the error of non-refundable costs (literally "sunk costs") - Costs that have no alternative use: costs incurred as a result of decisions made in the past and which cannot be changed by a subsequent decision in the future. When so much effort and resources have been invested in something that you don't want to stop. But it should be.
For example: "I've already invested so much time/money/nerves - now I have to wait for everything to come back!"
Does it sound logical in principle? But in reality, is an illusion . Because the market absolutely doesn't care how much you have invested. He doesn't have to return anything to you.
🔎 There was a moment when I just joined the market, I held a losing position on ETH for almost a week, because "I've been waiting so long, I'll wait some more." As a result, the loss tripled, and then, when I finally closed, the price went in my direction (classic) 😁
The most annoying thing was not the loss, but the fact that I violated my own rule (ignored the stop)
🔋 How to live with it?
A simple trick: before each trade (or even at the moment of loss) ask yourself : "If I wasn't in a position right now, would I open it under these conditions?"
If the answer is "no", exit. All. Point. Past losses cannot be returned . But you can stop the future ones and return to the market (albeit with a smaller amount)
🚩 Trap #2: The illusion of control is a cognitive distortion in which a person overestimates their ability to influence events that actually depend on chance or external circumstances
For example: "I feel like it's about to unfold. I know this pattern. I have the situation under control."
I feel ... we all use this phrase in our thoughts as a basis, especially when the market is going against us and we cling to hope.
But the truth is that the market is not controlled by anyone . Neither you, nor smart money, nor even those who trade billions. We are all participants in the same probability game .
And when you say, "I feel," what you're really saying is, "I really don't want to admit that I was wrong."
🔋 What can be done about it?
Remind yourself more often: we are not predicting the market - we are betting on probability.
If the price violates your risk level, it is not a "temporary drawdown." This is a refutation of your idea . And respect for the market begins with respect for your plan.
🚩 Trap #3: The Confirmation effect is a cognitive error that manifests itself in a person's tendency to seek, interpret, and remember information that confirms their pre-existing beliefs, and ignore data that contradicts these beliefs
For example: "Look, here's a bullish pattern! The volume is growing! The RSI has bounced back!"*
(and the divergence on the day, the fundamental news and the structure are negative ... but this is "not important", etc.)
Our brain is a master at filtering reality . He automatically searches for everything that confirms our point of view, and ignores everything that contradicts it. This is not stupidity, it is an evolutionary mechanism. But in trading, he's working against us.
🔋What should I do?
Before entering into a transaction, write it down in your diary:
- under what conditions will you leave?
- what signals will mean that you made a mistake?
And when there is already a loss, ask yourself: "What data am I not seeing right now because I don't like it?"
This question is like a cold shower for the ego, but it brings you back to reality .
We're not perfect 🔆 I also have days when emotions take over.
But over time, I realized that stability in trading is not about "never making mistakes." It's about making mistakes with respect for yourself and the market and drawing conclusions based on your mistakes.
💡 A loss is not a failure . This is part of the process .
But the inability to control it is what really slows down growth .
📌 So if you closed the loss on time today, even if it hurt, you won.
Because we have saved not only capital, but also the most valuable thing: our trust in ourselves as a trader .
If this post made you nod😉, please rate🚀
And in the comments, write: which of these traps most often "catches" you?
(I still have the illusion of control sometimes. But now I recognize her and gently release her)
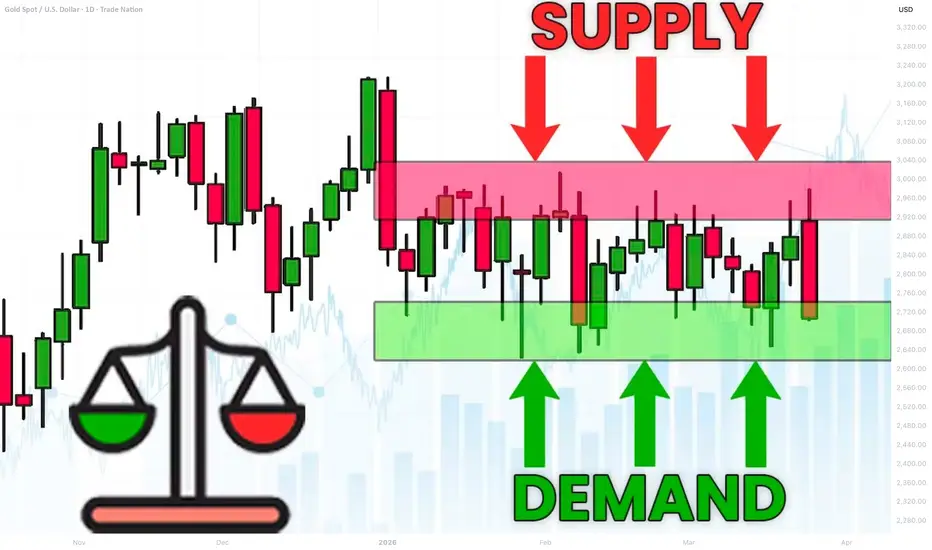
What is Equilibrium in SMC. Balance and Imbalance in Forex Gold
Equilibrium is one of the core elements for understanding market liquidity.
In this article, we will go through the essential basics of liquidity in Forex trading with Smart Money Concepts SMC.
You will learn the interconnections between supply and demand and I will explain how to easily identify balance and imbalance on any market.
Let's start our discussion with understanding how forex pairs move.
The price of an asset goes up if the market demand is stronger than the market supply. The excess of buying activity make the markets update the highs. In smart money concepts, such an event will also be called a buying imbalance.
Look at a strong bullish rally on Gold.
The price is going up because of a buying imbalance.
A strong buying activity creates a massive amount of buyers with unfilled orders.
To entice sellers to start selling, they must offer a higher-better price.
At the same time, if the price of an asset goes down , it means that the market supply is stronger than a demand. The excess of supply will make the markets update the lows. In smc, it will be called a selling imbalance.
That is exactly what is happening with GBPUSD forex pair.
A strong selling activity and the shortage of demand makes the price go down.
The excess of supply or demand on the market can not be eternal.
The lower the price becomes, the more buyers will start buying, and the more sellers will start closing their positions.
At some moment, the surplus of supply will be absorbed by the buyers.
That will be a moment when the market will find equilibrium , the balance between supply and demand.
A strong bearish imbalance on USDJPY made the price drop significantly.
The falling price made 3 things:
It attracted more buyers, because the lower the price the more profitable is buying USDJPY.
It discouraged some buyers from buying, considering that the price is already "too low".
It encouraged some buyers to close their positions in profit.
Because of that, USDJPY stopped falling and found a balance in supply and demand. That is what we call Equilibrium .
In a bull run, the higher the price will go, the more sellers will start selling.
At some moment, buying imbalance will be absorbed by the bears and supply & demand will eventually balance.
Such an event will be called the equilibrium .
EURGBP was rallying strongly.
The higher the price went, the more sellers started to sell, considering selling the pair more and more profitable.
And the same time, fewer buyers were buying and the more started to close their buy positions in profits.
At some moment, the entire excess of the market demand was absorbed by a supply. The market stopped growing and equilibrium was found.
One of the main characteristics of a market equilibrium is sideways price movement and a termination of a formation of new highs or new lows.
Usually, such a sideways price action will form a horizontal range.
That's a real example how a CAD JPY pair found an equilibrium after an extended bearish movement. A formation of a horizontal range confirmed a balance between a supply and a demand.
Please, note that these ranges will form on any time frame that you analyse.
The rule is that the higher is the time frame of the range, the stronger is the market equilibrium.
Above, I have 3 different charts:
USDJPY on a daily time frame, EURJPY on a 4H and GBPUSD on 15 minutes.
All the pairs found an equilibrium in horizontal ranges.
An equilibrium on USDJPY will signify intra week or even intra month balance,
while on EURJPY it will mean intraday/intra week balance.
On GBPUSD, it will signify intraday equilibrium.
Market equilibrium can not last forever.
Fundamentals news and changing market conditions, make the market participants constantly reassess a fair value of an asset.
A violation of the range and a breakout of one of its boundaries will be a trigger of an occurrence of an imbalance .
A bullish violation of the upper boundary of the range will signify a buying imbalance and a highly probable rise to the new highs.
While a bearish violation of the lower boundary of the range will mean a selling imbalance and a highly probable fall to the new lows.
Please, study how GBPCHF was moving for a week on an hourly time frame.
The periods of balance were changed by the periods of bullish or bearish imbalances, that found a new equilibrium on higher/lower price levels.
Understanding of basic principles of supply and demand in trading is essential for profitable trading smart money concepts.
Learn to recognize the periods of imbalance and equilibrium.
It will provide you the edge in understanding and trading any forex pair.
❤️Please, support my work with like, thank you!❤️
I am part of Trade Nation's Influencer program and receive a monthly fee for using their TradingView charts in my analysis.
700% XRP Trade — The Exact Strategy I UsedThe XRP Trade That Made 700% — Full ICT Breakdown!
In this video, I break down my 700% XRP trade that I called out on the channel — exactly how I entered, why I entered, and how I managed the position.
I also explain why you don’t need to overcomplicate trading by drilling down to the 15-minute or 5-minute charts — sometimes, the cleanest ICT setups are right on the higher timeframes.
If you’ve been struggling to find consistency, this video will show you how powerful HTF liquidity plays can be when combined with patience and clear structure.
📈 Covered in the video:
Full breakdown of my XRP 700% trade
The exact HTF setup I used
How I manage risk and secure profits
Why ICT trading doesn’t need to be complicated

Market Seasonality: Finding Statistical Edges in Price Patterns🟢 Overview
Market seasonality refers to recurring, quantifiable patterns in asset price movements that appear consistently across different time periods. Rather than mystical predictions, these patterns reflect systematic behavioral trends, institutional flows, and market structures that have persisted across years, and in some cases, centuries, of trading history.
🟢 How Seasonality Works
Seasonality analysis examines historical price data to identify months or periods when specific assets have historically shown strength or weakness. The approach replaces emotion-driven decision-making with probabilistic insights based on historical performance across complete market cycles, including bull markets, bear markets, and periods of consolidation. By quantifying these patterns, traders and investors can identify potential statistical edges in their execution timing.
🟢 Evidence Across Asset Classes
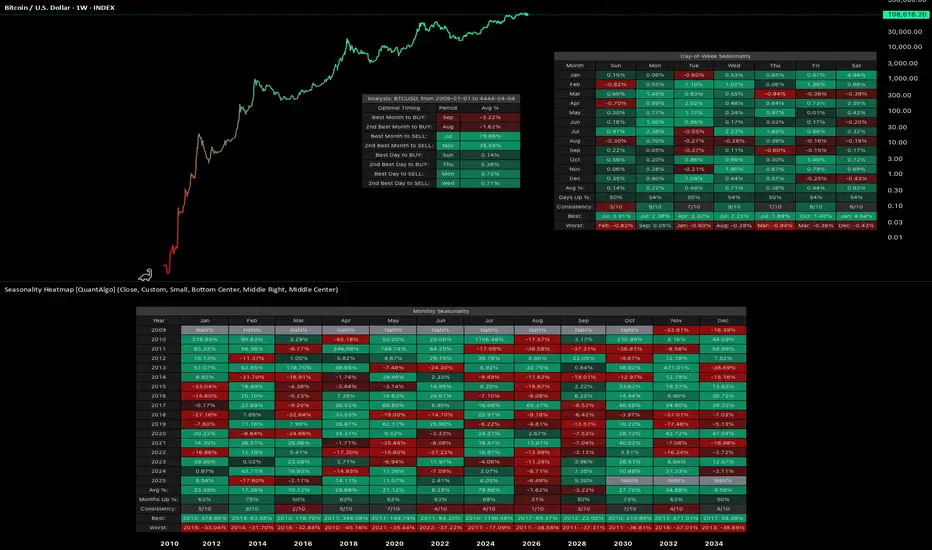
1. Bitcoin INDEX:BTCUSD
Since the development of futures markets and institutional participation, Bitcoin has demonstrated notable seasonal patterns with measurable statistical significance. September has averaged -1.92% returns, establishing it as the weakest month. In contrast, October has emerged as the strongest performer with average returns of +21.59% and a 90% positive occurrence. This level of consistency suggests a robust statistical edge rather than random variation.
Day-of-week patterns in modern Bitcoin are relatively tight, with differences ranging from 0.07% to 0.50%. Monday edges out as the optimal day for selling positions. However, these daily patterns offer considerably less statistical significance than the monthly seasonality effects, as the weekly variations have smoothed out compared to Bitcoin's earlier history.
2. Ethereum INDEX:ETHUSD
Ethereum displays even more pronounced seasonal variations with stronger directional bias. September has been particularly challenging, averaging -10.04% returns and showing negative performance in eight out of ten years, representing an 80% probability of decline. June also demonstrates weakness at -7.20% average returns. Conversely, May stands out as the strongest month with average returns of +34.97%, positive 70% of the time across the dataset. May has delivered positive returns in seven out of ten years, providing a statistically meaningful edge.
Day-of-week analysis reveals differences of 0.2% to 0.6%, with Wednesday edging out slightly for selling and Tuesday showing marginally better performance for buying. However, these daily variations lack statistical significance when compared to the dramatic monthly patterns, representing more noise than actionable alpha for systematic strategies.
3. S&P 500 SP:SPX
With over 50 years of data dating back to 1971, the S&P 500 demonstrates the famous "September Effect." September averages -0.90% returns and has been negative with notable consistency, establishing statistical significance through sheer sample size. November, capturing typical year-end institutional positioning, averages +1.73% with positive performance 70% of the time. April comes in second at +1.44% average returns. The persistence of these patterns across five decades provides robust evidence of systematic seasonal effects even in highly efficient markets.
Day-of-week effects in the S&P 500 are minimal, ranging from just 0.01% to 0.07%. Monday shows a slight negative drift at -0.01%, while Wednesday edges up 0.07%. These intraday variations fall well within normal variance and lack statistical significance for execution timing. For this index, monthly patterns provide the primary source of seasonal alpha.
4. Gold OANDA:XAUUSD
Perhaps most compelling is gold's seasonal data spanning nearly 200 years since 1832, offering an extraordinarily large sample size for statistical validation. January shows the strongest average returns at +0.99% and has been positive 80% of the time, representing a highly reliable statistical edge. June represents the weakest period at -0.18% average returns, with October also serving as a potential entry point at just 0.05% average returns. July comes in as the second-best month at +0.79%. The consistency of these patterns across multiple centuries, world events, and monetary system changes indicates deeply embedded structural inefficiencies in market dynamics.
Day-of-week patterns in gold are similarly minimal. Thursday edges out at 0.09% for optimal selling, while Sunday shows 0.01% for buying opportunities. Like the S&P 500, gold trades predominantly on monthly patterns rather than daily variations, with intraweek effects lacking statistical significance.
🟢 TL;DR
1. Bitcoin INDEX:BTCUSD : Accumulate during September weakness (-1.92%), sell into October strength (+21.59%). October has been positive 9 out of 10 years since 2015, representing a 90% positive occurrence. Day of week: Sunday dips for buying, Monday for selling.
2. Ethereum INDEX:ETHUSD : Summer pain is real. September (-10.04%) and June (-7.20%) are buying opportunities. May (+34.97%) is the monster month historically, positive 7 out of 10 years (70% positive frequency). Day of week: Tuesday buying, Wednesday selling, but minimal statistical significance.
3. S&P 500 SP:SPX : The September Effect demonstrates statistical significance (-0.90% average over 50+ years). November (+1.73%) captures the year-end rally with 70% positive occurrence. Day of week effects are negligible (0.01-0.07%) and lack statistical significance.
4. Gold OANDA:XAUUSD : January strength (+0.99%, 80% positive frequency) after June weakness (-0.18%). Nearly 200 years of data backing these patterns provides exceptional statistical validation. Day of week: Sunday buying, Thursday selling, but minimal differences.
🟢 Final thoughts
Ultimately, seasonality analysis does not guarantee future results, but it provides a framework for probabilistic decision-making with quantifiable statistical edges. Rather than attempting to time markets based on sentiment or short-term price movements, systematic traders and investors can align decisions with periods that have historically shown consistent strength or weakness with statistical significance. This approach is particularly valuable for planning entry and exit points, portfolio rebalancing, and managing position sizing within a rules-based framework.
Notably, while day-of-week patterns exist in some assets, monthly seasonality tends to provide more significant and statistically reliable edges across most markets. The data suggests that seasonal patterns persist even in highly efficient markets, driven by recurring institutional behaviors, tax considerations, and structural market dynamics that create exploitable inefficiencies.
Market seasonality should be viewed as one analytical tool within a comprehensive quantitative framework, not a guarantee of performance, but a method to incorporate historical probabilities and statistical edges into systematic investment decisions.
This isn't about perfect timing either. It's about leveraging statistical edges based on historical probabilities instead of emotion. You'll still be wrong sometimes, but less often when operating with decades of data and quantifiable patterns rather than sentiment alone.
👉 Try the Seasonality Heatmap indicator yourself on TradingView to explore these patterns across different assets and timeframes.
*This analysis is for educational purposes only and is not financial advice. Past performance does not guarantee future results. Always do your own research and consult with a qualified financial advisor before making investment decisions.
Watch SUZLON For LongREASON TO GO LONG:
Technically: This stock took Support at STRONG Level, and in Weekely Time frame Took Support at 200 EMA and Bounced Back. Probability looking like reversal from this level.
Fundamentally: This Company Maintaining almost debt free, Company is expected to give good quarter and Company has delivered good profit growth of 22.9% CAGR over last 5 years
Good To But at 54-55, Target 61, 68, 74+, Stoploss Should be at 50.
Note: It's Just My View...Not a tip or advice
#Thanks For Checking My Idea, I Hope it sparked some value for you
🙏Follow for more insights
✅Boost if you found it helpful
📝Drop a comment with your thoughts below..!

The Gold's Market just Crashed????- Gold generated unimaginable returns of more than 68% since January 2025.
- On Oct 20 (Monday this week), the precious metal made its ATH of 4381.5.
- In the past 2 days, especially on Tuesday, the gold made substantial corrections of more than 8.55%.
- It recovered around 2.5% and currently down around 5.60% from its record highs.
But, we cannot ignore the facts also..........
- Spot gold prices slumped as much as 6.6%, the biggest decline in more than a dozen years,
- While spot silver dropped as much as 8.7%.
- But, Even after today’s strong corrections, prices remains above 4,100
- These are still levels most mining companies could only have dreamed of not long ago.
- For investors, the message is simple — its time to buckle up, and maintain patience parallelly, while not losing the conviction
In my view, we’re still in the early stages of a powerful bull market.

Global Financial Markets and Their StructureIntroduction
The global financial market represents the interconnected network of institutions, systems, and instruments through which money and capital flow across borders. It forms the backbone of the world economy, enabling governments, corporations, and individuals to raise capital, invest, trade currencies, and manage risks. With globalization, technological innovation, and liberalization, financial markets have become increasingly integrated, influencing economic growth, monetary policy, and international relations. Understanding the structure of global financial markets is essential to grasp how capital is allocated worldwide and how financial stability is maintained.
1. Concept of Global Financial Markets
A financial market is a platform where buyers and sellers engage in the trade of financial assets such as equities, bonds, currencies, and derivatives. When these markets operate across countries and connect multiple economies, they form what is known as the global financial market.
In essence, the global financial market:
Facilitates the flow of funds from surplus units (savers) to deficit units (borrowers).
Provides a mechanism for price discovery and risk management.
Enhances liquidity, enabling participants to easily buy and sell assets.
Plays a crucial role in economic growth, investment, and stability.
The global market is not a single entity but a network of interconnected markets functioning through institutions such as banks, stock exchanges, hedge funds, insurance companies, and central banks. Modern communication technology, digital trading platforms, and financial integration have turned it into a real-time, 24-hour global system.
2. Structure of the Global Financial Market
The structure of the global financial market can be broadly categorized into several interrelated segments:
Money Market
Capital Market
Foreign Exchange Market
Derivative Market
Commodity Market
Insurance and Pension Market
Each segment serves a distinct purpose, yet all are interlinked and essential to the smooth functioning of the global economy.
3. The Money Market
The money market deals with short-term funds and financial instruments with high liquidity and short maturities, typically less than one year. It provides a means for governments, financial institutions, and corporations to manage short-term funding needs and liquidity.
Key Instruments
Treasury Bills (T-Bills)
Certificates of Deposit (CDs)
Commercial Papers (CPs)
Repurchase Agreements (Repos)
Bankers’ Acceptances
Major Participants
Central Banks (e.g., Federal Reserve, European Central Bank, Reserve Bank of India)
Commercial Banks
Financial Institutions
Corporations
Money Market Mutual Funds
Role in the Economy
The money market stabilizes short-term interest rates, supports monetary policy operations, and ensures liquidity in the financial system. It acts as the link between the banking system and capital markets, influencing credit flow and investment activity.
4. The Capital Market
The capital market is where long-term securities, such as stocks and bonds, are issued and traded. It enables corporations and governments to raise long-term funds for development and expansion.
Subdivisions
Primary Market: Where new securities are issued (Initial Public Offerings or IPOs).
Secondary Market: Where existing securities are traded (Stock Exchanges like NYSE, NASDAQ, LSE, BSE, NSE).
Key Instruments
Equity Shares
Corporate Bonds
Government Securities
Debentures
Mutual Funds
Exchange-Traded Funds (ETFs)
Major Participants
Institutional Investors (pension funds, insurance companies)
Retail Investors
Investment Banks
Stock Exchanges
Regulators (like SEC in the U.S. or SEBI in India)
Importance
The capital market promotes economic development by mobilizing long-term savings into productive investments. It ensures efficient capital allocation, wealth creation, and corporate governance through market discipline.
5. The Foreign Exchange (Forex) Market
The foreign exchange market is the largest financial market in the world, with daily transactions exceeding $7 trillion. It facilitates the exchange of one currency for another, supporting international trade, investment, and tourism.
Structure
Spot Market: Immediate currency transactions.
Forward Market: Agreements to exchange currencies at a future date.
Swap Market: Simultaneous purchase and sale of currencies for different maturities.
Major Participants
Central Banks
Commercial Banks
Multinational Corporations
Hedge Funds
Currency Traders and Brokers
Functions
Enables global trade and investment by providing currency convertibility.
Determines exchange rates through supply and demand.
Facilitates hedging against currency risk.
The forex market operates 24 hours a day due to overlapping time zones, making it a truly global and decentralized market.
6. The Derivative Market
The derivatives market deals with financial instruments whose value derives from underlying assets such as stocks, bonds, currencies, interest rates, or commodities.
Common Derivative Instruments
Futures
Options
Swaps
Forwards
Purpose
Derivatives allow investors and corporations to hedge against risks such as fluctuations in interest rates, exchange rates, and commodity prices. They also provide opportunities for speculative gains and portfolio diversification.
Examples
Interest Rate Swaps (used by banks)
Currency Options (used by exporters/importers)
Stock Index Futures (used by institutional investors)
The derivative market is an essential part of the global financial system, enhancing liquidity and risk management, though excessive speculation can contribute to systemic risk—as seen in the 2008 global financial crisis.
7. The Commodity Market
The commodity market facilitates trade in raw materials and primary products. It includes both physical trading and derivative contracts based on commodity prices.
Types of Commodities
Hard Commodities: Metals, oil, natural gas.
Soft Commodities: Agricultural products like wheat, coffee, and cotton.
Major Commodity Exchanges
Chicago Mercantile Exchange (CME)
London Metal Exchange (LME)
Multi Commodity Exchange (MCX, India)
New York Mercantile Exchange (NYMEX)
Role
Commodity markets allow producers and consumers to hedge against price fluctuations, promote transparency in pricing, and support global trade and industrial production.
8. Insurance and Pension Market
The insurance and pension market plays a stabilizing role in the global financial system by pooling and redistributing risks. Insurance companies and pension funds are major institutional investors in capital and bond markets.
Functions
Provide financial protection against unforeseen losses.
Accumulate long-term savings for retirement.
Channel funds into productive investments through capital markets.
Importance
These markets support long-term financial stability, complementing government welfare systems and reducing the economic impact of uncertainties.
9. Key Global Financial Institutions
The functioning and regulation of global financial markets rely heavily on international and national institutions.
Major Global Institutions
International Monetary Fund (IMF): Ensures global monetary stability, offers financial assistance to countries in crisis.
World Bank: Provides long-term loans and support for economic development.
Bank for International Settlements (BIS): Coordinates among central banks and promotes financial stability.
Financial Stability Board (FSB): Monitors and makes recommendations for global financial regulation.
Regional Development Banks: Such as the Asian Development Bank (ADB) and African Development Bank (AfDB).
National Regulators
U.S.: Securities and Exchange Commission (SEC)
U.K.: Financial Conduct Authority (FCA)
India: Securities and Exchange Board of India (SEBI)
Japan: Financial Services Agency (FSA)
These institutions promote transparency, protect investors, and maintain confidence in the financial system.
10. Global Financial Integration
Over the last few decades, financial globalization has deepened the interconnections between markets. Capital moves freely across borders, driven by liberalization policies, technology, and innovation.
Benefits of Integration
Greater access to capital for developing economies.
Efficient resource allocation.
Risk diversification for investors.
Lower cost of borrowing.
Risks
Contagion effect of financial crises.
Increased volatility and speculative capital flows.
Exposure to global shocks (e.g., 2008 crisis, COVID-19 market crash).
Therefore, effective global coordination and regulatory oversight are essential to balance the benefits of financial integration with the risks of instability.
11. Technological Transformation of Financial Markets
Technological innovation has revolutionized global financial markets:
Algorithmic Trading enables high-speed, automated trading.
Blockchain Technology enhances transparency and reduces transaction costs.
Fintech companies offer digital banking, peer-to-peer lending, and robo-advisory services.
Cryptocurrencies like Bitcoin have introduced decentralized finance (DeFi), challenging traditional systems.
These developments have made markets more accessible and efficient but also raised concerns about cybersecurity, regulatory gaps, and market manipulation.
12. Challenges in Global Financial Markets
Despite progress, the global financial system faces several challenges:
Systemic Risk: Interconnectedness can amplify crises.
Regulatory Arbitrage: Differences in national regulations create loopholes.
Market Volatility: Geopolitical tensions and policy shifts cause price instability.
Climate Finance: Need for green investments to support sustainable growth.
Digital Disruption: Balancing innovation with investor protection.
Addressing these challenges requires coordinated global governance and adaptive policy frameworks.
13. The Role of Emerging Markets
Emerging economies like India, China, Brazil, and Indonesia play a growing role in the global financial system. They attract foreign capital, develop strong financial institutions, and influence commodity and currency markets.
Their inclusion in global indices and financial reforms has diversified global portfolios and increased market depth. However, they remain vulnerable to capital flight, exchange rate shocks, and global interest rate changes.
Conclusion
The global financial market is a dynamic, complex system that channels capital across borders, drives economic growth, and fosters innovation. Its structure—comprising money, capital, forex, derivative, commodity, and insurance markets—forms a cohesive yet intricate network of interdependent segments. Financial institutions, both domestic and international, ensure the system’s stability and transparency.
While globalization and technology have enhanced efficiency and accessibility, they have also introduced new risks that demand vigilant regulation and international cooperation. In the 21st century, the resilience and adaptability of the global financial market will determine not only the prosperity of nations but also the stability of the global economy itself.
Sovereign Debt Explained in the Global MarketIntroduction
Sovereign debt, also known as government debt or public debt, represents the money that a national government borrows to finance its expenditures and obligations. It is one of the most significant pillars of the global financial system, influencing everything from international trade and exchange rates to global market stability and development. Governments borrow to cover budget deficits, fund infrastructure, respond to crises, or stimulate economic growth. The management, structure, and sustainability of sovereign debt play a crucial role in determining a country's economic credibility and its integration into the global market.
In today’s interconnected world, sovereign debt is not an isolated national issue—it has far-reaching implications across borders. When a country defaults or faces a debt crisis, the ripple effects can be felt throughout the international financial system. Therefore, understanding sovereign debt in the context of the global market is essential to comprehend global economic dynamics, investor confidence, and long-term growth prospects.
1. Concept and Nature of Sovereign Debt
Sovereign debt is the total amount of money a government owes to external and internal creditors. It can take the form of bonds, loans, or other financial instruments issued by the government to domestic investors or foreign entities. Governments typically issue sovereign bonds—long-term or short-term securities that promise repayment of principal plus interest—to finance their fiscal needs.
There are two main categories of sovereign debt:
Domestic Debt:
Borrowed in the country’s own currency and often from local financial institutions or citizens. Domestic debt reduces exposure to foreign exchange risks but can crowd out private investment if excessive.
External Debt:
Borrowed from foreign creditors, including international organizations, foreign governments, and investors. It is often denominated in foreign currencies such as the U.S. dollar, euro, or yen. External debt exposes a country to exchange rate risks and global financial fluctuations.
Sovereign debt differs from corporate or personal debt because governments have unique powers—they can print money, tax citizens, and control monetary policy. However, these powers are not limitless, and excessive borrowing can lead to inflation, devaluation, or default.
2. Importance of Sovereign Debt in the Global Market
Sovereign debt plays several crucial roles in the global financial system:
Financing Government Expenditure:
Governments use debt to fund projects that stimulate economic growth—such as infrastructure, education, defense, and social welfare. This borrowing supports public services and long-term development.
Macroeconomic Stability and Fiscal Policy:
Borrowing helps smooth economic cycles. During recessions, governments may borrow more to stimulate demand and reduce unemployment. During booms, they may pay down debt to avoid overheating the economy.
Benchmark for Global Financial Markets:
Sovereign bonds, especially those issued by stable economies (like U.S. Treasury bonds), act as benchmarks for global interest rates. Investors worldwide use these as reference points to assess risk premiums on other assets.
Investment and Safe Haven Asset:
Many institutional investors, including central banks and pension funds, hold sovereign bonds as low-risk investments. U.S., Japanese, and German government bonds are considered “safe haven” assets during global uncertainty.
Indicator of Economic Health:
The level and sustainability of sovereign debt indicate a country’s fiscal health. A high debt-to-GDP ratio may raise concerns about solvency, while moderate debt can signal sound economic management.
3. Globalization and the Expansion of Sovereign Debt Markets
The globalization of finance has transformed sovereign debt markets dramatically. In the 20th and 21st centuries, capital mobility increased, allowing investors to buy foreign government bonds easily. Emerging markets also gained access to international borrowing, leading to a global expansion of sovereign debt.
Some key drivers of this trend include:
Financial Liberalization: Many developing countries opened their capital markets, allowing foreign investors to purchase local government bonds.
Technological Advancements: Digital trading platforms and global financial networks facilitated cross-border investment.
Global Savings Glut: High savings in developed nations, such as Japan and China, increased the demand for sovereign debt from other countries.
Monetary Policy in Advanced Economies: Low interest rates in developed countries pushed investors to seek higher yields in emerging markets, expanding their sovereign bond markets.
As a result, sovereign debt has become deeply intertwined with global capital flows. Investors in one country routinely hold the debt of others, linking their financial fortunes. This interdependence strengthens global economic cooperation but also amplifies systemic risks.
4. Determinants of Sovereign Debt Sustainability
The sustainability of sovereign debt depends on whether a government can service its obligations without resorting to excessive borrowing or risking default. Key determinants include:
Debt-to-GDP Ratio:
A widely used measure of a country’s debt burden. A high ratio may indicate financial strain, but the threshold varies across countries depending on growth rates and interest costs.
Interest Rate and Growth Differential:
If economic growth exceeds the interest rate on debt, the debt ratio tends to stabilize or decline over time. Conversely, if interest rates rise faster than growth, debt can become unsustainable.
Fiscal Balance:
Governments with persistent fiscal deficits (spending exceeding revenue) may accumulate unsustainable debt levels.
Exchange Rate Stability:
For countries with large external debt denominated in foreign currencies, exchange rate depreciation can inflate the debt burden.
Investor Confidence:
Global investors’ perception of a country’s economic management directly affects borrowing costs. Confidence can be influenced by political stability, monetary policy, and institutional credibility.
Debt Structure and Maturity Profile:
Short-term or variable-rate debt poses higher rollover and interest rate risks than long-term, fixed-rate debt.
5. Sovereign Debt Crises: Causes and Consequences
Sovereign debt crises occur when governments cannot meet their debt obligations, either through repayment or servicing interest. Such crises can arise due to poor fiscal management, external shocks, or global financial contagion.
Major Causes:
Excessive borrowing during boom periods followed by economic downturns.
Currency mismatches between debt and revenue.
Sudden stops in capital inflows or rising global interest rates.
Political instability and policy mismanagement.
Consequences:
Default and Restructuring: Governments may renegotiate terms with creditors or suspend payments temporarily.
Economic Recession: Austerity measures to reduce debt often suppress growth and increase unemployment.
Inflation and Currency Collapse: If debt is monetized (financed by printing money), it can lead to hyperinflation.
Loss of Credibility: A country’s access to international markets diminishes, raising borrowing costs for years.
Historical Examples:
Latin American Debt Crisis (1980s): Triggered by rising U.S. interest rates and oil price shocks.
Asian Financial Crisis (1997): Currency collapses led to debt defaults in several Asian economies.
Greek Debt Crisis (2010s): Excessive government spending and structural inefficiencies led to massive bailouts from the EU and IMF.
Argentina (multiple defaults): Chronic fiscal mismanagement and political instability have caused repeated sovereign defaults.
6. Role of International Institutions in Sovereign Debt Management
Institutions such as the International Monetary Fund (IMF), World Bank, and regional development banks play vital roles in managing sovereign debt crises and promoting fiscal stability.
IMF: Provides financial assistance and policy advice to countries facing balance-of-payments or debt crises. Its programs often come with fiscal and structural reform conditions.
World Bank: Focuses on long-term development financing and helps countries design sustainable debt management strategies.
Paris Club and London Club: Groups of official and private creditors that coordinate debt restructuring efforts for distressed sovereign borrowers.
Credit Rating Agencies (CRAs): Agencies like Moody’s, S&P, and Fitch assess sovereign creditworthiness, influencing borrowing costs in the global market.
These institutions aim to ensure that countries maintain fiscal discipline while providing relief during crises. However, critics argue that their policies sometimes prioritize creditor interests over social welfare, especially through austerity measures.
7. Sovereign Debt and Emerging Markets
Emerging markets have become significant participants in the global sovereign debt landscape. Countries like India, Brazil, Indonesia, and South Africa issue bonds in both domestic and international markets. While this enhances their access to capital, it also exposes them to global volatility.
Challenges Faced by Emerging Economies:
Currency risk due to foreign-denominated debt.
Limited investor confidence compared to developed nations.
Higher borrowing costs and vulnerability to global interest rate changes.
Political and policy uncertainties affecting credit ratings.
Despite these challenges, emerging market sovereign bonds attract global investors seeking higher yields, contributing to portfolio diversification.
8. The Future of Sovereign Debt in the Global Market
As the global economy evolves, the nature of sovereign debt is also transforming. Several trends are shaping its future:
Rising Global Debt Levels:
The COVID-19 pandemic and subsequent fiscal stimulus programs have driven global public debt to record highs, surpassing 100% of global GDP in many advanced economies.
Green and Sustainable Bonds:
Many governments now issue green bonds to finance environmentally sustainable projects. These instruments align debt issuance with climate goals and attract ESG-focused investors.
Digitalization and Transparency:
Blockchain technology and digital platforms are enhancing debt transparency, improving trust and efficiency in bond markets.
Geopolitical Shifts:
Rivalries among major economies, such as the U.S. and China, are influencing global debt markets through changes in capital flows and currency alignments.
Debt Relief and Restructuring Mechanisms:
Post-pandemic, international cooperation has increased to support low-income countries through debt relief initiatives like the G20 Common Framework.
Conclusion
Sovereign debt is both a tool of economic development and a potential source of financial instability. In the global market, it functions as a key instrument for investment, fiscal policy, and international cooperation. Properly managed, it enables nations to build infrastructure, stimulate growth, and enhance welfare. Mismanaged, it can trigger crises that ripple across the world economy.
The challenge for policymakers is to maintain a balance—borrowing enough to foster development while ensuring sustainability and market confidence. As the global financial landscape evolves, transparency, innovation, and prudent fiscal governance will determine how effectively sovereign debt continues to serve as a cornerstone of the global economy.

Tutorial on Andrews Pitchfork on AlibabaThis is an analysis of Alibaba stock using the Andrews pitchfork.

Types of Global Trade WarIntroduction
A global trade war occurs when nations impose tariffs, quotas, or other trade barriers against each other in retaliation for perceived unfair trade practices. These conflicts often stem from disputes over trade imbalances, currency manipulation, intellectual property theft, or protectionist policies. In a world where globalization has tightly interconnected economies, trade wars can have far-reaching consequences—affecting industries, consumers, financial markets, and diplomatic relations.
Trade wars are not new. From the Smoot-Hawley Tariff Act of 1930 in the United States to the U.S.-China trade conflict that began in 2018, the concept has evolved alongside the global economy. Today’s trade wars extend beyond simple tariff disputes to include technology restrictions, digital trade barriers, and strategic economic decoupling. Understanding the types of trade wars helps explain how economic competition shapes global power dynamics.
1. Tariff-Based Trade Wars
Definition
Tariff-based trade wars occur when countries impose import duties (taxes) on foreign goods to protect domestic industries or punish other nations. These tariffs make imported goods more expensive, discouraging their purchase and promoting local alternatives.
Characteristics
Involves direct taxation on goods crossing borders.
Often used as retaliation for another nation’s tariffs.
Creates immediate effects on global prices and supply chains.
Examples
U.S.–China Trade War (2018–2020): The United States imposed tariffs on over $360 billion worth of Chinese imports, while China retaliated with tariffs on U.S. agricultural and industrial products.
EU–U.S. Steel and Aluminum Dispute (2018): The U.S. imposed tariffs of 25% on steel and 10% on aluminum imports, claiming national security reasons. The European Union retaliated with tariffs on American goods like motorcycles and whiskey.
Impact
Tariff-based wars often lead to:
Increased consumer prices.
Disrupted supply chains.
Decreased global trade volumes.
Shifts in investment and manufacturing to non-tariff countries.
2. Non-Tariff Barrier Trade Wars
Definition
A non-tariff trade war uses regulatory restrictions instead of tariffs to limit trade. These may include import quotas, licensing requirements, product standards, or environmental regulations that disadvantage foreign companies.
Characteristics
Harder to identify and measure than tariffs.
Often justified as “safety” or “environmental” measures.
Can be used strategically to block competition.
Examples
Japan vs. U.S. Auto Disputes (1980s): Japan used strict safety and emissions standards to limit American car imports.
European Union’s Agricultural Rules: The EU’s regulations on genetically modified foods and pesticide use often act as barriers against U.S. agricultural exports.
Impact
Creates uncertainty for exporters.
Increases compliance costs.
Favors domestic industries under the guise of regulation.
3. Currency Manipulation and Exchange Rate Wars
Definition
Currency wars, also known as competitive devaluation, occur when countries intentionally devalue their currencies to make exports cheaper and imports more expensive, thus improving their trade balance.
Characteristics
Typically involves central banks or monetary authorities.
May lead to inflation or financial instability.
Can escalate into broader economic and geopolitical conflict.
Examples
China’s Yuan Policy (2000s): The U.S. accused China of keeping its currency artificially low to boost exports.
Global “Currency War” of 2010: Countries like Japan and Brazil intervened in foreign exchange markets to weaken their currencies after the U.S. Federal Reserve launched quantitative easing.
Impact
Encourages retaliatory devaluations.
Destabilizes global currency markets.
Reduces investor confidence.
May trigger capital flight from emerging markets.
4. Technology and Digital Trade Wars
Definition
In the 21st century, technology trade wars have emerged as a new front in global economic competition. These involve restrictions on data, technology exports, intellectual property rights, and the dominance of tech giants.
Characteristics
Focuses on control of strategic technologies like semiconductors, AI, and 5G.
Often framed as national security or data protection issues.
Targets specific companies rather than entire industries.
Examples
U.S.–China Tech Conflict: The U.S. restricted companies like Huawei and ZTE from accessing American technologies, citing security concerns. It also banned chip exports to China for advanced computing.
EU Digital Services Act (DSA): The European Union has imposed strict digital market regulations, often seen as targeting U.S. tech firms such as Google, Meta, and Amazon.
Impact
Fragmentation of global technology supply chains.
Slower innovation due to reduced collaboration.
Strategic decoupling between the U.S. and China in the semiconductor and AI sectors.
5. Resource and Commodity Trade Wars
Definition
These wars focus on critical natural resources—such as oil, gas, rare earth metals, or food—used as economic or political leverage.
Characteristics
Resource-rich nations restrict exports to gain political influence.
Import-dependent countries seek diversification or self-sufficiency.
Often intertwined with geopolitical tensions.
Examples
OPEC Oil Embargo (1973): Arab nations cut oil exports to the U.S. and other Western countries supporting Israel, leading to a global energy crisis.
China’s Rare Earth Export Controls (2010): China restricted exports of rare earth minerals crucial for electronics, targeting Japan after a territorial dispute.
Russia–Europe Gas Conflict (2022): Following the invasion of Ukraine, Russia reduced gas supplies to Europe, triggering an energy crisis and forcing European nations to find alternatives.
Impact
Sharp commodity price fluctuations.
Inflationary pressures globally.
Strategic realignments in energy and resource supply chains.
6. Agricultural and Food Trade Wars
Definition
Agricultural trade wars arise when countries impose restrictions or subsidies on food and farm products to protect domestic farmers or retaliate against other nations’ policies.
Characteristics
Often involves perishable goods like grains, meat, and dairy.
Highly political due to its effect on farmers and food security.
Influenced by health, safety, and environmental standards.
Examples
U.S.–EU Beef Hormone Dispute: The EU banned beef treated with growth hormones, while the U.S. claimed this violated World Trade Organization (WTO) rules.
India’s Rice and Wheat Export Bans (2022–2024): India limited exports to control domestic prices, impacting global food markets.
U.S.–China Agricultural Tariffs: China imposed tariffs on U.S. soybeans during the 2018 trade war, hurting American farmers.
Impact
Global food price volatility.
Disruption of agricultural supply chains.
Rising risk of food insecurity in developing nations.
7. Sanctions and Trade Embargoes
Definition
Trade sanctions and embargoes are political tools where nations restrict trade with specific countries to pressure them into policy changes. These are often unilateral or coalition-based rather than purely economic measures.
Characteristics
Used as instruments of foreign policy.
Target sectors like defense, energy, or finance.
Can be partial (targeted sanctions) or complete (full embargo).
Examples
U.S. Sanctions on Iran: Targeted Iran’s oil exports and financial transactions to curb its nuclear program.
Western Sanctions on Russia (2022): Following the invasion of Ukraine, Western nations imposed sweeping sanctions on Russian banks, oil companies, and oligarchs.
Cuba Embargo: The U.S. trade embargo on Cuba, in place since the 1960s, remains one of the longest-running in history.
Impact
Severe economic damage to targeted countries.
Global supply chain disruptions.
Emergence of black markets and sanction evasion networks.
8. Subsidy and Dumping Wars
Definition
Subsidy wars occur when governments financially support domestic industries to make their products cheaper internationally. Dumping happens when a country exports goods at below-market prices to gain unfair advantage.
Characteristics
Violates fair trade principles under WTO rules.
Leads to retaliatory tariffs and anti-dumping duties.
Common in sectors like steel, solar panels, and agriculture.
Examples
China’s Steel and Solar Subsidies: China has been accused by the U.S. and EU of subsidizing its steel and solar industries, flooding global markets.
Boeing vs. Airbus Dispute: The U.S. and EU accused each other of illegally subsidizing their aerospace giants, leading to WTO arbitration.
Impact
Market distortions and overcapacity.
Trade tensions within global manufacturing networks.
Long-term damage to fair competition.
9. Digital and Data Sovereignty Trade Wars
Definition
Digital trade wars revolve around data localization, privacy laws, and control over digital infrastructure. Governments use these measures to assert sovereignty over cyberspace and digital economies.
Characteristics
Focuses on control of citizens’ data and digital ecosystems.
Involves laws restricting cross-border data flows.
Part of broader efforts to reduce dependency on foreign technology.
Examples
EU’s GDPR (General Data Protection Regulation): Imposes strict data rules affecting U.S. tech companies operating in Europe.
India’s Data Localization Policy: Requires foreign companies to store user data locally, creating tensions with the U.S. tech industry.
China’s Cybersecurity Law: Restricts foreign companies’ access to Chinese digital markets.
Impact
Fragmentation of the global internet (“splinternet”).
Rising compliance costs for tech companies.
Reduced cross-border digital innovation.
10. Environmental and Green Trade Wars
Definition
As nations transition toward sustainable economies, green trade wars arise when environmental policies create new trade barriers or advantages.
Characteristics
Based on carbon emissions, climate regulations, and renewable technologies.
Can penalize “dirty” industries or reward green production.
Intersects with industrial and climate policy.
Examples
EU Carbon Border Adjustment Mechanism (CBAM): Imposes tariffs on imports from countries with weaker climate regulations.
U.S. Inflation Reduction Act (2022): Offers subsidies for domestic clean energy industries, criticized by the EU as protectionist.
China’s Solar Dominance: Accusations of unfair advantages in solar manufacturing due to state subsidies.
Impact
Reshapes global energy and industrial competition.
Encourages climate-friendly innovation.
Risk of conflict between developed and developing nations over “green protectionism.”
Conclusion
Global trade wars have evolved from simple tariff disputes to multifaceted economic conflicts involving technology, digital data, energy, and environmental policy. Each type—whether tariff-based, technological, or green—reflects deeper struggles for economic dominance, national security, and strategic autonomy.
While trade wars may provide short-term domestic protection, they often harm global growth, increase inflation, and reduce consumer welfare. Modern economies are too interconnected for isolationist strategies to succeed without consequences. The challenge for policymakers lies in balancing national interests with global cooperation—ensuring that competition fosters innovation rather than conflict.
Ultimately, understanding the types of global trade wars helps policymakers, investors, and citizens grasp how economic rivalries shape the future of globalization, technology, and international relations.
3 Common Trading Mistakes Traders Should AvoidTraders of all levels, from beginners to experienced professionals, can fall prey to psychological mistakes that can lead to poor trading decisions and ultimately, losses. Understanding and avoiding these common mistakes is crucial for developing a sound trading strategy and achieving consistent success in the markets.
Here are three of the most prevalent trading mistakes traders should strive to avoid:
FOMO (Fear of Missing Out): FOMO is a pervasive emotion that can cloud traders' judgment and lead them to make impulsive decisions based on the fear of missing out on potential profits. This often involves chasing trends or entering trades without proper analysis, increasing the risk of losses.
To combat FOMO, traders should adhere to their trading plan, prioritize discipline, and focus on identifying high-probability trading opportunities rather than reacting to market movements out of fear.
Revenge Trading: Revenge trading is the emotional urge to recoup losses from previous trades by making hasty and ill-advised decisions. This often stems from a desire to prove one's rightness or regain a sense of control over the market.
To avoid revenge trading, traders should cultivate emotional detachment, accept losses as a natural part of trading, and avoid the temptation to let emotions dictate their trading decisions.
Gambler's Fallacy: The gambler's fallacy is the mistaken belief that past events influence the outcome of future events, leading to an assumption that trends will continue indefinitely or that random events can be predicted.
To overcome the gambler's fallacy, traders should recognize that each trade is an independent event with its own unique probabilities, and past performance is not a guarantee of future results. They should rely on sound trading analysis and risk management techniques rather than relying on hunches or superstitions.
By avoiding these common psychological mistakes, traders can develop a more disciplined and rational approach to trading, increasing their chances of achieving long-term success in the markets.
How to Generate More Profits During Earnings SeasonWho is in control of Price on the Day of the Earnings season CEO reports requires studying the stock chart 2-4 weeks ahead of the estimated date of the report.
Smaller Funds activity will disrupt runs intraday.
Professional Trading Companies are very active.
HFTs AI are making huge errors causing whipsaw action.
Buy Side has slowed and paused its accumulation in many stocks.

Something worth learning If you connect the dots together you'll see it matches trendlines and zones and also having multiple confluence in trading will give you an edge in the market
So many ways and strategies out there.
Break and retest is one of them it's simple and effective
I use Break and retest and others like RSI
The blck lines represent zones and if you check my entry and exit you'll see zones
Also on the RSI the exit is below 30% while the entry if above 70%
Note: sometimes RSI can be above 70% and below 30% for a long time doesn't it will reverse
That's why you use other confluences like strong zone or trendline
Don't just trade with OVERBOUGHT AND OVERSOLD
If this was helpful
Drop a like and comment 👍
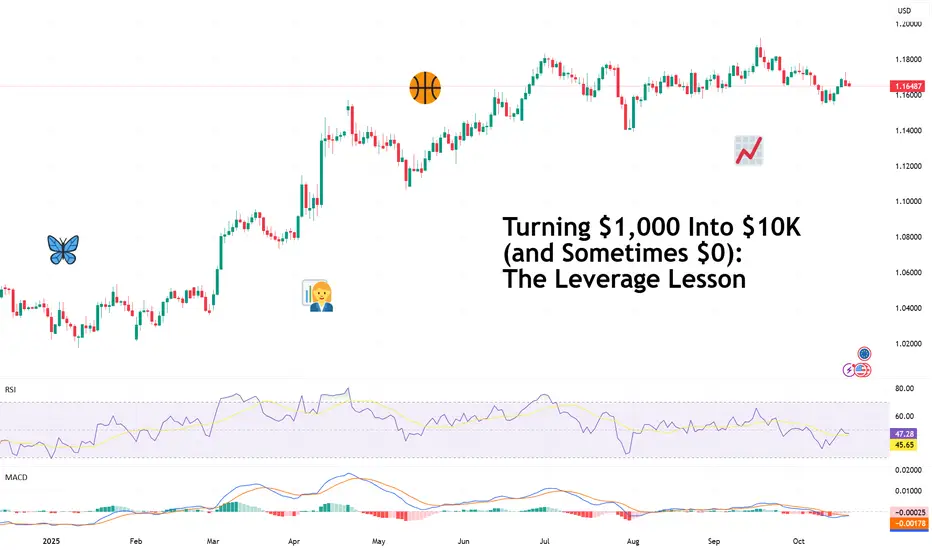
Turning $1,000 Into $10K (and Sometimes $0): The Leverage LessonEvery trader remembers their first brush with leverage — that magical moment when a modest account suddenly feels like a hedge fund.
You deposit $1,000, pop open TradingView, find your broker of choice , and boom — your buying power jumps to $30,000. You feel unstoppable as you imagine all the profits waiting for you out there.
And for a few moments, it works. A 1% move in your favor turns into a 30% gain. You start browsing for a new watch and a place in downtown Lisbon. But as every bruised and battered trader learns, leverage giveth and leverage obliterateth . That same 1% move against you? Game over.
Leverage is the financial equivalent of a sports car: thrilling, powerful, and incredibly dangerous in the wrong hands. Which, let’s be honest, most of us have been at some point.
If you take away anything from this piece, let it be this: if you wipe out 50% of your account, say, go from $1,000 to $500, it will take a 100% gain for you to get back even.
🧨 The Math That Makes (and Breaks) You
What exactly is leverage and what does it do? Leverage simply means you’re borrowing money to amplify your position size. A 1:10 ratio gives you control over $10,000 with just $1,000 of your own capital. The catch? You’re still responsible for all of it — the profits and the losses.
Here’s a general example:
• $1,000 with 1:10 leverage = $10,000 position.
• The market moves +1% = $100 profit. Nice.
• The market moves -1% = $100 loss. Manageable.
• The market moves -10%? That’s your entire $1,000 gone. Margin call city.
The higher your leverage, the narrower your margin for error. One bad candle, one unexpected news release , one mistimed coffee break when you’ve just loaded up ( during earnings , for example) and your performance can become a case study in volatility.
🧠 The Psychology of “More”
Here’s where it gets interesting: most traders don’t blow up their accounts because they misunderstand leverage — they blow up because they only think about the upside, how much they can make.
Leverage feeds every dangerous trading instinct: impatience, overconfidence, revenge trading, FOMO. “Next time we go bigger. Double down. We can make it back.” It makes rational risk management feel boring — and boredom, especially for a new trader, is unbearable.
Successful traders learn to see leverage for what it is: a tool, not a ticket. They understand that doubling down rarely doubles results, and that a steady pace — not speed — is the name of the game.
💡 The Smart Way to Use Leverage
So how do you wield this double-edged sword without losing a hand?
• Start small . New traders shouldn’t touch anything above 1:10 until they’ve mastered consistency.
Even pros rarely use their full leverage. And in the rare instances where they do, it usually ends up with a blowup. If you’d like to read up on the topic, Archegos Capital and LTCM are a good place to start.
• Use stop-losses religiously . A good stop-loss isn’t weakness; it’s insurance.
• Don’t equate margin with opportunity . Just because you can open a $50,000 position doesn’t mean you should.
• Think in percentages, not dollars . Most experienced traders aim to risk no more than 1–3% of their total equity per trade.
• Treat leverage like caffeine . A little sharpens focus. Too much and your hands start shaking and you lose sleep.
Leverage done right is a powerful tool that can help you get to your goals faster, smarter, and with fewer trades. But it can turn against you if you let it.
🪞 The Moral of the Margin Story
Leverage doesn’t make you a better trader. It makes your habits louder. If you trade emotionally, it amplifies your mistakes. If you trade methodically, it amplifies your discipline.
So yes, leverage can turn $1,000 into $10K — or into an expensive lesson in risk management. The deciding factor isn’t the multiplier on your screen; it’s the mindset behind your mouse.
In the end, trading is less about flexing your buying power and more about staying long enough to use it wisely.
Stay sharp, stay humble.
Off to you : What leverage do you usually use? Do you prefer to go 1:30 into forex or 1:10 into equities? Share your approach in the comments!
HOW-TO: Trade-o-Scope Plot Custom Data v2This is a short HOW-TO on using the Trade-o-Scope "Plot Custom Data v2" indicator

Competitive Currency War: An In-Depth AnalysisIntroduction
A competitive currency war, often termed a currency devaluation war, refers to a situation where countries deliberately devalue their currencies to gain a trade advantage over others. In essence, nations engage in a race to weaken their currencies to make exports cheaper and imports costlier, thereby stimulating domestic production and employment. However, while it may provide short-term gains to an individual nation, a widespread currency war can destabilize the global economy, heighten financial volatility, and strain international relations.
The term “currency war” became popular after Brazil’s finance minister Guido Mantega used it in 2010 to describe the growing wave of monetary interventions by major economies after the global financial crisis. Since then, the world has witnessed multiple instances of competitive devaluations, especially during times of economic stress—such as the 2008 crisis, the U.S.–China trade war, and the post-COVID recovery phase.
This essay explores the origins, mechanisms, historical examples, implications, and future trajectory of currency wars in an increasingly globalized and digital financial environment.
1. The Concept and Mechanics of Currency War
A currency war typically arises when multiple countries attempt to depreciate their currencies simultaneously to gain a competitive edge. The underlying mechanism involves monetary policy tools, foreign exchange interventions, and fiscal adjustments.
1.1 Key Mechanisms
Monetary Easing:
Central banks reduce interest rates or adopt quantitative easing (QE) to increase liquidity. Lower interest rates tend to weaken the currency, making exports cheaper.
Foreign Exchange Intervention:
Governments or central banks directly buy foreign currencies (like the U.S. dollar) while selling their own currency to suppress its value in the forex market.
Capital Controls:
Some nations impose restrictions on foreign capital inflows to prevent their currency from appreciating excessively.
Fiscal Expansion:
By increasing government spending or subsidies on export sectors, governments can indirectly stimulate output and trade competitiveness.
1.2 The Economic Logic
The basic idea is simple: if a country’s currency is cheaper relative to others, its exports become more competitive globally, while imports become more expensive. This can improve the trade balance, boost GDP, and create employment. However, this logic fails when every nation follows the same strategy — leading to global instability and inflationary pressures.
2. Historical Background of Currency Wars
Currency wars are not a new phenomenon. They have shaped the global economic order for more than a century, reflecting the interplay between national interests and international stability.
2.1 The Interwar Period (1920s–1930s)
Following World War I, countries abandoned the gold standard to devalue their currencies and support domestic recovery. The United Kingdom’s decision to leave the gold standard in 1931 triggered a wave of competitive devaluations, with nations like the U.S. and France soon following. The result was chaotic: trade collapsed, global demand shrank, and the Great Depression deepened.
2.2 The Bretton Woods System (1944–1971)
In response to interwar chaos, the Bretton Woods Agreement established a system of fixed exchange rates anchored to the U.S. dollar, which itself was convertible to gold. This arrangement aimed to stabilize exchange rates and prevent competitive devaluations. However, by the late 1960s, U.S. fiscal imbalances (due to the Vietnam War and social spending) eroded confidence in the dollar, leading President Richard Nixon to end gold convertibility in 1971 — effectively collapsing the system.
2.3 The 1980s: The Dollar and the Plaza Accord
During the early 1980s, the U.S. dollar surged due to tight monetary policy under Paul Volcker and Reagan-era fiscal expansion. This appreciation hurt U.S. exports and created large trade deficits, prompting the 1985 Plaza Accord. Under this agreement, major economies — the U.S., Japan, West Germany, France, and the U.K. — coordinated to weaken the dollar through joint interventions. This is one of the most successful examples of coordinated currency management in modern history.
2.4 The 2008 Global Financial Crisis and Modern Currency Wars
After 2008, central banks worldwide adopted ultra-loose monetary policies, driving down interest rates and flooding markets with liquidity. The U.S. Federal Reserve’s quantitative easing was followed by similar measures in Europe and Japan. Emerging markets, especially Brazil and China, accused developed nations of starting a “currency war” by artificially suppressing exchange rates through excessive money printing.
2.5 The 2010s: U.S.–China Currency Tensions
China was often accused of manipulating its currency, the yuan, to maintain export competitiveness. The U.S. claimed that China’s undervalued yuan hurt American manufacturing. Although China gradually allowed more flexibility in its exchange rate, tensions resurfaced during the Trump administration, when tariffs and currency rhetoric became central tools in the trade war.
3. The Economic Consequences of Currency Wars
While currency devaluation may offer short-term benefits, its long-term consequences are often counterproductive for both domestic and global economies.
3.1 Short-Term Gains
Boost in Exports:
A weaker currency makes exports more affordable in global markets, improving trade balances.
Inflation Control (in Deflationary Contexts):
Devaluation can prevent deflation by raising import prices, stimulating spending and investment.
3.2 Long-Term Costs
Imported Inflation:
Weaker currencies make imports more expensive, leading to rising prices for essential goods such as energy, food, and technology.
Erosion of Investor Confidence:
Persistent devaluation discourages foreign investment, as investors fear currency losses.
Retaliatory Policies:
Competing nations may also devalue their currencies, neutralizing any advantage and sparking global instability.
Debt Burden Escalation:
Countries with high levels of foreign-denominated debt face higher repayment costs when their currencies fall.
Global Imbalances:
Uncoordinated devaluations can distort trade flows and fuel protectionism, undermining international cooperation.
4. Modern Dynamics: Currency Wars in the Digital Era
In the 21st century, currency wars have become more complex, influenced by technological innovation, digital finance, and geopolitical realignments.
4.1 Central Bank Digital Currencies (CBDCs)
The rise of CBDCs — digital forms of fiat currency issued by central banks — could transform how nations compete monetarily. For instance, China’s digital yuan (e-CNY) aims to internationalize its currency and reduce dependence on the U.S. dollar-dominated SWIFT system. This digital shift introduces new dimensions of currency competition based on technological infrastructure and cross-border payment dominance.
4.2 Artificial Intelligence and Algorithmic Trading
AI-driven trading systems now play a significant role in foreign exchange markets, amplifying the speed and scale of currency adjustments. Automated capital flows can accelerate devaluations or appreciations beyond the control of policymakers, increasing market volatility.
4.3 The De-Dollarization Movement
Many emerging economies are actively seeking to reduce dependence on the U.S. dollar for international trade. BRICS nations — Brazil, Russia, India, China, and South Africa — have proposed alternative payment mechanisms and a potential shared currency. This shift poses a strategic challenge to U.S. monetary dominance and adds a new layer to currency competition.
4.4 Geopolitical Dimensions
Currency strategies increasingly intersect with geopolitics. Sanctions, trade restrictions, and financial exclusion (as seen with Russia post-Ukraine conflict) have turned monetary tools into instruments of geopolitical power. As countries seek to protect their financial sovereignty, competitive currency strategies are becoming more politically motivated.
5. Case Studies of Recent Currency Conflicts
5.1 Japan’s Abenomics (2013–2020)
Under former Prime Minister Shinzo Abe, Japan implemented aggressive monetary easing to fight deflation and revive growth. The Bank of Japan’s asset purchases significantly weakened the yen, boosting exports but drawing criticism from trade partners who viewed it as a form of currency manipulation.
5.2 U.S.–China Trade and Currency Tensions
In 2019, the U.S. Treasury officially labeled China a “currency manipulator” after the yuan fell past the symbolic 7-per-dollar level. Although the label was later removed, it highlighted the deep-rooted suspicions surrounding exchange rate practices and the link between trade policy and currency valuation.
5.3 Emerging Market Vulnerabilities
Countries like Argentina and Turkey have repeatedly used currency depreciation as a policy tool, often resulting in runaway inflation and capital flight. These cases illustrate how uncoordinated devaluations can spiral into economic crises if not supported by structural reforms.
6. Policy Responses and Global Coordination
To mitigate the risks of currency wars, international coordination is essential. Several mechanisms have evolved to maintain monetary stability:
International Monetary Fund (IMF):
The IMF monitors exchange rate policies and provides financial assistance to stabilize economies under currency pressure.
G7 and G20 Frameworks:
These platforms promote policy coordination among major economies to prevent destructive currency competition.
Regional Arrangements:
Asian and European monetary frameworks (like the European Monetary System) have been developed to ensure exchange rate stability within regions.
Transparency and Communication:
Clear communication from central banks regarding policy objectives can help reduce market misinterpretation and speculative attacks.
However, in practice, such coordination is often difficult to sustain, as nations prioritize domestic growth over global harmony.
7. The Future of Currency Wars
The future of competitive currency strategies will depend on several evolving trends:
Digitalization of Money:
CBDCs and blockchain-based financial systems could shift competitive dynamics from traditional exchange rate manipulation to digital payment dominance.
De-Dollarization and Multipolarity:
The gradual emergence of alternative global currencies — like the yuan, euro, and rupee — could weaken the dollar’s monopoly, creating a more fragmented but competitive global system.
Climate and Economic Resilience:
Currency policies may increasingly align with sustainability objectives, as nations consider the long-term environmental implications of growth-driven devaluations.
AI-Driven Monetary Forecasting:
Artificial intelligence may enable more precise, data-driven currency management — reducing human error but possibly intensifying algorithmic competition.
Conclusion
The competitive currency war embodies the tension between national economic goals and global financial stability. While currency devaluation can temporarily stimulate exports and growth, it often triggers retaliation, inflation, and uncertainty — eroding trust in international systems. History shows that no country truly “wins” a currency war; all participants eventually bear the costs through reduced global trade, volatility, and weakened economic cooperation.
In the modern era, with digital currencies, AI-driven finance, and shifting geopolitical alliances, currency competition is evolving beyond traditional devaluation. The challenge for policymakers lies in balancing national interest with collective responsibility. Only through transparent policies, cooperative frameworks, and digital innovation can the world avoid sliding into another era of destructive monetary rivalry.
De-Dollarization and the Emerging Global Currency WarIntroduction
For over seven decades, the U.S. dollar has been the backbone of the global financial system. It serves as the world’s dominant reserve currency, the primary medium of exchange in international trade, and the benchmark for commodities such as oil and gold. However, in recent years, a powerful shift has been gaining momentum—de-dollarization, a global trend in which nations seek to reduce their reliance on the U.S. dollar in favor of alternative currencies or mechanisms of trade. This movement is not merely economic; it carries profound geopolitical implications, signaling a potential currency war that could reshape the global monetary order.
De-dollarization has been driven by a combination of strategic, economic, and political motivations—ranging from the desire for financial sovereignty and protection from U.S. sanctions to the ambition of rising powers like China and Russia to challenge the dollar’s hegemony. As this shift accelerates, global markets, trade systems, and geopolitical alliances are being redefined.
Historical Background: How the Dollar Became Dominant
The dollar’s supremacy began after World War II, when the Bretton Woods Agreement (1944) established the U.S. dollar as the anchor of the international monetary system. Under this system, the dollar was pegged to gold at $35 per ounce, and other currencies were tied to the dollar. This arrangement created a foundation for global trade stability and positioned the U.S. as the world’s economic leader.
After the collapse of the Bretton Woods system in 1971, when President Richard Nixon ended the dollar’s convertibility to gold, the world transitioned to a fiat currency system. Despite this, the dollar retained its dominance due to several factors:
The U.S. economy’s size and stability.
The depth and liquidity of U.S. financial markets.
The role of the dollar in global trade, particularly in oil transactions (the "petrodollar system").
The trust in U.S. institutions and political stability.
These elements allowed the U.S. to maintain what many economists call an “exorbitant privilege”—the ability to print the world’s reserve currency, borrow cheaply, and influence global financial flows.
The Roots of De-Dollarization
The movement toward de-dollarization did not happen overnight. It is the result of cumulative tensions and global transformations over the past two decades. Several major developments have fueled this shift:
1. U.S. Sanctions and Financial Weaponization
The United States has frequently used its control over the global financial system as a tool of foreign policy. Countries like Russia, Iran, Venezuela, and China have faced economic sanctions that restrict their access to dollar-based systems such as SWIFT (the Society for Worldwide Interbank Financial Telecommunication). This has motivated these nations to develop alternative payment systems and trade arrangements that bypass the dollar.
2. The Rise of Multipolar Geopolitics
The post-Cold War era saw the U.S. as the sole superpower. However, the 21st century has ushered in a multipolar world, with China, Russia, India, and regional alliances (like BRICS and ASEAN) asserting greater influence. These nations aim to diversify their reserves and promote the use of their own currencies in international trade, challenging U.S. financial dominance.
3. The Decline of Trust in U.S. Fiscal Policy
Massive U.S. debt levels, persistent fiscal deficits, and the use of the dollar as a domestic political tool have raised concerns among global investors. The dollar’s long-term stability has been questioned as the U.S. continues to issue trillions in debt, leading to fears of inflation and currency depreciation.
4. Technological and Financial Innovations
The rise of digital currencies, blockchain technology, and central bank digital currencies (CBDCs) offers nations new tools to settle international transactions without relying on the U.S. dollar. China, for example, has launched the digital yuan (e-CNY), which could become a key instrument in cross-border trade within the Belt and Road Initiative.
Key Players in the De-Dollarization Movement
1. China
China is the leading force behind de-dollarization. Its goals are twofold: reduce dependence on the U.S. financial system and elevate the renminbi (yuan) as a global currency.
China has signed bilateral currency swap agreements with over 40 countries.
The Petro-yuan—China’s push to settle oil contracts in yuan—has gained traction, particularly with Russia, Iran, and Saudi Arabia.
The Belt and Road Initiative (BRI) also promotes trade in local currencies.
The launch of Cross-Border Interbank Payment System (CIPS) serves as an alternative to SWIFT.
2. Russia
Since facing Western sanctions after the annexation of Crimea in 2014—and more aggressively after the 2022 invasion of Ukraine—Russia has led efforts to abandon the dollar in trade and reserves.
Moscow now settles most of its energy exports with China and India in yuan, rubles, or rupees.
Russia’s central bank has drastically reduced its dollar holdings, replacing them with gold and Chinese currency.
The Kremlin has been actively promoting BRICS financial cooperation to build a non-dollar-based monetary framework.
3. BRICS Bloc
The BRICS alliance (Brazil, Russia, India, China, and South Africa)—expanded in 2024 to include nations like Saudi Arabia, Iran, and the UAE—is exploring the creation of a common reserve currency or digital settlement unit. This currency, backed by a basket of commodities or national currencies, could eventually rival the dollar in trade among emerging economies.
4. Middle East and Africa
Oil producers in the Gulf Cooperation Council (GCC), notably Saudi Arabia, have begun accepting non-dollar payments for oil exports. The Saudi-China oil settlement in yuan marks a historic break from the petrodollar era. Similarly, African nations are exploring local currency trade mechanisms to reduce dollar dependency.
Mechanisms of De-Dollarization
De-dollarization is taking place through multiple channels, including:
Bilateral trade settlements using local currencies (e.g., India-Russia trade in rupees and rubles).
Reserve diversification by central banks—reducing U.S. Treasury holdings and increasing gold or other currency reserves.
Alternative payment systems, such as China’s CIPS, Russia’s SPFS, and regional financial networks.
Commodity pricing reforms, particularly in energy markets, moving away from the dollar standard.
Use of CBDCs and digital assets for cross-border transactions.
The Emerging Currency War
The term “currency war” refers to the competition among nations to devalue or manipulate their currencies for trade advantages or to gain influence in global finance. In the modern context, it has evolved into a geostrategic battle for monetary dominance—a conflict over who controls the mechanisms of trade and capital flow.
1. U.S. Response
The U.S. continues to leverage its financial institutions, global alliances, and sanctions power to maintain dollar dominance. Washington’s focus remains on safeguarding the dollar’s role as the world’s reserve currency, but growing deficits and domestic political polarization may weaken its position.
2. China’s Monetary Strategy
China’s approach is subtle but strategic. It does not aim to immediately dethrone the dollar but rather build parallel systems that gradually erode the dollar’s centrality. Through regional trade blocs, the Asian Infrastructure Investment Bank (AIIB), and digital yuan experiments, Beijing is laying the groundwork for a multipolar financial order.
3. BRICS Common Currency Proposal
If BRICS successfully introduces a shared settlement currency, backed by commodities like gold or oil, it could serve as a credible alternative for trade among emerging markets. This would mark the first real institutional challenge to the dollar since the creation of the euro.
4. U.S.-China Economic Rivalry
The de-dollarization trend is tightly intertwined with the broader U.S.-China geopolitical rivalry. Both nations are competing for technological supremacy, trade dominance, and control over digital financial infrastructure. The outcome of this rivalry will likely define the contours of the 21st-century monetary order.
Economic Implications of De-Dollarization
1. For the United States
Reduced global demand for U.S. Treasuries could push up borrowing costs and weaken fiscal flexibility.
The loss of seigniorage benefits (profits from issuing currency used globally) would strain U.S. finances.
Dollar depreciation could occur if confidence erodes significantly.
However, the U.S. still maintains strong institutional and market trust, which makes a sudden collapse unlikely.
2. For Emerging Economies
De-dollarization could enhance monetary sovereignty and reduce vulnerability to U.S. interest rate policies.
It may stabilize trade between developing nations through local currency settlements.
However, the lack of liquidity and convertibility of alternative currencies poses short-term challenges.
Coordination issues among BRICS members could also limit effectiveness.
3. For Global Trade and Investment
A multipolar currency system could reduce systemic risk by diversifying reserve holdings.
It might complicate global transactions, as exchange rate volatility increases.
Gold and digital assets could become more prominent as neutral reserve assets.
The Role of Digital Currencies and Blockchain
Central bank digital currencies (CBDCs) represent the next frontier in the currency war.
China’s digital yuan has already been used in pilot cross-border settlements.
The BRICS Pay system aims to facilitate digital settlements without SWIFT.
The U.S. Federal Reserve is cautiously exploring a digital dollar, wary of losing financial privacy and control.
Blockchain-based payment networks could fundamentally alter international finance by reducing transaction costs, bypassing sanctions, and enhancing transparency.
Challenges and Limitations of De-Dollarization
While the movement is accelerating, full de-dollarization faces structural barriers:
The dollar still accounts for around 58–60% of global reserves (as of 2025).
Most global trade contracts and commodity pricing remain dollar-based.
Financial markets in other currencies lack the liquidity and trust of U.S. assets.
The network effect of the dollar—its widespread use reinforcing its dominance—is difficult to dismantle quickly.
Hence, while de-dollarization is real, it is more of a gradual rebalancing than an abrupt replacement.
Future Outlook
In the coming decade, the global monetary system is likely to evolve into a hybrid multipolar model rather than a unipolar one. The dollar will remain dominant but with reduced influence, sharing space with the yuan, euro, and possibly a BRICS-linked currency. The race will depend on:
The technological adoption of digital currencies,
The economic strength of emerging markets, and
The geopolitical realignments of global trade networks.
If current trends continue, by 2035, global reserves could become more evenly distributed among major currencies, diminishing U.S. leverage in economic diplomacy.
Conclusion
De-dollarization and the ensuing currency war represent one of the most significant shifts in global economics since the fall of Bretton Woods. The world is witnessing the gradual decline of U.S. monetary hegemony and the rise of a multipolar financial ecosystem. While the dollar’s dominance is unlikely to vanish overnight, its uncontested status is being eroded by strategic alliances, technological innovation, and geopolitical transformation.
Ultimately, the outcome will depend not only on economic policies but also on trust—the most valuable currency of all. Whether nations continue to trust the U.S. dollar or pivot toward a diversified basket of currencies will shape the architecture of the 21st-century global economy.

Global Commodity Trends: An In-Depth Analysis1. Overview of Commodity Categories
Commodities can broadly be categorized into three segments:
Energy Commodities – including crude oil, natural gas, coal, and renewable energy components.
Metal Commodities – comprising precious metals (gold, silver, platinum) and industrial metals (copper, aluminum, nickel, lithium).
Agricultural Commodities – such as grains, oilseeds, coffee, cotton, and sugar.
Each sector operates under different economic drivers but shares common threads: cyclical demand, global trade dependency, and vulnerability to geopolitical and climatic disruptions.
2. Energy Commodities: Shifting Power Dynamics
Oil Market Evolution
Crude oil remains the most influential commodity, dictating the rhythm of the global economy. After years of volatility, oil prices in 2025 have stabilized between $75–$90 per barrel, balancing between OPEC+ production controls and demand recovery in post-pandemic industrial economies. Key trends influencing the oil market include:
Geopolitical Tensions: Conflicts in the Middle East, Russia-Ukraine tensions, and sanctions have repeatedly disrupted supply routes and reshaped trade alliances.
Energy Transition: Many nations are reducing fossil fuel dependence, creating dual effects—investment withdrawal from oil projects and short-term supply tightness.
US Shale Resurgence: Technological improvements have revived U.S. shale production, moderating price spikes and diversifying global supply sources.
Natural Gas and LNG Boom
The liquefied natural gas (LNG) market has become a critical player in global energy security. Europe’s pivot away from Russian pipeline gas has spurred demand for LNG imports from the U.S., Qatar, and Australia. Asian markets—particularly India, Japan, and South Korea—are also expanding their LNG infrastructure. Prices remain elevated due to limited shipping capacity and long-term contract negotiations.
Renewable Commodities
The renewable sector is emerging as a commodity class of its own. Materials essential for wind turbines, solar panels, and batteries—like lithium, cobalt, and rare earth elements—are now strategically significant. Nations rich in these resources, such as Chile (lithium), the Democratic Republic of Congo (cobalt), and China (rare earths), have gained economic leverage in the green transition era.
3. Metal Commodities: Industrial and Technological Backbone
Copper: The ‘New Oil’ of Electrification
Copper is a vital indicator of global industrial health and the clean energy revolution. With rising demand from electric vehicles (EVs), grid expansion, and renewable infrastructure, copper prices have remained strong, hovering near $9,000–$10,000 per metric ton in 2025. However, supply shortages from major producers like Chile and Peru continue to pressure the market. Technological exploration and recycling have become key to meeting demand sustainably.
Aluminum and Steel: Industrial Expansion
Global infrastructure projects—particularly in India, Southeast Asia, and Africa—have driven demand for aluminum and steel. China’s gradual construction slowdown has been offset by growth in emerging markets. Decarbonization efforts have also led to “green steel” innovations, with major producers investing in hydrogen-based smelting technologies.
Precious Metals: Inflation Hedges
Gold remains a preferred hedge against inflation, currency devaluation, and financial instability. In 2025, gold prices are resilient around $2,100 per ounce, supported by central bank purchases and investor uncertainty about global debt sustainability. Silver, platinum, and palladium also benefit from industrial use in electronics, solar energy, and automotive catalysis.
Critical Minerals and Rare Earths
The rise of electric mobility and digital technologies has made critical minerals central to geopolitical competition. Nations are now securing mineral supply chains to reduce dependence on single-country producers. The U.S. and EU have launched strategic mineral alliances to diversify sourcing and encourage domestic mining.
4. Agricultural Commodities: Weather, Demand, and Technology
Food Security Challenges
Global food prices have experienced volatility due to extreme weather, conflict disruptions, and changing consumption patterns. Droughts in key grain-producing regions (such as North America and Australia) have tightened wheat and corn supplies, while El Niño weather patterns have affected rice production in Asia.
Grains and Oilseeds
Wheat and Corn: Prices remain firm as global demand for animal feed and biofuels continues to grow.
Soybeans: Driven by rising protein consumption in developing economies and biofuel production in the U.S. and Brazil, soybean demand remains robust.
Rice: Export restrictions by major producers like India in 2024–25 have kept rice prices elevated, intensifying food inflation pressures in Africa and Asia.
Soft Commodities: Coffee, Cocoa, and Cotton
Coffee and cocoa markets face supply disruptions due to unpredictable weather and labor shortages. Meanwhile, cotton prices have stabilized as global textile demand recovers post-pandemic. However, sustainability standards and organic production are reshaping trade patterns, with premium pricing for ethically sourced materials.
Technological Innovation in Agriculture
Precision farming, AI-driven weather forecasting, and genetically resilient crops are transforming agricultural productivity. These innovations aim to balance yield improvements with sustainability and environmental preservation, reducing the carbon footprint of global agriculture.
5. Geopolitical and Economic Influences
Global commodity trends are closely tied to geopolitics and macroeconomics. Several key developments have reshaped the landscape:
Trade Wars and Sanctions: The U.S.–China trade rivalry and sanctions on Russia and Iran have disrupted traditional commodity flows, leading to new alliances among BRICS nations.
Currency Movements: A strong U.S. dollar often suppresses commodity prices by making them costlier for non-dollar economies. However, increasing talk of “de-dollarization” could redefine commodity pricing in the long term.
Global Inflation and Interest Rates: Higher interest rates have tempered speculative investments in commodities, yet inflationary pressures from supply chain disruptions continue to sustain price floors.
Environmental Regulations: Climate policies and carbon taxes are influencing production costs and trade competitiveness, particularly in energy and metals sectors.
6. Technological and Structural Shifts
Digitalization and Smart Commodities
Blockchain and AI technologies are revolutionizing commodity trading systems. Digital platforms now enable transparent pricing, efficient logistics, and reduced transaction costs. Smart contracts in blockchain-based trade reduce fraud and enhance traceability from mines to markets.
Green Commodities and ESG Investments
Investors increasingly favor environmentally and socially responsible commodities. ESG (Environmental, Social, and Governance) frameworks are pushing companies to disclose emissions data, human rights practices, and sustainability metrics. This shift is influencing how commodity-backed financial instruments are structured and traded.
Automation in Mining and Logistics
Robotics, automation, and remote monitoring have transformed mining and shipping operations, reducing costs and improving safety. Autonomous drilling and AI-based maintenance systems enhance operational efficiency across industries dependent on raw materials.
7. Regional Insights
Asia-Pacific
Asia remains the largest consumer of commodities, with China and India leading demand for energy, metals, and food. India’s industrial expansion and renewable energy programs are reshaping regional trade flows. Southeast Asian nations are emerging as key exporters of palm oil, rubber, and rare earths.
North America
The U.S. and Canada benefit from abundant energy and agricultural resources. The shale industry revival and strategic mineral exploration position North America as a stable supplier amidst global uncertainty.
Europe
Europe’s energy diversification post-Ukraine war has accelerated investment in renewables, hydrogen, and circular economy practices. High carbon pricing has also made European industries more sustainable but less cost-competitive globally.
Africa and Latin America
These regions are rich in untapped resources, from lithium in Chile and Argentina to cobalt in the DRC and oil in Nigeria. However, political instability and infrastructure challenges hinder full potential. Strategic partnerships with China and Western investors aim to modernize extraction and processing industries.
8. Challenges Ahead
Despite progress, several structural challenges persist in global commodity markets:
Supply Chain Fragmentation: Geopolitical rivalries threaten trade connectivity.
Climate Risks: Extreme weather events continue to impact yields, mining operations, and energy supply.
Resource Nationalism: Governments are asserting greater control over natural resources, imposing export restrictions or windfall taxes.
Market Volatility: Speculative trading and financial derivatives amplify short-term price fluctuations, complicating investment planning.
Sustainability Pressure: Transitioning to low-carbon operations requires significant capital and policy alignment across nations.
9. The Future of Commodity Markets
Looking ahead to 2030 and beyond, the global commodity landscape is expected to be shaped by four major forces:
Energy Transition Acceleration: The world will see greater integration of renewables, hydrogen, and energy storage, reducing fossil fuel dependency but increasing demand for critical minerals.
Technological Integration: AI, blockchain, and predictive analytics will dominate commodity trading, making markets more transparent and efficient.
Sustainable Agriculture: Climate-resilient crops and smart irrigation will redefine global food systems.
Geopolitical Realignment: Multipolar trade networks among BRICS+ nations will challenge traditional commodity pricing systems dominated by Western economies.
Conclusion
Global commodity trends in 2025 reveal a dynamic interplay of energy transformation, technological evolution, and geopolitical recalibration. While oil and gas remain vital to short-term stability, the long-term trajectory points toward green minerals, digital commodities, and sustainable agriculture. The world is navigating a complex transition where supply chains, trade policies, and investment strategies must adapt to environmental and political realities. In essence, commodities have evolved from mere tradable goods into strategic instruments of power, policy, and progress. Managing this transformation with foresight, equity, and sustainability will define the resilience of the global economy in the years ahead.
Climate Change Impact on the Global MarketIntroduction
Climate change has emerged as one of the most pressing challenges of the 21st century, with consequences extending far beyond environmental degradation. It is reshaping the global economy, altering trade patterns, influencing investment flows, and redefining business strategies across industries. The rise in global temperatures, frequent natural disasters, and shifts in weather patterns have disrupted supply chains, reduced agricultural productivity, and challenged energy security. Consequently, climate change has become both a financial risk and an opportunity for innovation and sustainability in the global market.
This essay explores the multi-dimensional impact of climate change on the global market, analyzing its effects on various sectors, trade, finance, labor, and investment, while also addressing how governments and corporations are adapting to these transformations.
1. Economic Disruptions and Market Volatility
One of the most immediate effects of climate change on the global market is economic instability. Extreme weather events such as hurricanes, floods, droughts, and wildfires cause billions of dollars in damages annually. According to data from the World Bank, climate-related disasters have caused global economic losses exceeding $250 billion per year in recent years.
For example, the 2020 wildfires in Australia and California led to massive insurance claims, destroyed infrastructure, and disrupted business operations. Similarly, floods in South Asia and droughts in Africa have crippled agricultural production, leading to food shortages and price volatility in global commodity markets.
Climate-related disruptions increase market uncertainty, discouraging long-term investments and affecting stock market performance. Investors now monitor environmental risks as part of Environmental, Social, and Governance (ESG) criteria, integrating sustainability factors into financial decisions. As climate risks intensify, economies reliant on fossil fuels or resource-heavy industries face growing pressure, while green sectors gain prominence.
2. Agriculture and Food Supply Chains
Agriculture is one of the most climate-sensitive sectors in the world economy. Rising temperatures, unpredictable rainfall, and soil degradation have significantly affected crop yields. The Intergovernmental Panel on Climate Change (IPCC) estimates that global crop yields for staple foods such as wheat, rice, and maize could decline by 10–25% by 2050 if current trends persist.
These changes influence global trade and food prices. Developing countries—especially in Africa, South Asia, and Latin America—are most vulnerable because their economies depend heavily on agriculture. Declining productivity affects exports, rural incomes, and food security, which in turn increases social unrest and migration pressures.
Meanwhile, developed nations face challenges related to food imports, quality control, and supply chain resilience. The shift in agricultural zones—such as wine production moving from southern to northern Europe—reflects how industries are adapting to new climatic realities. However, such transitions require significant capital and time.
3. Energy Markets and the Green Transition
The energy sector lies at the core of the climate–market relationship. Fossil fuels—oil, coal, and natural gas—have powered industrial growth for centuries but are now under scrutiny as major contributors to greenhouse gas emissions. As governments introduce carbon pricing, emission taxes, and renewable energy incentives, the global energy market is undergoing a structural transformation.
Countries are diversifying their energy portfolios by investing in solar, wind, hydro, and hydrogen technologies. The shift toward renewable energy is not only environmental but also strategic—reducing dependency on volatile fossil fuel markets. For instance, Europe’s transition to renewable energy accelerated after geopolitical disruptions such as the Russia-Ukraine conflict, highlighting how climate and politics intertwine.
However, this transition poses short-term challenges. Traditional energy sectors face stranded assets, where fossil fuel reserves lose value due to policy changes or technological advancements. Oil-dependent economies, such as those in the Middle East, must restructure their markets to remain competitive in a decarbonizing world.
On the other hand, the green energy market—including electric vehicles (EVs), battery storage, and carbon capture technologies—is rapidly expanding. BloombergNEF projects that global investment in clean energy could exceed $2 trillion annually by 2030, creating new jobs, industries, and trade patterns.
4. Trade and Global Supply Chains
Global trade networks are increasingly vulnerable to climate disruptions. Ports, transportation systems, and production hubs located in climate-sensitive regions face heightened risk. For example, rising sea levels threaten major coastal cities like Shanghai, Mumbai, and New York—key centers for global commerce.
Climate change affects logistics and insurance costs, as companies must adapt to new shipping routes or build resilient infrastructure. The 2021 Suez Canal blockage demonstrated how even temporary disruptions can ripple through global markets; climate-induced events could have far greater and longer-lasting effects.
Moreover, international trade policies are evolving to incorporate climate considerations. The European Union’s Carbon Border Adjustment Mechanism (CBAM), for instance, imposes tariffs on imports from countries with lax emission standards. This marks the beginning of carbon-based trade regulation, which will influence global competitiveness.
Developing economies may find it harder to compete if they lack the resources to implement green technologies, deepening economic inequality. However, climate-smart trade strategies—such as investing in sustainable manufacturing and regional cooperation—can offer resilience and growth opportunities.
5. Financial Markets and Investment Trends
Climate change has redefined the way financial markets operate. Investors, regulators, and institutions now view climate risk as financial risk. The rise of green finance, carbon markets, and ESG investing reflects the growing integration of environmental factors into financial decision-making.
Central banks, including the Bank of England and the European Central Bank, have begun incorporating climate stress tests into financial stability assessments. Insurers, too, are recalibrating models to account for climate-related losses, which affect premiums and underwriting practices.
The carbon credit market—where companies trade emission allowances—has become a multibillion-dollar sector, incentivizing corporations to reduce emissions. Similarly, green bonds and sustainability-linked loans finance projects related to renewable energy, conservation, and clean technology.
However, climate-related financial transitions also bring risks. For instance, the reallocation of capital from high-emission industries to sustainable alternatives can cause asset devaluation and job losses in traditional sectors. Policymakers must manage this transition carefully to avoid financial instability while ensuring a just and equitable shift.
6. Corporate Strategy and Innovation
Corporations are increasingly recognizing that climate resilience is essential for long-term profitability. Leading companies across industries are adopting sustainability strategies, investing in renewable energy, and rethinking production models to minimize environmental impact.
The rise of the circular economy—where materials are reused, recycled, or repurposed—represents a major shift in business philosophy. Companies like Apple, Unilever, and Tesla are pioneering sustainable practices, from sourcing ethical materials to reducing waste and emissions.
Climate change is also driving technological innovation. Advances in artificial intelligence (AI), big data, and remote sensing allow businesses to predict weather risks, optimize supply chains, and monitor emissions in real time. Green innovation is no longer a niche pursuit but a competitive necessity.
Moreover, corporate accountability is growing. Investors and consumers are demanding transparency in sustainability reporting, forcing firms to disclose environmental footprints under frameworks such as the Task Force on Climate-related Financial Disclosures (TCFD).
7. Labor Markets and Employment Shifts
Climate change affects global labor markets both directly and indirectly. On one hand, extreme heat and natural disasters threaten workers’ safety and productivity, particularly in agriculture, construction, and manufacturing. On the other hand, the green economy is generating millions of new jobs in renewable energy, waste management, and sustainable infrastructure.
According to the International Labour Organization (ILO), the green transition could create over 24 million new jobs globally by 2030, offsetting losses in fossil-fuel sectors. However, this shift demands reskilling and education programs to prepare workers for emerging industries.
Regions that depend heavily on carbon-intensive industries face structural unemployment if transitions are not managed fairly. Therefore, the concept of a “just transition”—ensuring social protection and equal opportunities—is becoming a key part of global climate policy.
8. Regional and Sectoral Disparities
The economic impacts of climate change are not evenly distributed. Developing nations in tropical and coastal areas bear the brunt of physical climate risks but often lack financial resources to adapt. In contrast, developed economies have better infrastructure, insurance systems, and technological capacity to mitigate damage.
Sectors such as tourism, agriculture, and fisheries are among the most affected. For example, coral reef degradation and rising sea levels threaten tourism industries in the Caribbean and Southeast Asia. Meanwhile, melting Arctic ice opens new shipping routes, benefiting some countries but raising geopolitical tensions.
Global inequality may deepen as climate change alters comparative advantages. Wealthy nations with access to advanced technology may gain from green innovation, while poor nations face resource scarcity, migration crises, and declining trade competitiveness.
9. Policy Responses and Global Cooperation
Governments and international institutions are increasingly aware that climate change is not just an environmental issue but a profound economic one. Agreements such as the Paris Climate Accord aim to limit global warming to 1.5°C by encouraging emission reduction targets (NDCs) and promoting sustainable development.
Carbon pricing mechanisms—like taxes and cap-and-trade systems—are being adopted worldwide to internalize the environmental cost of emissions. Public investments in clean energy, green infrastructure, and climate adaptation are reshaping fiscal priorities.
Multilateral organizations, including the World Bank, IMF, and UNEP, are developing climate finance initiatives to help vulnerable nations transition sustainably. However, the success of these programs depends on global cooperation, political will, and equitable access to resources.
10. Future Outlook: Risks and Opportunities
The coming decades will determine how the global market adapts to climate change. The risks—ranging from financial instability to resource conflicts—are significant. Yet, the opportunities for innovation, sustainable growth, and technological advancement are equally vast.
The global green economy could become the defining growth engine of the 21st century. Countries that invest early in renewable energy, circular production, and low-carbon technologies are likely to dominate future markets. Businesses that fail to adapt may face obsolescence as consumers and regulators favor sustainable alternatives.
In essence, climate change is transforming capitalism itself—from a model based on extraction and expansion to one grounded in resilience and regeneration.
Conclusion
Climate change is no longer a distant environmental concern; it is a present and pervasive economic force reshaping the global market. From agriculture to finance, from trade to technology, every sector is being redefined by the realities of a warming planet. The challenges are immense, but so are the opportunities for reinvention.
The global market’s response to climate change will determine not only economic prosperity but also the survival of ecosystems and future generations. Sustainable development, green innovation, and collective action are the cornerstones of a resilient economic future. The sooner markets internalize the true cost of carbon and embrace climate responsibility, the more stable and prosperous the world economy will become.
How Smart Money Hunts Liquidity on Gold🔶 1. Understanding Liquidity in the Market
Liquidity represents the orders resting above or below obvious price levels — mainly stop-losses and pending orders placed by retail traders.
In simple terms, where you see equal highs, equal lows, or strong swing points, that’s where liquidity pools exist.
On Gold (XAUUSD), because of its volatility, liquidity often accumulates near:
Double tops or double bottoms.
Previous day highs/lows.
Fair value gaps (imbalances).
Psychological round levels like $2300, $2350, $2400, etc.
These zones attract both buyers and sellers — and that’s exactly where Smart Money (institutional traders) aims to act.
🔶 2. What Smart Money Actually Does
Smart Money doesn’t follow retail moves — it creates them.
When price consolidates and retail traders position themselves early, institutions push price beyond these zones to:
Trigger retail stop losses.
Fill their own large institutional orders at better prices.
Remove weak hands from the market.
This process is called a Liquidity Hunt or Stop Hunt.
It’s not manipulation in a malicious sense — it’s simply how large players execute size efficiently in a decentralized market.
🔶 3. The Classic Gold Liquidity Hunt Pattern
Let’s break down a typical Smart Money setup on XAUUSD:
Step 1:
Price builds equal highs (or equal lows) — retail traders see it as a breakout zone.
Step 2:
Institutions push price slightly beyond that area, creating a false breakout.
Stop-losses of early traders are triggered — this is the liquidity grab.
Step 3:
Immediately after the sweep, structure shifts (Change of Character / CHoCH).
This confirms that Smart Money has completed its collection phase and is now ready to move price in the intended direction.
Step 4:
Price often retraces back into the order block or fair value gap left behind by displacement.
This is where the high-probability entry lies — the Smart Money entry point.
🔶 4. Why Gold (XAUUSD) Shows This So Clearly
Gold is one of the most liquid and manipulated markets on the planet — ideal for studying Smart Money behavior.
Because it trades heavily during London and New York sessions, liquidity is constantly generated and removed.
This is why you’ll frequently see:
Sudden spikes before major sessions open.
Sharp sweeps before news events (CPI, NFP, FOMC).
Rapid reversals after stop-hunts.
Institutions use gold as a liquidity engine, often hunting both sides of the market before the real move.
🔶 5. How to Identify a Real Liquidity Hunt (Checklist)
Use this professional checklist to train your eye:
✅ Look for equal highs/lows forming before the move.
✅ Wait for a stop-hunt candle — a long wick piercing liquidity zone.
✅ Confirm a market structure shift (MSS or CHoCH) in lower timeframe.
✅ Entry only after displacement and a clean retracement into an order block.
Avoid reacting emotionally to every breakout — Smart Money uses time + patience to trick impulsive traders.
🔶 6. Practical Educational Example
Suppose Gold forms equal highs at $2380 during the London session.
Many retail traders place buy stops above $2380 expecting a breakout.
Institutions see that as a liquidity pool.
Price suddenly spikes to $2385, sweeps those buy stops, and then drops to $2360 — that’s your liquidity hunt.
Once the structure shifts bearish after the sweep, Smart Money has filled sell orders at a premium — and the downtrend resumes.
🔶 7. Educational Takeaway
Smart Money doesn’t predict — it reacts to liquidity.
By understanding where traders are trapped, you align your trades with institutional flow instead of retail emotion.
📘 Key Principles:
Trade after the liquidity grab, not before.
Always wait for confirmation through structure shift.
Focus on zones of interest, not random breakouts.
Observe timing — most liquidity hunts occur during session opens or high-impact news.
💬 Final Note:
Every chart tells a story — but only those who understand liquidity can read the true language of price.
Study it, practice it, and you’ll see how Smart Money creates opportunity through manipulation and order flow.
📘 Follow me for more professional educational content on Smart Money, Liquidity, and Gold market behavior.
My Plan To Improve My Win/Loss Ratio In Forex TradingThe trading plan that I have been designing based on SMC was amazingly beautful in terms of its mechanics. Yet, it had a terrible Win/Loss ratio.
Because I loved its mechanics, I didn't want to drop it all together, and was looking for ways to enhance it. I tried to merge it with the classical school and with some Volume indicator, but things still went south.
Finally, I came by some educational material that showed me a couple of things on using Stochastic. I loved it, and this will be my addition, and what I will test in the coming week.
My plan will include the same SMC rules, and the Stochastic. I will draw the support and resistance zones and maybe trendlines.
I will be using the daily timeframe on two different sets of settings for the stochastic, one is long term and another is shorter term.
I will be coming back with my test results next week.
