FUN-BTC BINANCE "Divergence Education" This analysis for Education purpose. Trade on your own risk.
If this you see Divergence in any 4Hrs Chart you can definitely get upto 40% Profit every Time.
If you see the divergence in Chart or RSI (Indicator), you must always check the MACD(Indicator).
For more information you can message me or comment also
Thank you.
Trend Lines

Channel example 2 - BCH/USDFor more information read the 'Fake-breakouts-everywhere' idea below
We can see the channel is broken on the uptrend which creates an explosive breakout. What we need to remember is that Bitcoin price movements affects everything and as a result when BTC/USD bounced off its resistance (upper channel wall seen in my first channel example - link below) the BCH/USD took a dip. Given the bear market we are in - this channel breakout, albeit explosive might be short lived.

Channel example 1 - BTC/USDFor more information read the 'Fake-breakouts-everywhere' idea below
The first 2 peaks (teal arrows) define the channel direction. The third time the price hit it - it bounced straight away. This created downward price movements on ETH and BCH and probably many others.

How to enter a trade - Part 2 (Lower time frame) CTR/BTCHi everyone.
Here is part 2 of the CTR/BTC entry signals video. It focuses on pinpointing an entry level using a lower time frame.
I'll put out an exit signals video shortly that covers things from that perspective.
As always, let me know if you have any feedback or suggestions for future videos.
Cheers and good luck,
RJR

Education Study: 5 good trades in nzdusdEducation Study:
How many good trading opportunity for NZD?
1. Bearish Cypher Pattern , short and capture a buyer failure
2. blue channel broken, retest and short
3. 0.7340 structure broken, retest and short
4. ab=cd plus structure retest
5. 1h inside bar break out and short

Learning how USD corrolates with non-USD currencies. EURCADMy CURRENT definition of RISK.
RISK ON
USD down, moving XXX/USD currencies up and USD/XXX currencies down.
or
RISK OFF
USD up, moving XXX/USD currencies down and USD/XXX currencies up.
Mid term (3 wks-6mo) I lean bias towards 2018 trading in RISK ON mode. Which means
EURUSD is a buy mid-term.
USDCAD is a sell mid-term.
In the last several months we have been in RISK ON mode with EURUSD in a obvious uptrend. I've noticed EURCAD trends UP when we are risk on.
So mid-term we cannot expect to short EURCAD because we know the underlying currencies are in up trends. Short term I do believe there is room for a pullback to the 1.53 or 1.52 levels coupled with a pullback in EURUSD. But ultimately I will be looking to trade EURCAD higher in months to come.
Full Disclaimer: This is a test I'm running to better understand how correlations among two USD pegged pairs perform when pegged against each other. I will be referencing both EURUSD and USDCAD often. EURUSD is perfectly 1-1 inversely correlated with USD. This is because the EURUSD is the strongest correlated currency to the USD in the world and ultimately controls EURCAD by nature. Trade between the United States and the European Union is over half of USD transactions so EURO's are the most strongly correlated out of all other currencies. That being said when I'm looking at the price of EURUSD, I'm actually reflecting on the price of USD if that makes any sense. EURUSD is up when USD is down BECAUSE USD is down! I track USD with the US Dollar index. Ticker DXY.
If you found this useful or thoughtful Likes/Comments/Follows are much appreciated!
Disclaimer: Oanda data shown. Material is educational only. Trade at your own risk!
and ultimately controls EURCAD by nature

The warning signs of the downturn. 2017 brought incredible popularity to cryptocurrencies and the market now contains a lot more people prone to 'fear of missing out' and panic selling. As a result the chances of a currency finding price stability at the end of a consolidation are slim, so as price amplitude gets narrow it tends to drop (or shoot up) and enter yet another consolidation pattern. In situations like this, professional traders with large accounts can wait for the price to drop as amateur traders (understandably, and perhaps sensibly) jump in on the panic selling.
Luckily, I sold all my coins the day before this big fall began. I did this because, following the rises of 2017, several major cryptocurrencies had been consolidating in a similar way to that of Bitcoin seen in the chart above. I could have lost out had prices broke from the consolidation triangle in an upward direction, but the cryptomarket as a whole was coiling for something and I could not call which way it was heading and the signs hinted at a breakout downwards, so I preferred to pull out and watched. Currently, those major cryptocurrencies are now experiencing similar downward repeated consolidation patterns (example can be seen in my linked chart (BTCUSD: Here we go again...). Now, for me, it is worth riding some of the waves in these consolidation patterns and waiting for the bottom of this long fall to appear. The ultimate bounce back up from a drop such as this will likely be very nice.
A good example of a rise followed by a fall is in the SHCOMP chart between 2014 and 2016, as pointed out by tntsunrise in his post: 'BTCUSD don't chase high'
What to do now? As Warren Buffett might say, "Buy when others are selling". Though perhaps in the World of cyrptocurrency it is safer to, "buy when others have finished selling".
I posted this in education, but I am not teaching; I am learning.

Trend Reversal SignalsI would like to show you one of possible variants how to trade trend reversals. I use SMA100 as the signal line confirming bullish or bearish trends. If the price drops below SMA100, for me, it's a trend reversal signal and time for searching sell opportunities. If the price moves above SMA100, a new uptrend begins and I search for buy opportunities. In this example the price broke SMA100. MACD supported upward movement. ADX line of DMI rose and it confirmed strong price movement. It was the trend reversal signal with further upward movement. Such trading based on trend reversals is simple, don't you think so?
And which tools you use for trading trend reversals? Please, share in comments.

Confused about when to buy? Just wait for a trendline breakIn the world of cryptocurrencies it is so difficult to know when to buy. Instead of trying to 'time the market', just draw some trendlines or use an automated tool (the one I use is: Auto-Trendline from Patternsmart ). Make your purchase once price breaks above the trendline.
In this case, looking at Ethereum on the daily chart, you could have picked some up for $55, $230, and $300 dollars after price broke the trendlines marked with the arrows. Price is listed next to each arrow.

Flipping your Trade BiasAs a currency trader, it is important to be able to flip your bias on a market as soon as possible provided you have objective technical evidence to support this flip. Too often, traders are influenced by a third party’s opinion about a long term trade bias that may be generated from fundamental analysis which is highly subjective. They tend to hold this bias for too long and end up taking counter trend trades resulting in losses or attempt to hold onto an open position and aiming for a huge profit target target which rarely eventuates.
We have found the technicals often paint a very clear picture regarding the stance on trade bias and you can often find your ‘Line in the Sand’ fairly quickly on a chart.
Attached is the Daily chart for AUDNZD. We have just flipped our bias from bullish to bearish after the recent bearish daily close. This means in our minds, we should only be looking for shorting opportunities since we believe the market is now in a bearish trend. It is important to stay in tune with a market’s bias so you know you are trading with the trend and not against it.
A trade bias is usually flipped when a major key line (horizontal and/or trendline) has a strong daily break and close.

Example of a Downtrend Parallel Channel on PFFPFF formed a downtrend parallel channel.
A downtrend parallel channel (bearish channel) is a continuation pattern that slopes down and is bound by an upper and lower trend line.
The upper downtrend line it is called main line and marks resistance and the lower downtrend line it is called channel line and marks support.
For a bearish channel, the main line extends down and at least two bounces highs are required to draw it.
To draw a channel line ideally needs two bounces lows, however, some traders draw it using only one bounce low.
In a bearish channel the target is to short when prices reach main line resistance and take profit when prices reach channel line support, then, wait for prices to reach resistance again and repeat.

Elliott Wave: Week of 11/20/17 - Unhappy Thanksgiving?The odds are lining up against the bulls. They may see a holiday cheer with a kiss of 2600 if lucky. However, the pullback from 2597 is incomplete and Bears are preparing for their feast. Continuing last week's issue the pullback is underway for an eventual total of 2-3% from the 2597 peak.
Elliott wave count, a Fibonacci level of 1 from the the 2/2016 low, a head and shoulder technical analysis pattern and violation of a lower channel line are all bearish signs for the near term. There is even a case for a harmonic butterfly pattern I've placed here:
The Bears will have their time - for now. Happy Thanksgiving and enjoy the holiday.

Example of a Downtrend Line on BACThis downtrend line on BAC, represents a resistance where traders can take advantage of selling opportunities in rebounds.
It is recommended confirm the downtrend line. It could be after a third rebound, then, you can sell in any rebound and hold the position before the downtrend line get broken.
When the downtrend get broken you must buy.

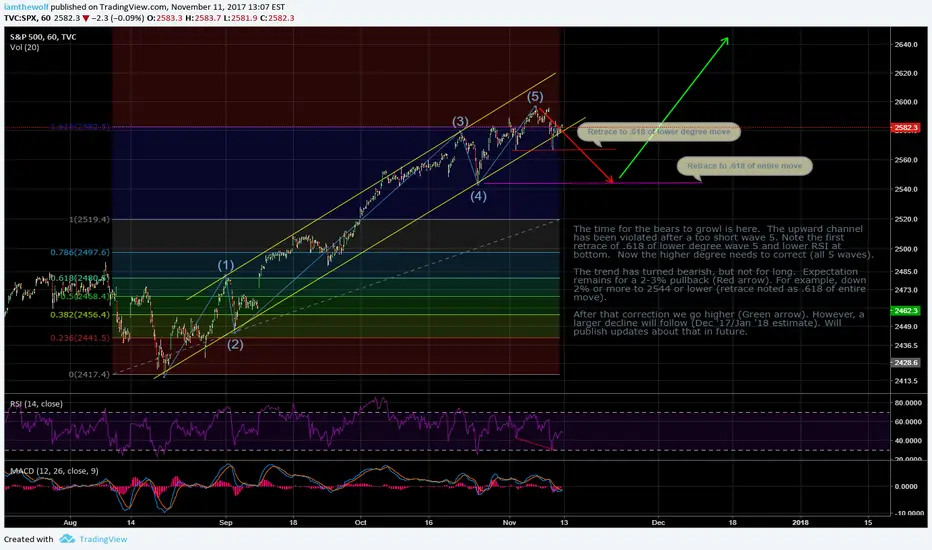
Elliott Wave: Week of 11/13/17 - Something for everyoneTime for a pause of the upward trend while the Bears to welcome cooler times. Their romp will be brief, but I expect their volume to be loud. A pullback of 2-3% has been long anticipated and is finally here. For the Bulls it provides a breather before the next advance. A much larger tussle is ahead in Dec/Jan. For now, there is something for everyone.
IntersectionIntersection is when price is on 2 or more signal/set up that points out to the same direction.
In this example:
1. Price broke the trend line resistance and retested it as a trend line support. (Buy signal)
2. Price is at horizontal support (Buy signal)


Question 1: Ad 2 examplesthere are some examples for trend, BUT picture D is game changer TREND ends there
remember: 1. last 2 peaks or last 2 valleys connect and make TREND line
2. if you dont know , dont plan trade there

GBPUSD: how to use trend line to tradeHello guys,
GU got its support on the green line .
This was a resistance line now become a support line.
But a red ascending trend line broke at the beginning of Aug which is a bear sign too .
On such chart, a retest of the trend line is possible. after that the green line could be test one more time too.
Less is more!

1: How To Trade Breaksouts?!Hi guys. For questions please feel free to message me.
Also take a look on my account for my free analyses, I will keep it up to date every week.

USDCAD 4h Educational PostObserve the chart for a moment, and you will see the support trendline.
Now, price on the 4h candles has broken below this support trendline, but has never closed below it.
After the first three points on the trendline, illustrated by the first 3 circles, the trendline was established as valid.
(It generally is considered that 3 points are necessary for a level to be valid)
After the 3 points, the trendline was established, and even though there were 2 more circles after that, where candles went below the trendline, the 4h candles still closed above. The wicks in the last 2 points indicate that bulls reversed price in time for the 4h candle to close.
This trading week closed pretty nice for this pair, the third to last candle's lower shadow is as long as the body, and the following candle is very strongly bullish.
Therefore, I will be looking at a long position next week.
A lesson one could take away from this is that you should never take a trade that uses an unclosed candle, because it still has time to form completely differently, and it is a mistake that is very easy to avoid.
- For example, look at the two candles in the fourth circle: sure price went 30 pips below the trendline, but it did not close there. I can already tell you that there were traders that took this short position without waiting for that candle to close. Patience is key.
Another lesson is that higher time frames take precedence over shorter ones. One should not trade a 5 minute double top formation on a 1h or 4h,200 pip uptrend.

Sell GBPJPY (educational)Sell GBPJPY (educational)
"kalbotical retracement confluence 1"
1. Up Trend line broken
2. down Trend line formed
3. second leg has a strongest momentum
so possible third leg
for some kind of 1-2-3-4-5 structure )
You can catch momentu e.g with
Squeeze Momentum Indicator
4. Look left for S/R zone
5 perfect Fib level - .618
6. Kalbot RSI shows
the fastRSI line in the
overbought area,
so there is a possible end of retracement
7. Top predictor (or your mentor)
loves this structure too
8. Plan your trade
trade with one of possible strategies .
e.g countertrendline break ( 9 ) strategy
StopLoss 30 pips above U-turn
Take profit
:- 100 pips (3:1 trade)
:- or -0.25 Fibs extension (10)
:- or Look left for S/R level (11)
12 trade your plan

Learn How to Follow the Overall Trend and You WILL Succeed!Hi traders, here at Unique4xPro we are firm believers that price action trading is the way to go in these markets and for that reason we do not use any indicators. We base our trades solely on price action and we only trade in the direction of the overall trend to ensure that all of our trades are backed by the banks and institutions that are backing the direction of the trend with huge amounts of money.
We hope you find this useful and please comment if you have any questions... We will be happy to answer!
You can also learn a lot from our YouTube live streams which we do at 7 P.M. E.S.T. every Monday, Wednesday, and Thursday. All of our streams are automatically uploaded to our channel so that they can be watched back: www.youtube.com

AUDUSD-Convergence Divergence-Example 2 and tipsHello, i posted before a chart about this trading system, you can check it on related ideas below.
Here is another good example real-time on AUDUSD. I wanted to repeat the process and share some tips based on my own experience.
1) We found a clear downtrend (series of HH,HL)
2) The downtrend is broken and a Higher High is formed (convergence)
3) We confirm the convergence on oscillator and mark the level of convergence on D1 chart. Price usually reaches this level and often exceedes it
In this strategy the DEEPER THE BETTER, i prefer a pullback at least to the 0.61 fib retrAcement or more. Sometimes off course prices makes a shallow pullback and rallies but doesn't matter, there are many setups all over the market.
We can use this strategy on lower times frames also. Recommended combinations:
- D1-H4
- H4-H1
- H1-15m
After we found a convergence we switch to a lower TF, in this case H4
We found two additional levels of S/R as usually, SL below the last level of S/R
Confirmation is the first green candle. Beeing strict Its a little late now but his post is educational (we can off course enter at current price)
A divergence is already in play.
There are many types of divergences: regular, hidden, extreme, exagerated, etc. Sometimes its not "easy" to spot a divergence.
One additional tip would be to have a deep study of different types of divergences. There are good courses about it.
Thats all, lets see how this strategy works real-time here on AUDUSD.
Regards.
