What is a Bearish Breakaway and How To Spot One!This Educational Idea consists of:
- What a Bearish Breakaway Candlestick Pattern is
- How its Formed
- Added Confirmations
The example comes to us from EURGBP over the evening hours!
Since I was late to turn it into a Trade Idea, perfect opportunity for a Learning Curve!
Hope you enjoy and find value!
Volume Indicator

Understanding Volume In TradingVolume is one of the most crucial yet often overlooked aspects of trading. It represents the total number of shares, contracts, or lots traded in a given period and provides insight into the strength of price movements. By analyzing volume effectively, traders can identify trends, confirm breakouts, and detect potential reversals before they happen.
Unlike price action alone, volume adds a critical layer of confirmation. A price move supported by high volume is more likely to be sustainable, while a move on low volume may indicate weakness or manipulation. Institutions, hedge funds, and large market players leave footprints through volume, and understanding these patterns can give traders an edge.
Volume Types 🎯
Volume
Buy/Sell Volume
Delta Volume
Cumulative Delta Volume
Relative Volume
Cumulative Relative Volume
Open Interest
Volume Profile
01. Volume 🔥
In trading, volume refers to the total quantity of assets traded during a specific time frame, whether they are stocks, futures contracts, options, or currencies. It measures the activity level of a security and provides insights into the strength or weakness of price movements.
Key aspects:
Market sentiment: High volume often indicates strong interest in a security and can signal the strength of a price move. Conversely, low volume may suggest a lack of interest and can indicate that price movements may not be sustainable.
Liquidity: High volume generally indicates better liquidity, meaning it is easier to enter and exit positions without significantly impacting the asset’s price. Low volume may lead to higher slippage and greater price volatility.
Volume spikes: Extremely high volume after a prolonged trend may signal the end of that trend (blow-off tops or panic selling bottoms).
Market types: Volume can vary by market type. In stock markets, it is usually reported in shares. In futures and options, it is reported in contracts, while in Forex, it is often measured by tick volume (the number of price changes).
Impact on market orders & liquidity
High Volume = Lower Slippage: Large orders can be executed more efficiently in high-volume environments.
Low Volume = Higher Volatility: Thin order books in low-volume markets can lead to erratic price swings and wider bid-ask spreads.
02. Buy/Sell Volume 💹
Buy volume and sell volume are key metrics that indicate the level of buying and selling activity in a market. They help traders assess the strength of price movements and market sentiment.
Buy Volume
Buy volume represents the number of shares, contracts, or lots traded at the ask price (or higher). It occurs when buyers are willing to pay the seller’s asking price, indicating buying pressure and potential bullish sentiment.
How buy volume is measured:
Transactions that execute at the ask price are counted as buy volume.
In some cases, aggressive market orders (where buyers take liquidity) are considered buy volume.
Buy volume is often compared to total volume to determine demand strength.
Sell Volume
Sell volume represents the number of shares, contracts, or lots traded at the bid price (or lower). It occurs when sellers accept the buyer’s bid price, indicating selling pressure and potential bearish sentiment.
How sell volume is measured:
Transactions executed at the bid price are counted as sell volume.
Market sell orders (where sellers take liquidity) contribute to sell volume.
Higher sell volume relative to buy volume suggests downward price pressure.
03. Delta Volume ✨
Delta Volume (often referred to as Volume Delta) is a key order flow metric that measures the difference between buy volume and sell volume over a given period.
Calculation
Delta Volume is defined as: Delta Volume = Buy Volume − Sell Volume
Where:
Buy Volume is the total volume transacted at the ask price (aggressive buying).
Sell Volume is the total volume transacted at the bid price (aggressive selling).
Interpretation
Positive Delta (Buy Volume > Sell Volume): Indicates more aggressive buying, suggesting bullish momentum.
Negative Delta (Sell Volume > Buy Volume): Indicates more aggressive selling, suggesting bearish momentum.
Near Zero Delta: Indicates a balance between buyers and sellers, often seen in range-bound markets.
04. Cumulative Delta Volume ⚡
Cumulative Delta Volume (CVD) is an advanced order flow metric that tracks the cumulative sum of Delta Volume over time.
Calculation
CVD t =CVD t − 1 + (Buy Volume − Sell Volume)
Where:
Buy Volume = Volume transacted at the ask price (aggressive buying).
Sell Volume = Volume transacted at the bid price (aggressive selling).
CVD*t = Current cumulative delta value.
CVD\*{t-1} = Previous cumulative delta value.
Interpretation
Rising CVD (Positive Delta Accumulation): Buyers are dominating, indicating bullish momentum.
Falling CVD (Negative Delta Accumulation): Sellers are in control, signaling bearish momentum.
Flat or Divergent CVD: A divergence between price and CVD can indicate potential reversals or absorption by large traders.
05. Relative Volume 📉
Relative Volume (RVOL) is a key trading metric that measures current trading volume compared to its historical average over a specified period. It helps traders assess whether a security is experiencing unusual trading activity and provides insights into liquidity, volatility, and potential price movements.
Calculation
Relative Volume is typically expressed as a ratio:
RVOL = Current Volume / Average Volume Over A Given Period
Where:
Current Volume = The total shares/contracts traded in the current period (e.g., 1-minute, 5-minute, daily).
Average Volume = The average volume over a past period (e.g., 10-day average, 50-day average).
A higher RVOL (>1) means the security is trading at above-average volume, while a lower RVOL (<1) indicates below-average activity.
Interpretation
RVOL > 2: Indicates significantly higher-than-normal volume, often linked to news events, earnings reports, or breakout trends.
RVOL around 1: Suggests normal trading activity with no unusual volume spikes.
RVOL < 1: Indicates low trading activity, which may lead to weak price movements and lower liquidity.
06. Cumulative Relative Volume 💥
Cumulative Relative Volume (CRVOL) is an advanced volume metric that tracks the total volume traded throughout a session relative to its historical average at the same time of day.
Calculation
Cumulative Relative Volume compares the ongoing total volume at a given point in time to the average cumulative volume at that same time over a historical period.
CRVOL = Cumulative Volume at Time X / Average Cumulative Volume at Time X over N periods
Where:
Cumulative Volume at Time X = The total volume traded from market open up to time X.
Average Cumulative Volume at Time X = The average total volume at that point in time over a selected historical period (e.g., 10 days).
N periods = The number of historical sessions used for comparison.
A CRVOL > 1 indicates higher-than-normal trading activity, while CRVOL < 1 suggests lower-than-average activity.
Interpretation
CRVOL > 1.5: Significantly higher trading activity than usual, often linked to news events, earnings reports, or institutional participation.
CRVOL ≈ 1: Normal trading volume, suggesting typical market conditions.
CRVOL < 0.8: Below-average trading volume, often indicating low liquidity and reduced volatility.
07. Open Interest 📊
Open Interest (OI) is a key metric in derivatives markets (futures and options) that represents the total number of outstanding contracts that have not been settled or closed. It is an important indicator of market activity, liquidity, and trader commitment.
How it works?
Open Interest increases or decreases based on the interaction between buyers and sellers:
OI Increases: When a new buyer and a new seller enter the market, creating a fresh contract.
OI Decreases: When an existing buyer and seller close their positions (either by offsetting trades or expiration).
OI Unchanged: If an existing contract is transferred between traders (one trader closes, another opens an equal position).
Interpretation
Rising OI + Rising Price: Suggests strong buying interest, indicating a bullish trend with conviction.
Rising OI + Falling Price: Indicates strong selling pressure, confirming a bearish trend.
Falling OI + Rising Price: Signals a short-covering rally or weakening trend, as traders close positions.
Falling OI + Falling Price: Suggests a lack of commitment to further declines, indicating potential trend exhaustion.
08. Volume Profile 🎢
Volume Profile is a powerful market analysis tool that plots trading volume at different price levels over a specific period. Unlike traditional volume indicators, which show volume per time interval, Volume Profile reveals where the most buying and selling activity occurred, helping traders identify key support and resistance levels, market structure, and potential price reactions.
Components
Volume Profile is displayed as a histogram on the vertical axis, showing the amount of volume traded at each price level. It is built using tick data or intraday price action and is often calculated for different timeframes (daily, weekly, monthly, or custom sessions).
Key components of Volume Profile include:
Point of Control (POC): The price level where the highest volume was traded, acting as a major support/resistance zone.
High Volume Nodes (HVN): Price areas with heavy trading activity, indicating consolidation zones where price is likely to stabilize.
Low Volume Nodes (LVN): Price areas with little trading activity, often leading to fast price movements as there is little resistance or support.
Value Area (VA): The price range where 70% of the total volume was traded, representing the "fair value" zone of the market.
Value Area High (VAH) & Value Area Low (VAL): The upper and lower boundaries of the Value Area, acting as dynamic support and resistance levels.
Types
Session Volume Profile: Analyzes volume for a single trading session (daily or intraday).
Composite Volume Profile: Covers a longer period (weeks, months, or custom-defined ranges).
Fixed Range Volume Profile: Analyzes volume for a specific price range or custom-selected area.
Developing Volume Profile: Updates dynamically throughout the trading session to show real-time changes in volume distribution.
Interpretation
POC as a Magnet: Price tends to revisit the POC due to high liquidity and market agreement at that level.
Breakouts from Value Area: If price breaks above VAH with strong volume, it signals a bullish trend; if it breaks below VAL, it signals a bearish trend.
Reaction at LVN: Price moves quickly through LVN areas but may reverse or stall when approaching HVN.
Rejections at VAH/VAL: If price rejects VAH, it may return to POC or VAL, and vice versa.
09. Indicators 📦
Volume indicators help traders gauge market strength by analyzing the number of shares or contracts traded.
Volume (Default) – Displays the total volume traded per candle, often color-coded based on price movement.
Volume Profile (Fixed Range, Session, Visible Range) – Shows volume distribution across price levels to identify support and resistance zones.
Volume Weighted Average Price (VWAP) – A dynamic support/resistance line that calculates the average price based on volume.
On-Balance Volume (OBV) – Measures cumulative volume flow to detect price trends and confirm breakouts.
Money Flow Index (MFI) – A volume-weighted RSI-like oscillator that identifies overbought and oversold conditions.
Volume Delta – Measures the difference between buying (ask) and selling (bid) volume.
Cumulative Delta Volume – Tracks the cumulative sum of volume delta over time to assess buying/selling pressure.
Relative Volume (RVOL) – Compares current volume to historical averages to highlight unusual trading activity.
Key Takeaways 📋
Volume is a crucial market indicator that reflects trading activity and liquidity, often preceding price movements.
High volume confirms trends and breakouts, while low volume can signal weak or false moves.
Volume Profile identifies key support and resistance zones, with High Volume Nodes (HVNs) acting as strong barriers and Low Volume Nodes (LVNs) allowing fast price movement.
Relative Volume (RVOL) highlights unusual market activity, while Delta Volume and Cumulative Delta reveal buying and selling pressure.
VWAP serves as a dynamic support/resistance tool commonly used by institutional traders.
Volume price Volume price is my term meaning the average price for a certain traded volume in a certain period of time.
As an example, I took the BTCUSD chart
To find out at what level the largest volume is traded, there is a tool called "Fixed Volume Profile" FRVP (located on the sidebar, in the Tools for Measurement and Forecasting cell).
Here I stretched it for the period from November 14, 2020 to August 03, 2023 POC the orange line in my case (it's so convenient for me) shows the same maximum volume, and if you put a horizontal line with a price display in its place, we will see the price of 16752.88 - this is the price of volume.
That is, the largest volume was traded at this price.
A fixed volume profile can be applied on any segments of the chart, for example, from high to low, or from low to low, or from high to high, or in the sideways.
What does this give us?
Firstly, we understand at what price large capital gained or gave away its position.
Secondly, it forms the most powerful level for a certain time period (time frame).
And finally, the volume has a price.

Bull Bear Power Void - With trending background
To get this indicator on your charts (remove the old one from your favs and your chart if you have it already)
otherwise just go to this link and add it
Welcome to the coffee shop everybody in this video I am discussing the new changes to the bullet bear power void. There have been some changes to the coding because I did see your messages discussing that it was difficult to see the trend ribbon in the background so now you have an entire background that adjusts its color depending on whether the trend is positive or negative or if there is no trend.
go ahead and watch the video for the results on that one hand I also took the time to show you guys how to see a Divergence in your volume up against your price.
along with that you can also see when you should and should not re-enter the market for a continuation trade.
Black background means there is no volume or that profits are being taken off the table.
Red background means that the volume is trending bearish.
Green background means that volume is trending bullish.
One way to spot a Divergence or a slowing down in the trend is when your volume column brakes outside the void at the same time you get an equal color background, Look at the height of that volume candle and compare it to the last time that you got a similar color background with a column breaking outside the void.
If your volume Is closer to the void it was in the previous one, then you do not enter this as a continuation trade.
If you are trading bullish then your new re-entry has to have more volume than your last re-entry.
If you are trading bearish then your new volume has to be lower than your previous volume

Seting up Volume Indicators on Trading View ChartThis is basic video will show you how to set up volume indicator on a Trading View chart.


Price Volume ActionThe chart explains how we can read a trend breakout and price volume action which can be very helpful in identifying momentum.

Volume Profile - Fixed Range/Session Volume/Visible RangeVolume Profile (The explanation here is extremely detailed. The actual use I explain is the second bottom half)
1. Introduction
2. Use Options
3. Terminology
4. Example
5. Conclusion
1. Introduction
The Volume Profile is an extremely useful tool that can give you an expanded view of actual price pressure if you struggle to find support levels.
There are a number of strategies the Volume Profile was designed to be used for, but I have found over the years most of it is useless in Crypto or it can be found with better methods. I will cover what I use it for in this educational piece.
Most traders use the default Volume indicator that measures Volume based on time instead of price levels. While this is semi useful, I remove that on all of my charts and use Volume Studies that are based on price levels for a more accurate view.
The Volume Profile can be found in the indicators section on TradingView shown in the link below.
imgur.com
As a note, I do change my settings depending on how I am using this indicator. I do enable Show Values, so I may see a detailed look at actual numbers. Also, I do change the amount of rows (Row Size) depending on how detailed of a look I need for the current situation. For the most part, I disable the P.O.C., Developing P.O.C., and Developing VA. I have found these features to clutter what I am looking at and not provide me with any kind of accurate or useful information. Some traders will disagree, but in reality they are just added features that rarely apply to crypto trading as a strategy. However, there may be times when they are useful and there is actual strategies that can be used, but I will not cover them because it will waste everyone's time.
2. There are 3 different ways to use it:
Fixed Range- This is used for a set number of candles. Upon clicking this, you then select the area you would like to study. This is extremely useful when studying past fractals and how they would apply to current price action. Also, they are useful when studying how a catalyst or black swan affected the price of an asset for future theories and trading preparation.
Shown below is a Fixed Range from December 10th to the 19th for Ethereum. ($415-$861)
Session Volume- This measurement takes the Daily close no matter what time frame you are viewing and sets individual measurements for that 24 hours.
Shown below is a the last 3 days as of this writing for Ethereum.
Visible Range- This option is useful for quick views of price levels that automatically adjust as you zoom in and out of the chart. Whatever candles are visible on the chart, it shows trading Volume at those price levels.
Shown below was Ethereum's last rally from $300-$1,425 and current correction. (Values have been disabled & row amount/size is set at 100)
3. Terminology
Point of Control (P.O.C.) – The price level for the time period with the highest traded volume.
Profile High – The highest reached price level during the specified time period.
Profile Low – The lowest reached price level during the specified time period.
Value Area (VA) – The range of price levels in which a specified percentage of all volume was traded during the time period. Typically, this percentage is set to 70%. However, it is up to the trader’s discretion.
Value Area High (VAH) – The highest price level within the value area.
Value Area Low (VAL) – The lowest price level within the value area.

BTCEUR, example of a trend break after active accumulation.Example of a trend break after active accumulation.
The analysis was performed using the X-volume indicator. Thin vertical dashed lines indicate candles with active accumulation. The blue dashed lines indicate the process of redistribution. For details, refer to the instructions for the indicator. It should be noted that it is not true to speak of a trend change analyzing only a few bars.

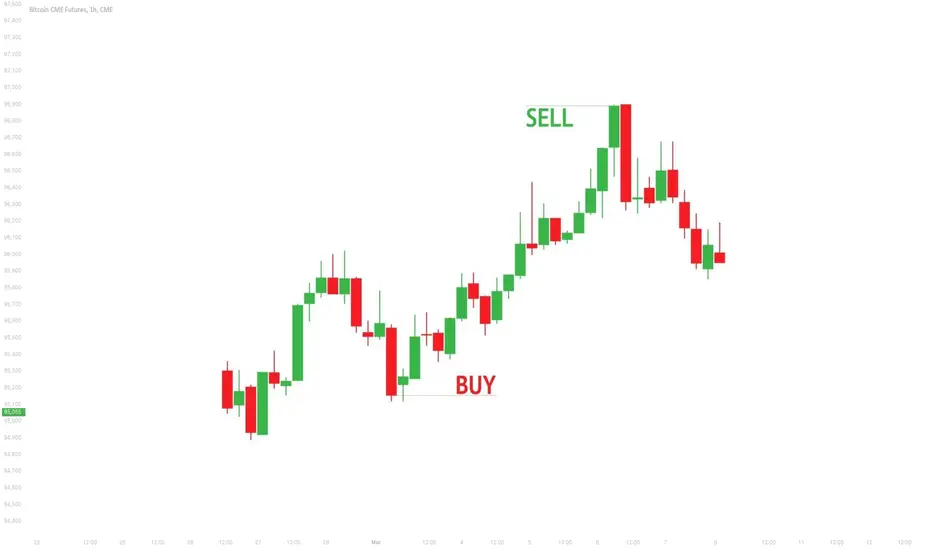
How I trade.This is how I trade. I can get very good Risk:Reward ratio using this strategy. I also use Pivot, Fibonacci and Volume analysis to assist my trading.
