BTCUSDT: Pullback Toward Demand ZoneHi!
Bitcoin is showing short-term weakness after failing to hold above the recent high. Price is currently trading below the local resistance area, suggesting a corrective pullback rather than continuation.
The highlighted demand zone around 90.4K–90.9K is a key area to watch. This level previously acted as resistance and was later flipped into support.
Key Levels:
• Resistance: 93.1K–94.4K
• Demand / Support: 90.4K–90.9K
Downside Target:
• 90,500 (primary demand zone)
As long as price remains below resistance, a deeper retracement into demand is likely. Reaction at support will determine the next directional move.
1-BTCUSD

Bitcoin (D1) - Breaks The Channel - Liquidity Grab Complete ?📝 Description 🔍 Setup (Market Structure) BINANCE:BTCUSDT
Bitcoin was trading inside a well-defined descending channel on the Daily timeframe.
Price has now broken above the channel resistance, showing early signs of trend reversal.
Key confluences:
Multiple support reactions inside the demand zone
Breakout supported by EMA & cloud shift
Strong base formation near higher-timeframe support
Momentum gradually shifting from sellers to buyers
📍 Support & Resistance
🔴 Support Zone: 83,700 – 87,300
🟢 1st Resistance: 107,500
🟢 2nd Resistance: 118,000
#Bitcoin #BTCUSDT #CryptoTrading #PriceAction #ChannelBreakout #SupportResistance #TradingView #Kabhi_TA_Trading
⚠️ Disclaimer
This analysis is for educational purposes only.
Crypto markets are highly volatile — always manage risk and use proper position sizing.
💬 Support the Analysis👍 Like if you trade BTC 💬 Comment: Breakout confirmed or needs retest?

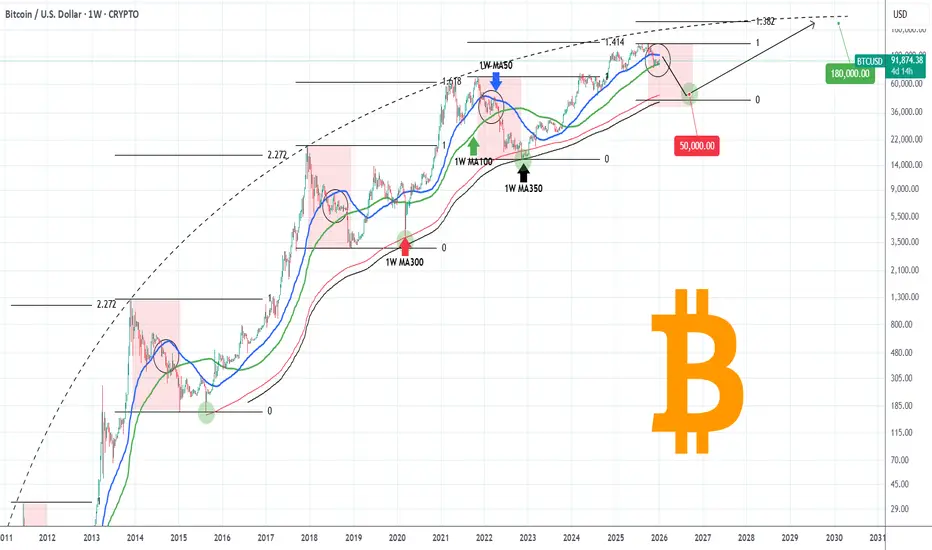
BITCOIN Can it reach $50000 during this Bear Cycle?Bitcoin (BTCUSD) has already started its new Bear Cycle since its October All Time High (ATH). We're past that, we've covered this extensively during the past 3 months. What's more important now is to cover the next stages, which is something we've started doing recently, in order to get a better understanding of the potential course of this Bear Cycle.
Right now BTC is consolidating within its 1W MA50 (blue trend-line) and 1W MA100 (green trend-line), which is a familiar pattern during all prior Bear Cycle, where after a 1W MA50 rejection, it starts Stage 2 of the Cycle.
The last Bear Cycle bottomed exactly on the 1W MA350 (black trend-line). The two before it, hit the 1W MA300 (red trend-line) before rebounding (and it was a secondary Low). As a result the 1W MA300-350 form a strong Support Zone and is the strongest candidate for the new bottom as well. Contact with the 1W MA350 (based on its current trajectory) should be made around $50000. A 45-50k potential Buy Zone would be more fair.
In any case, based on BTC's parabolic growth curve and the diminishing Fibonacci extension on each Bull Cycle Top, we expect the next ATH to be on its 1.382 Fib extension, i.e. around $180000.
Is that a trading plan you would follow if you were a long-term investor? Feel free to let us know in the comments section below!
---
** Please LIKE 👍, FOLLOW ✅, SHARE 🙌 and COMMENT ✍ if you enjoy this idea! Also share your ideas and charts in the comments section below! This is best way to keep it relevant, support us, keep the content here free and allow the idea to reach as many people as possible. **
---
💸💸💸💸💸💸
👇 👇 👇 👇 👇 👇
BTC: The Premium Zone Trap (4H vs 1H)Bitcoin is at a decisive junction. We are trading in the Premium Zone ($93,700+) with a clear conflict between timeframes. The 4H screams exhaustion (RSI 70.7 + Low Volume), while the 1H structure remains stubbornly bullish, holding above the $92,102 demand zone. The structure is intact, but the conviction is missing.
1. THE TECHNICAL REALITY (4H + 1H)
📉 We are seeing a divergence between price action and momentum:
• The Trap (4H): Price is in the Premium sell zone. RSI is overbought (70.7) and volume is down 41% at these highs. This is classic "divergence" behavior, price grinding up while participation drops.
• The Floor (1H): Despite the macro exhaustion, the 1H timeframe has cooled off (RSI 42.9) and is respecting the Ascending Support Trendline ($92,306).
• The Magnet: We have a bearish OB supply overhead at $94,760, but a juicy unfilled FVG sitting below at $90,189. Price hates leaving these gaps open.
2. THE CONFLICT: MOMENTUM VS. STRUCTURE ⚖️
Bearish Case (The Exhaustion):
• Volume has collapsed 66% on the 1H timeframe.
• MACD is printing bearish divergence on the 4H.
• 14.1% wick rejection at the $94,760 local top suggests sellers are active.
Bullish Case (The Trend):
• CHoCH and BOS are both confirmed bullish.
• Price is holding above all major EMAs (20/50/200).
• Buyers are defending the $92,102 Order Block.
3. THE TRADE SETUP 🎯
We play the reaction, not the prediction. Here are the two probability paths:
🔴 Scenario A: The Premium Rejection (Higher Probability) If volume fails to return, gravity takes over.
• Trigger: Loss of the 1H support trendline ($92,300)
• Target 1: $90,189 (Filling the 4H FVG)
• Target 2: $86,760 (Major Swing Low)
• Invalidation: 4H Close above $94,760
🟢 Scenario B: The Demand Reclaim If the 1H structure holds, we squeeze the shorts.
• Trigger: Bounce from $92,102 (Bullish OB) with increasing volume
• Target: $94,760 (Range High) → $96,000 Extension
• Stop: Tight below $91,900
MY VERDICT Short-term structure is bullish, but the "fuel" (volume) is empty. I am leaning 68% bearish (expecting a sweep of the $90k FVG) unless we see a massive volume injection above $94k. Patience is the play, let the $92,100 level dictate the next move.
MARKET ROTATION WATCHLIST
📋 While Bitcoin consolidates in this premium zone, liquidity often rotates into specific altcoin setups that are lagging behind.
I am updating my watchlist today for coins that are showing cleaner structure than BTC.

Rejection from Supply Zone Signals Potential Pullback to Key Dem
This is a 2-hour BTC/USD chart showing a structured market move framed by clear supply and demand zones
Supply Zone (Top, ~94k–95k
Price rallies into this upper resistance area and gets rejected, indicating strong selling pressure and exhaustion of the bullish move.
Demand Zone (Bottom, ~86k–87k):
A well-defined accumulation area where buyers previously stepped in, acting as a likely downside magnet if price continues lower.
Ascending Channel:
BTC previously trended higher within a rising channel, making higher highs and higher lows. The recent price action shows a **breakdown from the channel**, signaling weakening bullish momentum.
Consolidation & Key Levels:
The horizontal zone around ~89,978 marks a former consolidation and key support. Price is currently hovering near this level, suggesting it is a critical decision point.
Bearish Projection:
The dashed levels and downward arrows indicate a potential continuation lower with targets first near 87,756 and possibly deeper toward the demand zone if support fails.
Overall Interpretation:
The chart suggests a short-term bearish correction after a strong uptrend, driven by rejection at supply. Unless BTC reclaims the broken channel and consolidation support, price is likely to seek liquidity at lower demand levels before any meaningful bounce.

BITCOIN Realized Price shows where the bottom might be.Bitcoin (BTCUSD) has always priced its bottom below its Realized Price (red trend-line) on every signal Bear Cycle it had.
In fact the bottom was considerably lower than the Realized Price. The last two Bear Cycles (2022 and 2018) have had fairly similar bottoms, dropping by -33.80% and -35.45% respectively from the moment the price broke below the Realized Price.
Based on where the Realized Price is now (which by the time BTC hits it, will be lower) a rounded up -30% decline would have us reach $39000. The Realized Price deviation band (orange cloud) however would be just under $45000 towards the end of the year (which is roughly when we expect the Bear Cycle to end)
As a result, a fair bottom zone could be $45000 - $39000.
Do you think that's a feasible level to expect? Feel free to let us know in the comments section below!
---
** Please LIKE 👍, FOLLOW ✅, SHARE 🙌 and COMMENT ✍ if you enjoy this idea! Also share your ideas and charts in the comments section below! This is best way to keep it relevant, support us, keep the content here free and allow the idea to reach as many people as possible. **
---
💸💸💸💸💸💸
👇 👇 👇 👇 👇 👇

BTCUSD - Potential Daily Forecast== Technical Outlook ==
Looking at recent price action, we saw a strong bullish impulse from around the $86,000 level up to the $94,000 level. Following today's disappointing ADP jobs figures from the US, we observed continued gains in the greenback due to risk-off sentiment. Nasdaq and gold prices also declined after the report, as it reinforced conviction that the Fed will refrain from slashing interest rates, in line with Powell's recent statements.
Bitcoin is currently finding support at the 50% Fibonacci level, with a strong demand zone around the $90,000 level. If we see another bullish impulse to the upside, this could break through the resistance at $94,000 and potentially push prices back up to the $100,000 level.
== Fundamental Backdrop ==
The split vote and Chair Jerome Powell’s carefully calibrated tone made clear that policymakers are in no rush to accelerate the easing cycle. Officials want greater confidence that the labor market is cooling in an orderly way and that inflation, which Powell described as “still somewhat elevated,” is on a convincing path back to target.
During the press conference, Powell stressed that the Fed feels well positioned to respond to incoming data, but he offered no hint of an imminent follow-up cut. At the same time, he firmly dismissed the idea of rate hikes, which he said do not feature in the baseline outlook.
On inflation, Powell pointed directly to import tariffs introduced under President Donald Trump as a key factor keeping price pressures above the Fed’s 2% target for now, reinforcing the sense that some of the inflation overshoot is policy-driven rather than demand-led.
With that said, markets will now focus on this Friday's jobs data. It's been common in the past to have a negative ADP report but a positive NFP, which is why we might not see Bitcoin continue to sell off heading into this Friday's report.

Bitcoin Roadmap — Short-Term Bounce Before ContinuationAs I expected in the previous idea , Bitcoin ( BINANCE:BTCUSDT ) started to decline from the upper line of the ascending channel and reached its targets (full target).
Bitcoin is currently near the support zone($90,960-$89,220) around the lower line of the ascending channel and the Cumulative Long Liquidation Leverage($89,125-$88,670).
From an Elliott Wave perspective, it appears that Bitcoin has completed a zigzag corrective pattern at the top of the ascending channel, and we should now expect a corrective wave. However, this corrective wave might still include a temporary upward movement.
Considering the increasing tensions in global affairs, especially between Russia and the U.S. in recent hours, and the conditions of the S&P 500 index ( FX:SPX500 ), we can still expect a bearish trend for Bitcoin.
I expect that after a short-term bullish movement in the coming hours, Bitcoin will once again begin to decline. This decline could involve breaking the lower line of the ascending channel, the support zone, and filling the CME gap($88,720-$88,120).
We can first look for a long position, and if we find a trigger, we can take a short position.
What do you think about Bitcoin in the short term? I’d love to hear your thoughts!
Cumulative Long Liquidation Leverage: $87,125-$86,000
Cumulative Short Liquidation Leverage: $92,620-$92,040
Cumulative Short Liquidation Leverage: $94,630-$93,920
Cumulative Short Liquidation Leverage: $98,480-$96,970
💡 Please respect each other's opinions and express agreement or disagreement politely.
📌Bitcoin Analysis (BTCUSDT), 1-hour time frame.
🛑 Always set a Stop Loss(SL) for every position you open.
✅ This is just my idea; I’d love to see your thoughts too!
🔥 If you find it helpful, please BOOST this post and share it with your friends.

BTC/USD H4 – Pausing to Consolidate the UptrendHello everyone,
Looking at the BTC/USD H4 chart, what stands out to me is not the few recent red candles, but the way the market is slowing down after a very decisive rally. After moving from the 88,000 area up toward nearly 95,000, Bitcoin has started to cool off and pull back into the 92,000–93,000 zone. To me, this is a fairly natural price reaction following a strong advance, as capital needs time to rebalance before the market commits to its next directional move.
From a technical standpoint, the medium-term bullish bias has not been compromised. Price is currently pulling back into the confluence zone of EMA 34 and EMA 89 — an area that often acts as a “support base” within a healthy trend. The fact that BTC continues to hold above the slower EMA suggests that bullish momentum has not been broken, and that the current retracement is more consistent with short-term profit-taking than with genuine distribution.
A constructive detail lies in the price behavior during the recent pullback. Selling volume has not expanded, while the corrective candles show narrower ranges compared to the prior impulsive advance. This indicates that supply pressure is fading, while buyers have not stepped aside. Historically, this type of price action often leads to a brief consolidation phase before the market resumes its primary direction.
Stepping back from the chart to look at the broader context, the current macro backdrop remains supportive for Bitcoin. Recent US economic data point to easing inflation while growth remains moderate. This makes a shift toward a more aggressive monetary stance less likely, helping to preserve a relatively stable “risk-on” environment for risk assets.
In addition, early-year market sentiment has improved noticeably after the holiday period.
Capital is flowing back into equities and crypto, and Bitcoin is often among the first beneficiaries when risk appetite improves. Reports from international financial media also suggest that institutional money has not exited the market, but is instead repositioning after the strong year-end rally — a narrative that aligns well with what the H4 chart is currently showing.

BTC Intraday – Context UpdateAfter yesterday's decline, the price is now trading at 91,150.
From here, I am watching for a potential continuation of the decline to 90,300-90,000, where there is a zone of strong reaction.
This zone will be key:
-No buyer reaction and pressure → the decline may continue.
-Buyer acceptance and reaction → potential intraday long context, only with confirmation.
At this stage, this is a contextual reflection, not a signal to execute.
Bias follows structure — execution follows confirmation.
Stay tuned for updates as the structure develops.

The Language of Price | Lesson 17 – Chart Patterns Practice (2)Lesson Focus: Chart Pattern Types (Practice - Part 2)
This chart continues the educational exploration of chart patterns by observing how market structure is visually organized through price movement, without the use of indicators.
Chart patterns themselves do not influence price.
They are visual outcomes of previous market interaction between buyers and sellers.
📌 CONTEXT OF THIS EXAMPLE
BTCUSD is used here only as a neutral visual sample to demonstrate how certain price structures can appear on a real chart.
• No trading activity is suggested
• No execution concepts are presented
• No future expectations are implied
The purpose is to observe structure , not to derive conclusions or actions.
📊 STRUCTURES SHOWN ON THE CHART
The chart highlights several commonly observed price formations:
• Ascending Channel – orderly upward movement showing controlled demand
• Symmetrical Triangle – gradual price compression caused by balanced pressure
• Double Bottom – a repeated reaction area where downside momentum weakened
These formations help explain how price can organize itself during different phases of market participation.
🧩 STRUCTURAL INSIGHT
Candlesticks and chart patterns do not move markets.
They reflect how participants have previously responded to price .
Market structure becomes clearer when attention is placed on:
• where reactions occur
• how pressure builds or fades
• how price behaves within defined zones
rather than treating patterns as signals or decision tools.
ETHICAL & EDUCATIONAL NOTICE
This content is presented solely for educational and analytical purposes , based on historical price data.
It does not promote or encourage trading, speculation, leverage, margin usage, gambling, short selling, or interest-based activity .
Readers are encouraged to align any financial activity with their own ethical, legal, and religious principles .
⚠️ DISCLAIMER
This material is strictly educational and informational .
It does not constitute financial advice, investment recommendations, or trading instructions.
The author does not provide personalized guidance.
Any decisions made based on this content are the sole responsibility of the individual.

Bitcoin CME Gaps (1H)Bitcoin currently has two unfilled CME gaps located in the lower price regions. Historically, CME gaps tend to act as strong magnets for price, as Bitcoin often revisits these areas to fill the gaps before resuming its primary trend. While this behavior is not guaranteed, it has occurred frequently enough to be considered an important factor in technical analysis.
At the moment, the first CME gap is positioned in the 91K–90K zone, which represents a relatively shallow pullback area and could be tested during a normal corrective move. If selling pressure increases or the market enters a deeper retracement phase, the second CME gap located around 88K may come into play as a stronger downside target.
These levels should be monitored closely, as price reactions around CME gaps can provide valuable insight into market strength, liquidity absorption, and potential trend continuation. A clean fill followed by strong bullish confirmation could indicate that the market is preparing for the next leg higher. Conversely, failure to reclaim these levels may suggest extended consolidation or deeper correction.
As always, CME gaps should be analyzed in confluence with other technical tools such as market structure, support and resistance zones, volume behavior, and momentum indicators. They are not standalone signals, but when combined with broader market context, they can significantly improve trade planning and risk management.
If you have a coin or altcoin you want analyzed, first hit the like button and then comment its name so I can review it for you.
This is not a trade setup, as it has no precise stop-loss, stop, or target. I do not publish my trade setups here.

BTC : This May Be Your Last Chance Before Exploding to Upside !!It can be said that if Bitcoin manages to break above 97k, it could easily reach 150k and begin new bullish waves.

Bitcoin Pumps With Gold & S&P — But Is a Pullback Coming First?Bitcoin ( BINANCE:BTCUSDT ) started the new week with bullish momentum, pumping alongside Gold( OANDA:XAUUSD ) and the SPX500 Index( SP:SPX ).
At the moment, Bitcoin is trading within a resistance zone($94,840-$93,020), close to the upper line of the ascending channel, while also moving around the Cumulative Short Liquidation Leverage($94,970-$94,300).
From an Elliott Wave perspective, it appears that Bitcoin is in the process of completing microwave 4 of the main wave C.
My expectation is a minimum pullback toward the Cumulative Long Liquidation Leverage($92,190-$91,610) and the nearby support zone($90,960-$90,090). From that support zone($90,960-$90,090), we can look for a potential renewed bullish move.
Note: If geopolitical tensions in the Middle East escalate, a sudden and sharp drop in Bitcoin is possible.
Note: If Bitcoin breaks and holds below the support zone($90,960-$90,090), we should be prepared for a deeper downside continuation.
Cumulative Long Liquidation Leverage: $87,140-$86,210
Cumulative Short Liquidation Leverage: $98,480-$96,970
CME Gap: $91,595-$90,530
CME Gap: $88,720-$88,120
First Target: $90,029
Second Target: $90,867
Stop Loss(SL): $96,223(Worst)
Points may shift as the market evolves
💡 Please respect each other's opinions and express agreement or disagreement politely.
📌Bitcoin Analysis (BTCUSDT), 1-hour time frame.
🛑 Always set a Stop Loss(SL) for every position you open.
✅ This is just my idea; I’d love to see your thoughts too!
🔥 If you find it helpful, please BOOST this post and share it with your friends.

BTCUSD H4 | Bullish Bounce Off 61.8% Fib SupportThe price is falling towards our buy entry level at 89,685.29, which aligns with the 61.8% Fibonacci retracement.
Our stop loss is set at 86,649.35, which is a pullback support.
Our take profit is set at 93,898.42, which is a multi swing high resistance.
High Risk Investment Warning
Stratos Markets Limited (

BITCOIN: Slips LowerBitcoin has experienced another bout of selling in recent hours but remains above the $92,000 level. Our primary outlook still calls for a significant move lower as part of green wave C—specifically, into the green Target Zone between $62,250 and $51,212, where we expect the low of the larger orange wave a to form. After that, we anticipate an extended (though corrective) b-wave rally, which could potentially push back toward the $100,000 mark. Only after this move do we foresee the final leg down in the ongoing wave-(ii) correction.

BTC: Looking for one last leg down toward 78k?The General Outlook It looks like Bitcoin might be in the final stages of this corrective move. Before we see a real reversal, the market likely needs to complete the structure with one more push lower.
There are two main ways this could play out. We might see a direct, sharp drop where support levels break relatively quickly. Alternatively, it could turn into a "diagonal" style move—this would be choppier and slower, with lots of overlapping bounces, but the destination would likely be the same.
The Key Level The bears seem to be in control as long as the price stays below the recent high of $94,800. If we get a sustained break above that level, this immediate bearish setup is probably invalid.
First Target: Watch for a reaction around $85,500.
Second Target: A sweep of the lows near $80,300.
Final Target: The move could potentially finish somewhere in the $76,000 – $78,000 zone.
Just my thoughts on the chart

Elite | BTCUSD – 1H | Market Structure & Key Reaction ZoneBITSTAMP:BTCUSD COINBASE:BTCUSD
After a strong impulsive rally toward the 95,000 resistance region, BTCUSD entered a corrective phase. The current decline shows controlled selling pressure rather than panic distribution. Price is consolidating around a key demand zone, suggesting potential absorption of sell-side liquidity before the next directional move.
Key Scenarios
✅ Bullish Case 🚀
If price holds above the demand zone and shows acceptance, continuation targets remain:
🎯 92,500
🎯 94,800
🎯 96,000+
❌ Bearish Case 📉
A clean breakdown and sustained close below the demand zone would invalidate the bullish continuation and expose downside toward the lower range support.
Current Levels to Watch
Resistance 🔴: 92,500 – 95,000
Support 🟢: 89,000 – 90,000 (Key Demand Zone)
⚠️ Disclaimer: This analysis is for educational and informational purposes only. It is not financial advice. Please conduct your own research before trading.

BITCOIN | DANCING ON THE EDGE OF FAILURE Traders,
First of all, happy new year. I hope everyone had a great holiday season. Going into the new year, I think there is a real chance that Bitcoin is setting up for a meaningful dump. To understand why, we need to look beyond price and ask the real question: who is actually driving this move?
Market context
Since January 1st, Bitcoin has been grinding higher again. Not through impulsive expansion, but through a slow, overlapping auction into the highs. This type of price action often appears near transitions rather than continuation.
Participation and flow
Looking under the hood, participation tells an important story:
Aggregated CVD across major venues continues to make higher highs, showing persistent aggressive buying
Price, however, is not expanding with that aggression and is starting to stall
Spot participation is present, but remains reactive rather than initiatory
Derivatives are clearly the dominant driver of this move, meaning aggressive buying is getting absorbed
On top of that, we now have a hidden bearish divergence on aggregated flow. Price is printing a lower high into resistance, while aggregated CVD, especially stablecoin margined futures, continues to push higher. More aggression with less progress is typical behavior during absorption and distribution.
Structural confluence at the highs
Structurally, price is trading at a major confluence area. The current high aligns with the 1.618 Fibonacci extension of the prior impulse leg, measured from the swing low into the retracement that pulled back into the golden pocket between 0.618 and 0.65. From a mathematical perspective, this is a classic harmonic sequence where reactions are statistically common.
Price failed to accept above this level. Instead, we printed a clear SFP and liquidity sweep, briefly trading above prior highs to trigger stops before rotating back below. This suggests upside liquidity was collected rather than defended.
Higher timeframe structure and weak lows
Zooming out to the higher timeframe adds another important layer. On the daily chart, multiple weak lows stand out.
The April 7 low is weak. It is defined by multiple wicks into the same area, shows no meaningful excess, and sits just above an unfilled FVG. From an auction perspective, this is unfinished business.
In addition, there is another weak low above, formed in similar fashion with repeated tests and no clean excess. This reinforces the idea that downside structure has not been properly resolved yet.
Weak lows rarely hold indefinitely. Once distribution higher up is complete, the market tends to revisit and sweep these levels to finish the auction.
Levels and expectations
Downside expectations:
Sweep of the more recent weak lows
Continuation toward the April 7 weak low
Expansion into the lower liquidity pocket
Final downside target around 64k
Upside levels to watch:
The first overhead supply zone marked by the lower grey box (around 98k)
The higher resistance zone marked by the upper grey box (between 103-105k)
Any move into these areas without acceptance would further support a distributional environment
Conclusion
In summary, we have leverage driven upside, aggressive buying being absorbed, a hidden bearish divergence, a failed acceptance at a 1.618 extension, a confirmed liquidity sweep at the highs, and multiple weak lows below price. Until price can reclaim and hold above the current resistance area, the path of least resistance remains downward.
Remember: markets do not move because of opinions. They move to finish auctions and punish those who mistake activity for progress.
---------
If you find value in viewing the market through the lens of auctions, structure, and participation, feel free to leave a like or a comment. It helps more than you might think.
From the sands before the storm,
- ThetaNomad

XAGUSD: $70 support breakdown setup🛠 Technical Analysis: On the 4-hour chart, silver (XAGUSD) is reversing from its recent peak and attempting to advance toward a key support zone near 70.0. The SMA50 is currently acting as support. The chart suggests a more reliable selling opportunity will only arise after a confirmed break below 70.0, which would signal a continuation of the bearish trend. In this case, the next bearish magnet would be the noted support at 64.515 (near the SMA200).
———————————————
❗️ Trade Parameters (SELL)
———————————————
➡️ Entry Point: Sell on a confirmed breakdown below 70.0 (approx. 69.887 – 70.00)
🎯 Take Profit: 64.515
🔴 Stop Loss: 75.276
⚠️ Disclaimer: This is a potential trade idea based on current analysis; market conditions and price direction are subject to change based on news factors and volatility.

BTC on US open and US ISM ServicesWatching US Open and the US #ISM services data closely...
Expecting that New York fakedumps towards ~$91k, and 30 minutes later US ISM services slightly miss (lower then expected) and pumps up the market...
Patience is key...
#Trading #Bitcoin #CryptoMarket #StockMarket

BTC rejected from resistance: Bear flag formingBitcoin has reacted strongly from higher-timeframe resistance and we can already see that rejection down. After the strong selloff, price is now pulling back in a tight corrective structure, a bear flag.
This pullback is simply the market “breathing” after the impulse.
I would wait for price to break down out of the flag to confirm continuation of the prior bearish move, with the target towards $91,000 zone as a round psychological target.
In case price breaks back above the corrective structure and starts reclaiming resistance with volume, then this bearish setup is invalid, but for now, for me it leans bearish.

Selena | BTCUSD – 15M | Range Break → Channel ContinuationBINANCE:BTCUSD BITSTAMP:BTCUSD
After accumulating in a tight range, BTC expanded impulsively and formed a rising channel. The first channel high acted as temporary resistance, causing a healthy retracement. Price is now holding above the demand zone inside the channel, suggesting continuation rather than reversal. No bearish BOS is present — structure remains bullish.
Key Scenarios
✅ Bullish Case 🚀
If price holds above the marked demand / channel support, continuation toward equal highs and external liquidity is expected.
🎯 Target 1: 95,000
🎯 Target 2: 95,800
🎯 Target 3: 96,200 (HTF liquidity zone)
❌ Bearish Case 📉
A strong 15M close below the demand zone and channel support would invalidate the setup and signal deeper correction.
Current Levels to Watch
Resistance 🔴: 95,000 → 96,200
Support 🟢: 93,000–93,300 (Entry / Demand)
⚠️ Disclaimer: This analysis is for educational purposes only. Not financial advice.
