CAUTION: BITCOIN'S CORRECTION JOURNEY TO $96,050Bitcoin has hit a resistance wall with a double top on the weekly as well as the monthly timeframe. What's even more concerning for bulls is the RSI divergences on these time frames. Volume has been drying up as price was hitting new all time highs while momentum was also declining. Now the smoke has now lit up into a flame and the big correction is in progress.
I am expecting an A-B-C correction to an initial target of $96,050 where bulls will step up buying pressure to go up to make either a higher high or a lower high on the weekly chart. Stay tuned for further update.
Cheers fellow traders!
1-BTCUSD

BITCOIN on a 6-month Low! Bear Cycle starting based on GOLDBTC?Bitcoin (BTCUSD) hit $96000 today for the first time in 6 months (since May 07). For a long time we presented evidence (spearheaded by the 4-year Cycle) of why October was a strong candidate for a market top and so far this continuous correction validates all the data.
Today we circle back to an old favorite of ours, the GOLDBTC ratio. During the previous Bull Cycle, a Double Bottom on that ratio was what confirmed the start of BTC's 2022 Bear Cycle. On the current Cycle, we had this Double Bottom in August and since then, the GOLDBTC ratio has been rising.
Even on previous Cycles, a rise on this ratio always coincided with a BTC Bear Cycle. Based on that evidence too, the next Bitcoin Bear Cycle should be over before 2026 ends.
As a side-note for investors, keep in mind that a rise on the GOLDBTC ratio doesn't necessarily mean that Gold will rise while only Bitcoin falls. Both can fall at the same time, the ratio highlights pace, it just indicates that Gold can also decline in value but less aggressively than Bitcoin.
So are we in a Bitcoin Bear Cycle? Feel free to let us know in the comments section below!
---
** Please LIKE 👍, FOLLOW ✅, SHARE 🙌 and COMMENT ✍ if you enjoy this idea! Also share your ideas and charts in the comments section below! This is best way to keep it relevant, support us, keep the content here free and allow the idea to reach as many people as possible. **
---
💸💸💸💸💸💸
👇 👇 👇 👇 👇 👇

DeGRAM | BTCUSD BTCUSD is aiming to reach a key support level.📊 Technical Analysis
● BTC is approaching a major confluence zone where the long-term support line meets the key demand area near 94k–92k. This level previously triggered strong reversals.
● Price remains inside a broad falling structure, and a bounce from the lower boundary would confirm trend exhaustion and open room for recovery toward 102k–108k.
💡 Fundamental Analysis
● FXStreet reports renewed inflows into BTC ETPs and improving risk sentiment as markets expect milder Fed policy, supporting medium-term bullish pressure.
✨ Summary
BTC nearing 94k–92k demand; bounce may target 102k–108k. Key support: 92k. Break above falling trend = continuation.
-------------------
Share your opinion in the comments and support the idea with a like. Thanks for your support!

BTCUSD | London Session | Bullish Structure BalanceThe monthly bullish structure balance has now been filled, and the higher-timeframe map remains intact.
BTC continues to rotate inside a bullish range and is still positioned in the discount zone.
Range boundaries:
• Range low (invalidation): 78.167
• Range high (continuation): 123.231
As long as price holds above the range low, the bullish bias stands.
- Market Structure Mapping (MSM) — Current View
The structural picture is straightforward:
BTC is holding a clean range.
There is no breakdown. No structural shift.
The architecture is stable.
Cross-market structure adds context:
• The U.S. dollar sits directly on a major volume node.
If the dollar pushes higher from here, risk assets usually feel it.
If the dollar softens, crypto keeps its bullish rotation.
• FX majors recently cleared liquidity lows, resetting the structural map.
• Crypto majors remain balanced with no directional damage.
This is a classic data-waiting phase.
The structure is already drawn. The market is waiting for a catalyst to decide the next expansion path.
- Precision Execution Modeling (PEM) — Guidance for Volatile News Days
When heavy data is on the calendar, PEM shifts the playbook:
• Do not react to the first spike.
The wick is emotion. The candle close is intent.
• Step back to higher timeframes.
4H and 1D candles filter out noise and reveal real direction.
• Expect wicks to violate levels without changing structure.
Large funds do not trigger algorithms on a random spike; they react to confirmed structure.
• Protect capital until the market shows its hand.
In fast conditions, patience is a position.
CORE5 :
If you need excitement, watch Netflix. If you need results, wait for the candle close.
— CORE5DAN
Institutional Logic. Modern Technology. Real Freedom.

GOLD ranging.GOLD has been consolidating.Waiting to see if it will BreakOut after news or keep raning until markets reopen after today.

Bitcoin is Still Bearish (12H)Bitcoin still looks bearish | it seems to be inside wave C, and this upward move could be aimed at collecting sell orders and liquidating part of the short positions held by retail traders.
From the yellow circle, the price could get rejected toward TP1 and TP2.
Let’s wait and see what happens.
For risk management, please don't forget stop loss and capital management
When we reach the first target, save some profit and then change the stop to entry
Comment if you have any questions
Thank You

ANFIBO | BTCUSD - $94.000 or $70.000? [11.6.2025]Hi traders, Anfibo's here!
BTCUSD – Technical Outlook
Technical Structure:
Price action currently respects a descending channel, with:
- Upper boundary (resistance): around $106,000 – $107,000
- Lower boundary (support): converging with the D1 trendline and the 0.618 Fibonacci retracement zone, located between $94,000 – $95,000
This confluence area at $94,000 – $95,000 will be crucial. It not only represents technical alignment between multiple structures (Trendline + Fibonacci) but also marks the boundary where short-term sentiment could shift from corrective to impulsive.
Trading Strategy:
Our tactical approach remains straightforward and adaptive:
“Trade the trend when touched – reverse the bias if the trend breaks.”
#1 – Rejection at Upper Boundary:
Should BTC retest the 106–107k resistance and fail to break through, short-term sell opportunities may arise targeting the mid-range or lower boundary (95k region).
#2 – Reaction at Lower Boundary:
If price reaches the 94–95k support zone and holds, this area could offer high-probability long entries, particularly if accompanied by bullish divergence or strong volume confirmation.
#3 – Breakdown of Structure:
A clean break below $90,000 would signal structural weakness, exposing BTC to the next major support cluster between $80,000 and $70,000. Such a move would represent a deeper corrective leg in the broader cycle and could reset the market’s medium-term trend.
Trading Plan:
>>> SELL ZONE: (x1000)
ENTRY: 106 - 108
SL: 109
TP: 95
>>> BUY ZONE:(x1000)
ENTRY: 93 - 95
SL: 90
TP: 120
Risk Management:
- Stick to small-to-medium positions within the range; increase size only on confirmed breakouts.
- Keep stops tight, as sideways phases tend to trigger false signals.
- Maintain Risk:Reward ≥ 1:2 and avoid overtrading in choppy conditions.
- Reassess bias once the channel is clearly broken.
Conclusion:
BTC is currently in a compressed, corrective phase, moving within a defined range. The key battleground lies between $95,000 and $107,000. Traders should remain flexible, respecting both boundaries of the channel and reacting based on breakout confirmations rather than anticipation.
As long as BTC holds above the $94,000 – $95,000 confluence, the broader bullish structure on the daily timeframe remains intact. However, a decisive break below $90,000 would open the door for a larger-scale correction toward the $80,000 - $70,000 zone—where long-term accumulation could once again become attractive.
GOODLUCK GUYS!!!

BITCOIN SIGNAL: HERE IS WHATS NEXT!!!! (boom)Yello Paradisers! Enjoy the video!
And Paradisers! Keep in mind to trade only with a proper professional trading strategy. Wait for confirmations. Play with tactics. This is the only way you can be long-term profitable.
Remember, don’t trade without confirmations. Wait for them before creating a trade. Be disciplined, patient, and emotionally controlled. Only trade the highest probability setups with the greatest risk to reward ratio. This will ensure that you become a long-term profitable professional trader.
Don't be a gambler. Don't try to get rich quick. Make sure that your trading is professionally based on proper strategies and trade tactics.

The future of Bitcoin in the coming yearA significant crash in Bitcoin is approaching.
Following the failure of the head-and-shoulders top pattern and weekly close below it, Bitcoin faces a major decline.

BTC CRACK! UPDATE WARNING!!⚠️ BTC CRACKS — Officially in a Bear Market (-24%)
Bitcoin has now broken below $97,000, down 24% from its highs, officially entering bear-market territory.
I’ve been warning about this setup for months — not because I enjoy being bearish, but because the structure was screaming caution.
This isn’t a “buy-the-dip” moment or a garden-variety correction. We’ve hit a major technical and psychological level that could decide the next phase for the entire crypto space.
If this level fails, expect a chain reaction across risk assets — leverage, liquidity, and sentiment all roll over together.
It could be years before you see another uptrend. Note: This is not a short-term trade.
Stay sharp. The real test for crypto starts now.
Thank you ALL FOR getting me up to 5,000 followers!! ))
Click boost, follow, comment nicely for more authentic, no BS, raw analysis. Let's get to 6,000 followers. ))

Bitcoin: Liquidity CycleTypical liquidity cycle is 5-6 years long (65m). Buy bitcoin before an upswing (or end of QT) and sell when liquidity tightens. Macro is the best way to analyze markets?
Adjust your stakes based on position of the cycle.
Markets can have risk-on, risk-off episodes. Where Bitcoin is a risk-on asset.
Use 10Y-02Y for guidance.

Stop!Loss|Market View: SILVER🙌 Stop!Loss team welcomes you❗️
In this post, we're going to talk about the near-term outlook for SILVER ☝️
Potential trade setup:
🔔Entry level: 52.10719
💰TP: 48.72093
⛔️SL: 53.72120
"Market View" - a brief analysis of trading instruments, covering the most important aspects of the FOREX market.
👇 In the comments 👇 you can type the trading instrument you'd like to analyze, and we'll talk about it in our next posts.
💬 Description: The price is currently potentially forming a double-top reversal pattern. There's a large accumulation of buyers near 53-54, and if they manage to maintain the price at these levels, silver will rise toward 56. However, if the price reaches 52, we can expect a pullback to 48-49, from where, in the longer term, a decline to 40-42 is possible.
Thanks for your support 🚀
Profits for all ✅

BTC/USD: Testing Key Support (M/FVG) After Strong DowntrendKey Observations
Downtrend: The price has been moving lower, defined by the downward-sloping black trendline, indicating a period of bearish momentum.
Break of Structure (BOS): A "BOS" (Break of Structure) label is placed below a recent low, confirming the continuation of the bearish structure as the price moved lower.
Current Support Zone: The price is currently testing a significant support zone (the grey rectangular box) around the $96,000 - $98,500 area. This level appears to be a historical reaction zone.
Market Structure/Fair Value Gap (M/FVG): The support zone is also labeled as "M / FVG" (Likely Mitigation or Market Structure combined with a Fair Value Gap), suggesting this area holds significance for potential institutional/smart-money activity.
Future Scenarios (Projected Paths):
Scenario 1 (Black Arrow): The main projected path shows a potential bounce/reversal from the current support zone, aiming to push the price higher. This suggests a buy/long opportunity might be imminent if the support holds.
Scenario 2 (Curved Arrow): The alternative (and often less-likely, as it's secondary) projection suggests a continuation of the downtrend after a potential minor bounce or consolidation, indicating a break below the support zone and further declines.

BTC/USDT Trend Break Analysis & Target 101000This BTC/USDT 1-hour chart shows price moving within a downtrend, breaking below multiple trendlines. A key support zone around 97,800 is holding the price, while a resistance zone near 101,000 is highlighted as the next target. The chart also marks an FVG (Fair Value Gap) and two breakouts from the trendline. Current price action suggests a possible bullish move toward the 101,000 target zone if support continues to hold.

BTC temporary moving upHey guys,
I think btc will bounce from this support line that hasn't been tested yet.
Target 1: 107,400
Target 2: 110,700
Target 3: 116,300
Lets see where btc will be ending up at.

Strategy: Downward Pressure Intensifies Strategy has continued to develop downward pressure as anticipated since our last update, bringing it closer to the targeted low of the turquoise wave 2. Our alternative—and now grayed-out—Target Zone has been breached to the downside, allowing us to remove the alternative scenario of a premature breakout to the upside. Investors who speculated on this alternative and entered within the alternative Target Zone with a stop 1% below the lower edge have likely been stopped out by now. For now, we are still allowing some room for turquoise wave 2 to move lower; however, it should find its bottom above the support at $102.40 to set the stage for wave 3 to advance further above the resistance at $674.18.

BITCOIN – LEVELS TO WATCHTraders,
We dumped. Now we are in a controlled recovery. The question is not only “are we going up” but “where will the market make its real decision.” Right now the chart is giving us two very clean checkpoints.
1. What happened
We lost the weekly open and sold off.
Spot was selling too, so the dump was real.
After the low, spot started buying again and price reclaimed above the big wick. That looks like a failed attempt lower.
Markets left a really weak low behind at ~99k. I am convinced we will sweep this low somewhere in the coming weeks.
Funding is negative while price is moving up. Shorts are still in the market. This is how squeezes start.
2. First decision zone: 107.300 to 108.000
This area is important because several things come together.
107.300 is a weak high. It stopped at a clean level without strong rejection. That often means liquidity is still sitting above it.
The AVWAP anchored from 7 April is there. Price is below it for the first time since that move. When price comes back into an AVWAP from below the market often reacts because old buyers meet new sellers.
We also have an LVN just below. That tells us the market did not trade much there before. Price likes to test that kind of gap.
So 107k to 108k is our first place to watch the data. If spot keeps pushing and perps do not start selling we can break it. If CVD stalls there it can be a take profit zone.
3. Accumulation and Distribution
On both the 1 hour and 4 hour spot charts the Accumulation/Distribution line tells an important story.
Price made a clear new low after the dump.
The A/D line did not make a new low. It actually started to turn up.
That is what traders call a bullish divergence. Price is still falling but the money flow is already improving.
In simple words. While candles were going down someone was quietly buying.
That means the bounce we see now is not just short covering or a random spike. It was prepared by real spot demand.
Futures can show a similar thing but spot is the cleaner signal because it is not influenced by funding, leverage or hedges.
When real buyers step in while shorts are still in the market it often creates the right conditions for a squeeze.
4. OBV check
On the 4h OBV you can see it popping up from the base after the dump. OBV going up while price is moving up means volume is supporting the move. This agrees with the spot A/D story. It is better when price and OBV move together than when price moves alone.
5. Scenario 1
Price pushes into 107k to 108k.
That sweep takes the weak high and tags the AVWAP.
If at that point spot CVD slows down or perps start to sell we can reject.
A rejection there can send price back into the mid zone and even lower towards 101k to 102k and in extension back to the HTF LVN near 98k.
This is the simple “first resistance holds” idea.
6. Scenario 2
This is the one I am leaning toward.
Price breaks and holds above 108k.
Shorts do not get their reaction.
Spot keeps supporting and funding stays negative to flat.
Then the market has room to go for the next real liquidity pool which is 117k to 118k.
7. Why 117k to 118k matters
On the liquidity heatmap there is clear resting liquidity higher up. Price often travels to those areas because that is where orders are.
The golden pocket of the previous move sits in this same zone. Many traders watch this fib area so reactions there are common.
Several AVWAP bands from earlier dates are meeting around 117k to 118k. When AVWAPs from different anchors cluster together it creates a stronger level because different groups of traders all care about that price.
Between the current price and that zone there are imbalances and LVNs. That means the market moved quickly there before and did not build volume. These thin areas often get filled on the next push.
8. How to read it in real time
Above 108k and spot CVD still rising means squeeze is on.
Above 108k and funding still negative means shorts are paying to stay wrong.
Lose 108k again after a sweep and see CVD roll over means scenario 1 is playing.
Price can just dump down without getting more liquidity. But looking unlikely based on the data right now.
So if Bitcoin can break and hold above 108k there is not much in the way until 117k to 118k.
Final view
We dumped on real flow.
We are recovering with spot support.
We have a clear first test at 107k to 108k.
Break and hold and the magnet becomes 117k to 118k because of liquidity, golden pocket, AVWAP confluence and imbalance.
TLDR;
Bitcoin sold off hard, but the data says the low was bought. Spot A/D started rising while price was still making new lows, funding turned negative and price reclaimed above the wick, which tells us real buyers stepped in while shorts stayed in their positions. Now price is climbing back toward 107k to 108k where a weak high and the April AVWAP are waiting, so that is the first place the market can decide if this recovery is just a bounce or the start of a squeeze. If buyers keep showing up there and we push through, the path above is thin and the next real pocket of liquidity, AVWAP confluence, imbalance and even the golden pocket of the earlier move all sit together around 117k to 118k. That is why this recovery matters. It is not just candles going up. It is positioning, spot flow and liquidity all lining up.
If you enjoy this type of analysis or find it helpful, leave a like or drop a comment. I don’t ask for anything in return — I share this to help traders understand what’s really happening behind the charts. It also helps me see if people actually read and value these breakdowns, so if it helped you, let me know below.

If USDT.D Breaks 6.2%, Say Goodbye to AltsUSDT.D is now heading toward a key resistance zone. Until it reaches that level, altcoins could continue to face selling pressure.
If USDT.D breaks and holds above the marked zone, it could signal the start of a broader bearish phase for the market. However, historically, this level has acted as a strong rejection zone, so a pullback from around 6.2% could once again bring relief for altcoins.
Keep a close eye on how dominance reacts here, the next move could decide the short-term trend for the entire market.
DYOR, NFA

$BTC bounce. What is happening?On the Macro Side:
Metaplanet was on the verge of bankruptcy — their stock dropped from $1,900 to $415 in just five months.
Their average Bitcoin buy price sits around $104K, and they had to take on more loans to buy even more BTC, in an attempt to lift the price and save their position.
Michael Saylor and NASDAQ:MSTR are in a similar situation. MicroStrategy’s stock has fallen from $460 to $236, with an average Bitcoin purchase price around $66K.
This puts huge pressure on these institutional treasuries — they cannot afford a bear market.
They’re forced to keep buying Bitcoin to prevent a BTC dominance collapse ( CRYPTOCAP:BTC.D ) and hold market confidence.
In the last two days, altcoins ( CRYPTOCAP:OTHERS ) have been outperforming Bitcoin, signaling a possible rotation from BTC to alts.
That alone was enough for these mega whales to ignite a quick pump before the weekend, trapping retail traders and preventing massive ETF sell pressure from retail-driven redemptions.
On the Chart:
Bitcoin is oversold on both RSI and MACD across multiple timeframes.
This aligns perfectly with the whales’ attempts to spark a rebound — and may support a short-term bounce lasting 5–7 days.
However, don’t be fooled — this looks more like a desperate defense pump than a true trend reversal.
The weekly trend remains bearish until at least Q2 2026, and we’ll likely see more bounces and dips along the way.
A new all-time high seems unlikely in this macro environment, with a maximum target around 108K before another correction.
Stay cautious. Don’t FOMO into this move — it’s engineered to protect treasury positions, not to start a new bull run.
Things will truly turn bullish only when Powell is replaced, QE restarts, or a major macro catalyst (like a government resolution) happens.
DYOR. Stay smart. Don’t chase hype.
#Bitcoin #CryptoMarket #BTC #Altcoins #CryptoNews #CryptoAnalysis #Macro #Whales #MarketUpdate #BTCUSD #AltcoinSeason #Investing #Trading #CryptoTrends #MSTR #Metaplanet #CryptoCrash #CryptoStrategy #DYOR

"Truth or Dare?"The parameter known as "Total" (All total market cap), shows a clear signal right now.
Before explain the techniacl details, I'll explain why should this move work:
Fundemental Details:
- FED has cut the interest rates for second time this year and most likely do it again before the year ends in December which is the most bullish macro signal for crypto to rise.
- US and China are trying to getting alone but behind the scenes the deal about tarrfis has already made long ago. They're just acting like they actually can carry on their political therats to each other to gain more political power. Trump is doing whatever he has done before when he got the crown. When all the nonsense ends, there won't be any problem left to think about tarrifs.
- US also threathens Venesuale but I don't think that matter will last long. Nevertheless, the matter still casuing heat on globe and that causes uncertinty.
- BOJ is another matter to keep in mind at the moment. The reason is, they announced that Japan may need to raise their interest rates in the next meeting which would be devastating for both crypto and all the markets on the globe. Crypto on the other hand, is facing this effect way sooner even before it happens, even if it won't happens. As you can guess, crypto markets are fragile. Every little tension means crises. That's one of the major reasons why it's actually losing value since last month.
- Let's get back to FED. Yes, FED is cutting the rates for the second time and expected to cut again in December despite the words from Powell BUT, we already knew that. Right?
As I mention about it on top, Crypto is fragile, but also very fast. When other markets are proccesing the reasons and possible outcomes of the news, crypto usually has already given the results of the possible news. Even if it's fake, unknown or unworthy to care about.
Crypto is fast. That's why it already gave every opportuinty to invest and now, the investor are taking profit from the very bullish news you just read.
"Sell the news" effect is just faster in crypto. Therefore, crypto has already gained the value it needed to gain. When you read the news or anything about crypto, remember one thing: it's already in the price. Bearish, or bullish. Won't matter.
Now let's get back to the part you like:
Technical details:
There are two possible senarios:
I'm not going to draw all the calculations on the chart so you won't confuse.
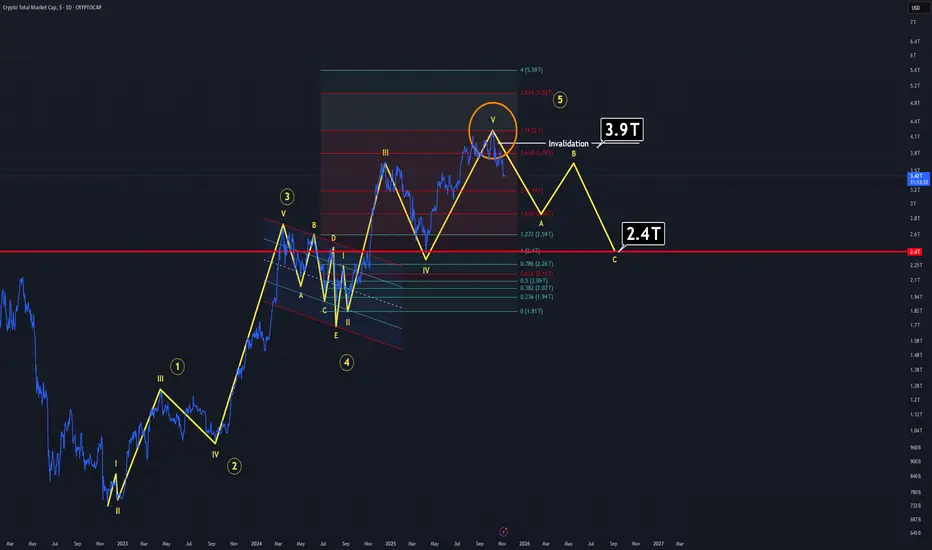
Senario one, The one you see in the main chart:
Total or Bitcoin, won't matter right now because they both going through same way.
At the moment, we might be witnessing an A-B-C corrective pattern on Total.
If you calculate enough, you'll reach the result that a perfect 5 waved uprising move has already happend and there is a possiblity that we might be in a corrective wave. Which, would result for TOTAL to drop at least 2.4 B levels. For Bitcoin, this level means it should drop down through around 80-85K.
Senario Two (Hopefully):
If the chart you see is a bear trap and the main bullish cycle is still on, it means we are at wave 4. Which means, Bitcoin still may dive under 100K but it won't last and we see even bigger all time highs in the coming month. Yes, in the coming month.
In order to this senario work, FED must give clear signals about rate cuts in December, resessiong must end immidiatly, US and China must behave well enough to lower tension around the globe.
If all the conditions met but price is still going side ways, it means get ready to see a "skyrocket candle".
Thanks for reading.
BTC is going up BTC has the potential to rise from this its curent price of 98292
to 116551 , A key suport level to watch is at 92278. BINANCE:BTCUSDT

$TAO Long 🟩 Entry Zone: 330$ - 320$
🎯 Targets:
1️⃣ 345$
2️⃣ 360$
3️⃣ 380$
4️⃣ 400$+
🔻 Stop-Loss: Below 305$

POL/USDT — Long Setup🟩 Entry Zone: 0.1653$ - 0.16400$
🎯 Targets:
1️⃣ 0.1710
2️⃣ 0.1810
3️⃣ 0.1900
4️⃣ 0.2100+
🔻 Stop-Loss: Below 0.150
