BTC/USD 1h chart review1️⃣ Uptrend broken
• The black upward trend line has been clearly broken down
• This is a change in the market structure (HH/HL → LH/LL)
• It's not just the wick - the candles have closed below
➡️ Short-term bias: bearish
⸻
2️⃣ Strong downward impulse
• One long falling candle + continuation
• No immediate rebound = weak demand
• This looks like a distribution + dump, not a correction
⸻
3️⃣ Key Levels (from your lines)
🔴 Resistances (now SELL / short area):
• 88,520 – 88,800
• 89,000 – 89,200
➡️ Until the price returns and stays above 89k, any upward movement is a pullback, not a trend.
🟢 Support:
• 87,650 (local – already tested)
• 87,400 – 87,200
• 86,750 (very important, lower support)
⸻
4️⃣ Stochastic RSI
• Came out of overbought
• Lines pointing strongly downwards
• There is no bullish divergence yet
➡️ Momentum is still down, no long signal visible
⸻
🧠 Scenarios (Highlights)
🟥 SCENARIO 1 – base (more likely)
Pullback → further decline
• The price returns to around 88,200 – 88,600
• Rejection (lack of volume, weak candles)
• Next move down:
• 🎯 87,200
• 🎯 86,750
➡️ This is a classic break & retest
⸻
🟨 SCENARIO 2 – consolidation
• Price holds 87,400 – 88,200
• Lack of volume
• “Grinding” before the next move
1hrchart

BTC/USDT 1H Chart Review📌 MARKET CONTEXT
Higher timeframe trend (H4/D1): correction in an uptrend
Current (1H): consolidation below resistance after a strong rebound
Price is squeezed between:
descending trendline (blue)
local support ~87.5–88k
This is a classic decision zone.
🟦 PRICE STRUCTURE
What we see:
Strong rebound from ~85.4k
Higher lows (orange line) → local uptrend
Price fails to break:
~88.7–89.0k (green zone)
➡️ Rising low + ceiling = triangle / compression
🟥 KEY LEVELS
🔴 Support:
88,130 – local micro-support (now being tested)
87,477 – very important (H1 structure)
86,880 – critical (loss = bias change)
85,447 – impulse low (bulls' last line of defense)
🟢 Resistance:
88,770 – first hard resistance
89,934 – key (range high)
90 770 – only after the structure is broken
📉 TRENDLINES
Blue (downtrend): still respected ❗
Orange (uptrend): acts as dynamic support
➡️ Breaking these two lines = strong move (up or down)
📊 STOCH RSI
Was overbought
Now reversing down
No bullish divergence
➡️ Short-term: cooling / possible pullback
🧠 SCENARIOS (specific)
🟢 SCENARIO 1 – BULLISH (less likely, but strong)
Conditions:
H1 candle close above 88,800
Breakout and hold above the blue trendline
Targets:
89,900
90,770
Retest 88.7k = perfect long
🔴 SCENARIO 2 – BEARISHES (more likely now)
Conditions:
Rejection of 88.7k
H1 close below 87,470
Targets:
86,880
85,450
This would be a healthy pullback to the structure, not the end of the bull market.

ATOM/USDT short-term🔍 Market Structure
Clear downtrend – price is moving within a descending channel (lower highs and lows).
Each bounce is sold at the upper band of the channel.
No signal of a change in structure yet (no HH + HL).
📉 Current Price Status
Price is at the lower end of the channel.
Consolidation after a downward impulse → typical bearish continuation or short technical rebound.
Current Zone:
~2.02–2.05 USDT – local support + demand reactions.
🟢 Key Levels
Support
2.049 – local support (current reaction)
1.999 – strong psychological support
1.951
1.878 – lower demand zone (important!)
Resistance
2.099
2.125
2.201 – key resistance / S→R flip.
Upper channel line (~2.20–2.23)
📊 Stochastic RSI
Oscillator often in oversold territory.
Currently recovering from the low → possible short rebound.
BUT: in a downtrend. The Stoch RSI is not a long-term signal.
➡️ More likely a pullback, not a trend change.
🧠 Scenarios
🔴 Baseline scenario (most likely)
Bounce to:
2.09 → 2.12
Rejection + further decline:
1.99
then 1.95 / 1.88
➡️ Short at resistance levels in line with the trend.
🟢 Alternative scenario (less likely)
Breakout of 2.20 + close of the 1H candle above the channel
Retest from above
Then targets:
2.28
2.35–2.40
➡️ Only then can we talk about a change in structure.

ETH ANALYSIS – 1h📊 ETH ANALYSIS – 1h
🔥 1. Key Fact on the Chart
We have a very strong upward impulse that:
Breaked the upper band of the descending channel (blue)
Touched the upper line of the ascending channel (orange)
Was immediately rejected (long wick)
The MACD shows extreme overbought + potential divergence in the making
Such a move usually indicates a short squeeze + profit-taking → i.e., a temporary weakening and a retest of the breakout.
🎯 2. Price areas I see on your chart
Green (resistance/TP for longs):
3479–3490 – structural highs, strong resistance
3420 – local resistance
3375 – first real resistance after the breakout
Red (support/defense levels of the structure):
3338–3348 – first test zone after the breakout
3293 – key level — sustain = trend continuation
3180–3200 – consolidation zone broken (likely retest)
📉 3. What does the current wick mean?
This giant wick signals:
short liquidations
lack of demand for a continuation after the first resistance breakout
high probability of a return to the range
possibility of a retest of the breakout (around 3185–3210)
This doesn't look like a classic breakout with a continuation, but rather a fakeout and the need for a correction.
📈 4. Scenarios
➡️ Bullish (more likely if 3293 holds)
Price falls to the 3338–3293 zone
Builds a local HH/HL
Starts a move to 3375, then 3420
If 3420 breaks → target 3480–3500
➡️ Bearish (if price loses 3293)
Retest from the bottom of 3293
Return to the blue channel
Target: 3185–3200
If this level breaks → 3050–3080 (lower band of the channel)
📟 5. MACD
MACD is:
extremely stretched
signal line begins to collapse
histogram decreases after Explosion
→ This almost always means a local intraday high + a drop to support.

QUICK ANALYSIS (1H) — BTC BOUNCED FROM RESISTANCE✅ 1. Breakout from the downward trendline
On the chart, I see:
a yellow downward trendline—it has been broken,
the candlestick dynamically breaks through it and closes above it.
➡️ This is the first signal of a shift in momentum to upward.
✅ 2. Price is testing the 200 SMA (blue)
BTC is currently:
touching the 200 SMA,
bounces slightly downward—a classic reaction to strong resistance.
➡️ Until we break through the 200 SMA, the market remains in a downtrend.
🟩 3. Nearest resistance levels (green levels on your chart):
90,400 USDT – current resistance (reaction already visible)
92,500 USDT – next important level
93,200–94,000 USDT – strong supply zone
94,900 USDT – strong level from previous bounces
➡️ The closer the price gets to 94–95k, the greater the chance of a downward rebound.
🟥 4. Nearest support levels
From your red levels:
88,700 USDT – first level of defense
87,500 USDT – key support
85,500 USDT – major local bottom
84,150 USDT – extreme support
➡️ If BTC returns below 87.5k, the correction will deepen.
📊 5. RSI — Neutral-Bullet
RSI ~ 55,
Not yet overbought,
RSI trend is increasing.
➡️ There is room for further upward movement.
📉 6. MACD — Bullish Signal
MACD has crossed the signal line upward,
the histogram is rising.
➡️ Upward momentum, shorting here is risky.

Choppy market, but still present opportunities…Hello traders!
Weekly outlooks will most likely be published over the weekend while the market is closed. This gives us the opportunity to analyze the market while it is dormant to eliminate the noise. We will begin the AUDCAD.
Short-term technicals are suggesting a slightly bullish market. Within the next month, we could see a choppy market where price range between 0.90500 and 0.91500. This could be likely since there are no major central bank surprises expected in the next 2–4 weeks and the commodities such as oil for Canada and iron for Australia are currently stable and RBA & BoC holding rates steady as we head into December, hopefully no surprises from China.
Looking at the chart provided, we had a weekly low around 0.90671 on Tuesday right before midnight and the market rallied quickly 0.91320. This low that was created act as a strong support this week and the market attempted to break below this support and failed as buyers took advantage of a premium price near 0.90500. We end the trading week closing above 0.91000 which may indicate bullish intentions, at least for now. If price remains above 0.90500, we could see this pair trading around 0.91500 before the end of the quarter.
This is an idea, not a signal…. and we should continue looking for confirmations. Remember, we can always try to predict the market, but it’s best to know when to react.

BTC/USDT 1H Short-Term (maintaining support)📉 MARKET STRUCTURE
1. Trend
The chart shows a clear falling wedge, which statistically is a pro-growth pattern—breakouts most often occur upwards.
Upper wedge line: ~96,400 USDT
Lower wedge line: ~93,750 USDT
The price has just rebounded from the lower edge—this is a key demand level.
📊 SUPPORT AND RESISTANCE LEVELS
Support (demand):
93,750 – lower wedge line
93,300 – strong chart level
92,650 – lower support, strong volume reaction
Resistance (supply):
95,000 – 95,450 – local resistance (supply often returns here)
96,400 – resistance key + upper wedge line
📈 INDICATORS
Stoch RSI (1h)
We have rebounded from the oversold level.
The %K line is breaking the %D line upwards → a signal of a potential short-term rebound.
MACD
The histogram is decreasing, but the first signs of flattening are visible.
The MACD line is still below the signal line, but is approaching → momentum for a reversal is beginning.
Volume
Volume increased on bearish candles, but near the bottom, two demand candles with increased volume appeared → buyers reacted at support.
📌 CONCLUSIONS
✔️ Bullish short-term scenario (more likely at this point):
Bounce from 93,750 + rising indicators = local upward correction.
Targets:
94,800 – 95,000
95,450
96,400 (upper band of the wedge — an important decision point)
❌ Bearish scenario (if support breaks):
A drop below 93,750 on strong volume opens the door to:
93,300
92,650 (a large defensive level — aggressive demand could enter here)

BTC/USDT 1H Chart Short-Term📉 Descending Channel (black lines)
The price previously moved within a clear descending channel, which was broken upward.
A breakout from the channel signals a change in the short-term trend – from supply pressure to an attempted rebound.
From a technical perspective, a breakout from a descending channel often leads to an upward correction, the extent of which is at least the midpoint of the previous downward impulse.
🔷 Triangle Formation (blue lines)
After breaking out of the channel, the price formed a symmetrical triangle (consolidation) – a sign of market indecision.
Triangles of this type are often trend continuation patterns, but in this context – after a breakout from a descending channel – an upward breakout (i.e., a further upward rebound) is more likely.
The key resistance level to watch is $111,145 – a breakout with volume confirmation would open the way to $112,320 and then $113,921.
🧭 Key Technical Levels
Resistance:
$111,145 – local resistance (upper boundary of the consolidation/triangle).
$112,320 – another strong resistance level from the previous local high.
$113,921 – major medium-term resistance.
Support:
$110,442 – lower boundary of the triangle (short-term support).
$108,793 – support after the recent bounce.
$107,285 – next demand level.
$104,969 – bulls' defensive boundary in the broader context.
📊 Stoch RSI (bottom of the chart)
The Stoch RSI oscillator is currently in a rebound phase from the neutral level (~40–60).
If the lines (blue and orange) cross upwards and enter the zone above 80, this could confirm bullish momentum and a breakout from the triangle to the upside.
However, a rejection from 60 and a further drop below 20 would signal a false breakout and a possible retest of USD 108,800.
🔎 Scenario Summary
➡️ Upside Scenario (more likely):
Breakout from the triangle to the upside (confirmed by a 1-hour candle above USD 111,150).
Potential move to USD 112,300 → USD 113,900.
Momentum indicators support a rebound if the Stoch RSI maintains its upward trend.
⬇️ Downside scenario (alternative):
Unsuccessful breakout and return below $110,400.
A correction to $108,800 can then be expected, and if this level is broken, a further decline to $107,300.

BTC/USD 1h short-term🧭 General context
• Bitcoin price is ~$114,470.
• The short-term trend remains upwards, which is confirmed by the black trendline.
• The last upward impulse brought the price from ~ USD 111,000 to ~ USD 117,000.
• Currently, the price is testing the support zone after a short correction.
⸻
📊 Key technical levels
• Resistances (green):
• USD 117,815 – local peak, strong resistance (potential TP for longs).
• USD 116,545 – medium resistance, possible retest in the short term.
• $115,518 – lower resistance, bulls decision point.
• Support (red):
• USD 114,667 – currently tested level (important intraday support).
• USD 113,545 – another strong support (close to trendline).
• USD 111,915 – the limit after which the upward trend may reverse.
⸻
⚙️ Trendline
• The trend line runs from approximately USD 110,000 and connects subsequent lows.
• The price is currently close to the trendline, so:
• Rebound → continuation of the upward trend,
• Breakout → possible decline to 113,500 or lower (up to USD 111,900).
⸻
📈 Oscillator (Stochastic RSI)
• It is located close to the oversold zone (approx. 8 p.m.).
• This means that the market is close to a potential rebound - a bullish signal (if the %K and %D lines cross upwards).

BTC/USD 1H chart short-term📊 Market structure:
• Current price: ~$113,300
• Trend: A short-term uptrend - evidenced by rising lows and rising highs, as well as price remaining above the black trendline.
• The chart shows Bitcoin testing resistance at $114,089, following a strong breakout earlier.
⸻
🧭 Key Levels:
Resistances (green lines):
1. USD 114,089 – the closest resistance that the price is currently testing.
2. USD 116,057 – another strong resistance, potential target after breakout.
3. USD 118,681 – main resistance level from the higher time frame (H4/D1).
Support (red lines):
1. USD 112,156 – first local support (close to the trend line).
2. USD 109,567 – medium-term support, key to maintaining the growth structure.
3. $107,702 – Strong support where institutional buy orders are likely.
⸻
📈 Trendline:
The black upward trendline leads through the recent local lows.
➡️ As long as the price stays above it, the trend remains bullish.
➡️ Breaking this line down would be the first signal of a weakening trend and a correction towards USD 112,150-111,000.
⸻
⚙️ Stochastic RSI (bottom indicator):
• Currently starting to move down from overbought levels (above 80).
• This indicates a possible short-term downward correction or consolidation.
• If the indicator drops below 40 while keeping the price above the trendline, it may be a good opportunity to go long again.

LTC/USDT 1h short term 1. The inheritance channel (orange lines) - the course was in the downward trend, but just struck the mountain from the channel. This is a signal of short -term shift Momentum to upward.
2. Horizers of support/resistance (red and green lines):
• Support: 104.64, 103.15, 101.77 - you can see that the course reflected several times from these levels.
• Resistance: 106.05, 107.85, 109.32 - these levels are now key goals with further increases.
3. STOCHASTIC RSI (bottom of the chart) - is in the purchase zone (above 80). This suggests the possibility of short -term correction, but after struggling from the channel, the momentum can still pull the price higher before the stronger pullback occurs.
⸻
Scenarios:
✅ Taurus (continuation of stroke):
• If the price lasts above 106 USDT, subsequent goals are 107.85 and 109.32.
• Closing a few candles above 106.05 will confirm the burst and gives space for growth.
⚠️ Bear (false breakup):
• If the price does not last above 106 and returns to 104.64, the market may fall again to 103.15 and even 101.77.
⸻
Summary:
• The trend has changed to a short -term upward after having broken out of the downward channel.
• Keeping the level of 106 USDT is key - if it succeeds, there is a chance for an attack 107.85 → 109.32.
• RSI is high, so in a short time it is possible to lightly withdraw before we go higher.

BNB/USDT Short-Term🔎 Current situation:
• Price: ~ 896.9 USDT.
• Trend: You can see an upward trend short -term, but now the price consolidates just below the resistance.
• Support:
• 892.8 (SMA - short -term).
• 885.5 (key horizontal support).
• resistance:
• 899.5 (local resistance, SMA #1).
• 907.9 (strong resistance - previous peak).
⸻
📊 Indicators:
• SMA: The price balances between the short (892.8) and the long average (green ~ 896). This gives a picture of the "balance point".
• MacD: The lines are close to each other, the histogram decreases → neutral signal, possible transition towards sales, if the signal line goes up above MacD.
• RSI: ~ 50–55 → neutral zone, nor purchase nor sales.
⸻
📈 short -term scenarios (1-6h):
1. Bull (more likely if it stays above 892.8):
• Breaking 899.5 → Attack on 907.9.
• If the volume increases, up to 912+ may occur.
2. Bear (if it goes below 892.8):
• decrease towards 885.5 (key level of support).
• Punction 885.5 → Movement down to 878–880.

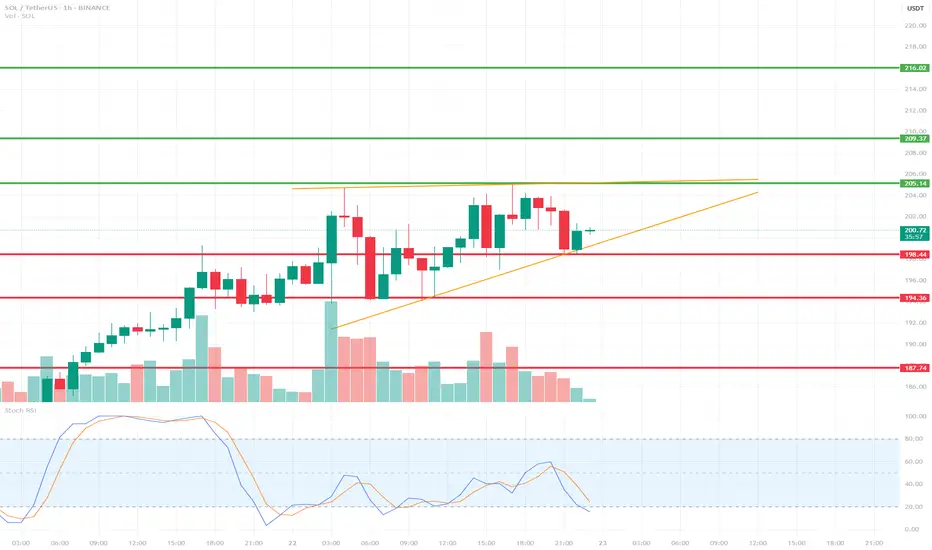
SOLUSDT 1H Short-Term🔍 Technical Structure:
Short-Term Trend:
SOL is currently in an uptrend, with local higher lows. This is evident from the orange uptrend line, which has been tested multiple times.
Local Resistance:
205.14 USDT – yellow line – a resistance level that the price has touched several times but failed to break (this could be a double-top formation).
Local Support:
198.48 USDT – the price is currently testing this level as support.
194.36 USDT – lower, more crucial support (stronger upon a trend breakout).
187.74 USDT – important support that would be tested in the event of a larger breakout.
📉 Oscillator – Stoch RSI:
The Stoch RSI is currently in oversold territory (below 20), suggesting the possibility of a local rebound.
However, there has been no upward crossover yet, so there is no strong buy signal.
🔊 Volume:
We are observing a decrease in volume during the current correction, suggesting that the declines are relatively weak – there is no strong supply impulse.
🧠 Short-term scenarios:
✅ Bullish scenario:
Price is rebounding from the trend line (orange) and the 198.48 USDT level.
A break of the 205.14 USDT resistance could open the way to:
209.37 USDT
216.02 USDT (next target)
❌ Bearish scenario:
A break of the trend line and the 198.48 USDT level with the 1-hour candle closing below.
Possible decline to:
194.36 USDT (first support)
and further to 187.74 USDT if selling pressure increases.
DOGE/USD 1H Short-term1. General situation on the chart
Trend: The last few dozen candles show a sideways movement with a stronger upward impulse, which was quickly corrected. We are currently seeing declines after the previous upward wave.
Current price: Approx. 0.1847 USDT.
Last structure: After the upward movement (peak around 0.205), the price dropped quite a bit, now consolidating below 0.19.
2. Formations and structures
Formation:
No clear classic formation (e.g. head-and-shoulders, triangle, flags) on the last candles.
However, something like a local peak ("double top") is visible around 0.203–0.205 — the price touched these areas twice and fell off, which suggests that this is a strong resistance.
Support and resistance:
Support: 0.1800–0.1820 — here is the last local low and the area where the price stopped before the previous upward movement.
Next support: 0.1740–0.1750 — the next low from the previous movements.
Resistance: 0.1900–0.1910 — here was the last consolidation, and then a sharp decline.
Strong resistance: 0.2030–0.2050 (recent highs).
3. Indicators
RSI:
RSI value close to 40 and is heading slightly down, but it is not oversold yet. This may suggest that there is potentially room for further decline.
MACD:
Histogram below the 0 line, MACD line below the signal, the bearish signal is still maintained.
4. Signals and potential scenarios
Base scenario (downside):
If the price breaks below 0.1820, the next target is around 0.1750.
Stop loss in this scenario: above the last resistance, e.g. 0.1910.
Alternative scenario (rebound):
If the price does not break 0.1820, and a demand reaction occurs - we may see an attempt to return to 0.1900, or even to the peaks in the area of 0.2000–0.2050.
Stop loss below 0.1800 (in the case of a long play).
5. Potential targets (by price action):
Short:
TP1: 0.1820 (nearest support, you can take some profit)
TP2: 0.1750 (next low, main target)
Long:
TP1: 0.1900 (nearest resistance)
TP2: 0.2000–0.2050 (highs, if the movement is strong)
Summary
Currently, the chart suggests a bearish scenario.
This is confirmed by the candlestick pattern, negative dynamics and indicators (RSI, MACD).
Key level to watch: 0.1820 – if it falls, we will probably go down to 0.1750.
If there is strong demand for 0.1820, a rebound to 0.19+ is possible.

BTC/USD 1H chartHello everyone, let's look at the 1H BTC chart for USD, in this situation we can see how the price moves over a strong growth trend line. However, let's start by defining goals for the near future the price must face:
T1 = 109164 $
T2 = 110207 $
Т3 = 111463 $.
Let's go to Stop-Loss now in case of further declines on the market:
SL1 = 107264 $
SL2 = 106314 $
SL3 = 105578 $
SL4 = 104781 $
Looking at the RSI indicator, we see
Return above the upper limit, which can cause an attempt to relax at the coming hours.

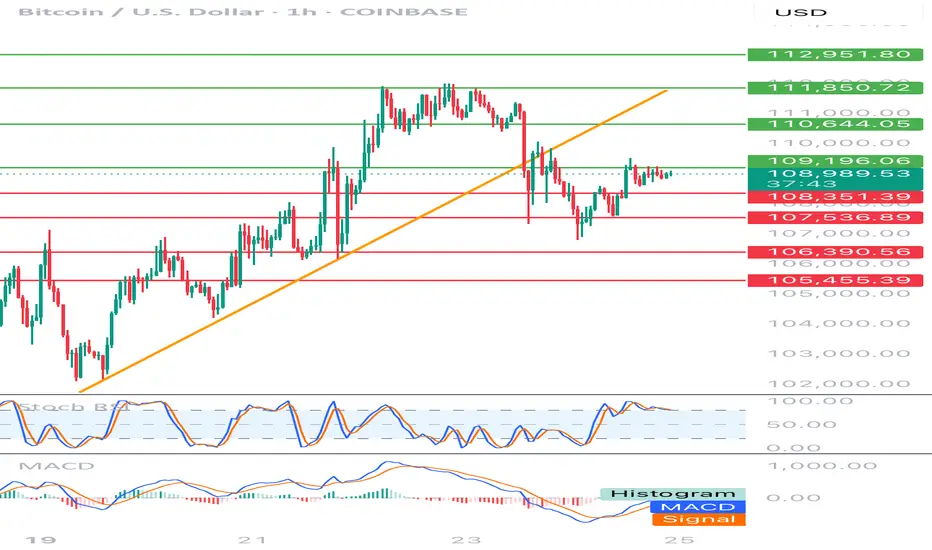
BTC-USD 1h chart targets and stoplossHello everyone, let's look at the 1H BTC chart to USD, in this situation we can see how the price dropped below the local upward trend line. Going further, let's check the places of potential target for the price:
T1 = 109196 $
T2 = 110644 $
Т3 = 111850 $ t4 = 112951 $
Let's go to Stop-Loss now in case of further declines on the market:
SL1 = 108351 $
SL2 = 107537 $
SL3 = 106390 $
SL4 = 105455 $
Looking at the RSI indicator, we see staying over the upper limit, which can give price drops, while the MacD indicator lasts at the bottom of the range and is close to returning to the upward trend.
Equity Research Report – TVS Motor Company Ltd.📌 Timeframes Analyzed: 15-Minute and 1-Hour
📅 Date: May 5, 2025
📍 CMP: ₹2,774.40
📈 Setup: Bullish breakout from falling channel with EMA crossover
🔹 Technical Highlights
Pattern: Descending channel breakout (1H)
Moving Averages: Price is trading above the 20-EMA and 50-EMA with bullish crossover
Volume: Breakout confirmed by increasing volume
RSI (Momentum): RSI is trending up above 50 with positive divergence
🟢 Trade Plan – Intraday to Short-Term Swing
✅ Buy Levels (Confirmation Entry)
Buy Above: ₹2,780 (breakout confirmation level)
🎯 Targets
Timeframe Target 1 Target 2 Target 3
15-min ₹2,810 ₹2,835 ₹2,860
1-hour ₹2,850 ₹2,880 ₹2,920
🔻 Stop Loss
Intraday SL: ₹2,745 (below channel support and 50-EMA)
Swing SL: ₹2,720

ETC/USDT 1H Chart ReviewHi everyone, let's look at the 1h ETC to USDT chart, in this situation we can see how the price has fallen below the uptrend line, and what's more we can see the first attempt to return above the trend line, however we can see the place that rejected the price.
Let's start by defining the targets for the near future that the price has to face:
T1 = 20.79 USD
T2 = 21.09 USD
Т3 = 21.60 USD
Т4 = 21.95 USD
Now let's move on to the stop-loss in case the market continues to fall:
SL1 = 20.19 USD
SL2 = 19.73 USD
SL3 = 19.26 USD
SL4 = 18.90 USD
On the Stoch RSI indicator we can see how the energy is decreasing and staying in the lower part of the range, keeping the price from a bigger drop for now.

XRP 1 HR POSSIBLE SCENARIOS 🚨 XRP 1-Hour Analysis 🚨
Here’s what we’re watching:
📈 Upside Targets:
• TP1:2.190
• TP2: 2.235
📉 Downside Targets:
• TP1: 2.08
• TP2: 2.04
So we have to watch out for level. If XRP stays below 2.12 - 2.14 then you can target downside targets and if above then you can target above levels mentioned as TP(take profit)
Keep an eye on key levels and trade smart! 💹

BITCOIN 1 HR POSSIBLE SCENARIOS 🚨 BITCOIN 1-Hour Analysis 🚨
Here’s what we’re watching:
📈 Upside Targets:
• TP1:94650
• TP2: 95150
📉 Downside Targets:
• TP1: 93380
• TP2: 92400
So we have to watch out for $93900- $9400 level. If BTC stays below then you can target downside targets and if above then you can target above levels mentioned as TP(take profit)
Keep an eye on key levels and trade smart! 💹
What’s your take? Drop a comment below and share this with your trading crew! 🚀

ETHEREUM 1 HR ANALYSIS 🚨 ETHEREUM 1-Hour Analysis 🚨
Here’s what we’re watching:
📈 Upside Targets:
• TP1:3400
• TP2: 3450
📉 Downside Targets:
• TP1: 3300
• TP2: 3266
So we have to watch out for $3370- $3350 level. If ETH stays below then you can target downside targets and if above then you can target above levels mentioned as TP(take profit)
Keep an eye on key levels and trade smart! 💹
What’s your take? Drop a comment below and share this with your trading crew! 🚀

DOT/USDT 1H chart Hello everyone, let's look at the 1H DOT to USDT chart, in this situation we can see how the price is moving in a sideways trend channel, creating lower and lower highs.
Let's start by setting goals for the near future, which include:
T1 - $10.83
T2 - $11.35
T3 - $12.19
AND
T4 - $13.52
Now let's move on to the stop-loss in case the market continues to decline:
SL1 = $10.48
SL2 = $10
SL3 = $9.53 AND
SL4 = $8.8

XAUUSD 1 HR STRUCTURE CHANGEXAU/USD on the 1-hour chart has shifted its structure back into the established range, signaling a period of consolidation. With the Non-Farm Payroll (NFP) release on the horizon, there is a high probability of a liquidity hunt around the 2655 level. Traders should exercise caution and wait for clear confirmations before entering positions, as volatility is likely to spike during the NFP event. This could present opportunities for sharp moves, but patience and a well-defined strategy will be key to navigating these conditions effectively.
