#1INCHUSDT — Accumulation or the Beginning of a Breakdown?#1INCH
The price is moving within an ascending channel on the 1-hour timeframe and is adhering to it well. It is poised to break out strongly and retest the channel.
We have a downtrend line on the RSI indicator that is about to break and retest, which supports the upward move.
There is a key support zone in green at 0.1770, representing a strong support point.
We have a trend of consolidation above the 100-period moving average.
Entry price: 0.1909
First target: 0.1954
Second target: 0.2010
Third target: 0.2080
Don't forget a simple money management rule:
Place your stop-loss order below the green support zone.
Once you reach the first target, save some money and then change your stop-loss order to an entry order.
For any questions, please leave a comment.
Thank you.
1inchusdc

1INCH/USDT — Accumulation or the Beginning of a Breakdown?The price of 1INCH is currently trading within a major historical support zone between 0.175 – 0.155 USDT, a level that has repeatedly acted as a key turning point since mid-2024.
Recently, the market revisited this critical zone under strong selling pressure but showed a sharp liquidity wick down to 0.1036 USDT, followed by an immediate recovery — a classic signal of liquidity absorption or a potential accumulation event by larger players.
In other words, this zone represents the final line of defense for buyers — holding above it could trigger a major rebound, while a confirmed breakdown below may lead to deeper capitulation.
---
Structure and Pattern Overview
Overall trend: still bearish, forming a sequence of lower highs and lower lows.
Yellow zone (0.175 – 0.155): a strong demand area that has acted as a reliable support multiple times.
Long wick to 0.1036: a sign of extreme liquidation followed by potential smart money accumulation.
Potential formation: if the price holds this zone and forms a higher low, a double bottom pattern could emerge — a classic early reversal signal.
---
Bullish Scenario
If 1INCH holds above 0.175 – 0.155 and forms a strong bullish 3D candle with rising volume, a potential reversal could begin.
Main confirmation: 3D candle close above 0.19 USDT.
Bullish targets:
0.2346 → first resistance to reclaim.
0.2730 → breakout confirmation level.
0.3515 → primary swing target if structure shifts bullish.
Narrative: this area could serve as a major accumulation base before the next markup phase, signaling that institutional buyers are quietly positioning before a broader trend reversal.
---
Bearish Scenario
If 1INCH closes below 0.155 USDT with strong momentum, the support zone will fail, and sellers will regain full control.
First downside target: 0.1036 (previous wick low).
Below 0.1036: the next psychological area lies around 0.09 – 0.08 USDT.
Narrative: a breakdown here would indicate full bearish dominance and could trigger a capitulation phase before any potential recovery.
---
Market Psychology
The 0.175 – 0.155 USDT zone represents a psychological battleground between fear and opportunity.
Retail traders who panic-sold below 0.16 may have provided the liquidity needed for smart money to accumulate positions.
If volume confirms steady buying interest within this area, we could soon witness the beginning of the next bullish markup phase for 1INCH.
---
Conclusion
1INCH is now standing at one of its most critical levels of 2025.
This is more than just a technical support — it’s the decisive zone for the medium-term trend.
Holding above 0.155 = possible start of a major reversal.
Breaking below 0.155 = potential continuation to 0.1036 or lower.
From this point, the market will decide whether 1INCH enters a strong accumulation phase or dives into its final capitulation stage.
---
#1INCH #CryptoAnalysis #1INCHUSDT #CryptoTrading #AltcoinWatch #ReversalZone #SupportZone #BearishVsBullish #PriceAction #MarketStructure #SwingTrade #LiquiditySweep

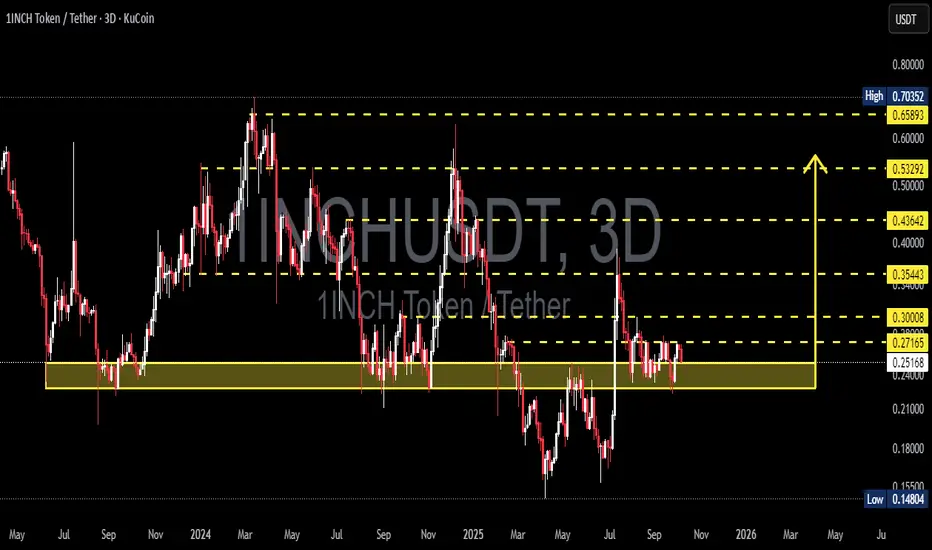
1INCH/USDT (3D) — at Demand Zone: Accumulation or Breakdown?Analysis:
The 3-day chart shows 1INCH consolidating tightly within the 0.23–0.25 demand zone, an area that has acted as a critical base since mid-2024.
Every touch of this zone has triggered a strong bullish reaction, proving it’s a key defense area for buyers. However, repeated retests also weaken its strength — making this retest a make-or-break moment for the mid-term trend.
Price is currently moving sideways with declining volatility, suggesting the market is in a final consolidation phase before a major directional move.
This zone will decide whether we see a strong reversal rally or a structural breakdown into new lows.
---
Key Technical Structure
Demand Zone (Major Support): 0.23 – 0.25
Nearest Resistance: 0.27 – 0.30
Higher Resistances: 0.354 → 0.436 → 0.533 → 0.659
Major Support Below: 0.148
---
Price Structure & Pattern
1INCH has been forming a broad horizontal range with multiple retests at 0.23–0.25, signaling potential base accumulation.
However, the macro structure still shows a series of lower highs, keeping the overall trend bearish-to-neutral until a confirmed breakout occurs.
Long downside wicks around 0.23 indicate liquidity sweeps — a common sign of institutional accumulation before a major move.
---
Bullish Scenario
Confirmation:
A strong 3D candle close above 0.30 — confirming breakout from the range.
Implication:
Marks the end of accumulation and the beginning of a potential mid-term reversal structure.
Upside Targets:
TP1 → 0.354 (mid-range top)
TP2 → 0.436 (major supply)
TP3 → 0.533 (trend reversal confirmation)
TP4 → 0.659–0.703 (extended target)
Entry Strategy:
Conservative: wait for a 3D close above 0.30 and enter on retest.
Aggressive: enter near 0.23–0.25 upon bullish rejection, with a tight stop below 0.23.
Stop Loss: below 0.23 (breakdown invalidates setup).
---
Bearish Scenario
Confirmation:
A 3D close below 0.23 confirms structural breakdown from the base range.
Implication:
Signals a shift from accumulation to redistribution, resuming the broader downtrend.
Downside Targets:
0.20 → 0.18 (intermediate)
0.15 (major psychological and technical support)
Strategy:
Look for bearish rejection around 0.27–0.30 for short setups, or enter breakdown continuation trades below 0.23 with confirmation.
---
Conclusion
The 0.23–0.25 zone stands as the final equilibrium point between buyers and sellers — the golden demand zone that will dictate 1INCH’s next major trend.
A confirmed breakout above 0.30 could trigger a strong reversal toward 0.53–0.70, while a breakdown below 0.23 opens the door for a drop toward 0.15.
The market is silent — and this calmness often precedes a massive move.
---
#1INCH #CryptoAnalysis #TechnicalAnalysis #Altcoin #Breakout #PriceAction #CryptoTrading #SwingTrade #SupportResistance #MarketStructure #ReversalZone #CryptoMarket #ChartAnalysis
1INCH/USDT — Critical Accumulation Zone?🔎 Overview
Currently, 1INCH/USDT is trading around $0.2449, sitting right above the key demand zone at $0.21–$0.25 (yellow box). This level has repeatedly acted as a major support, preventing further downside.
On the 3D timeframe, price action shows extended corrective structure after a strong downtrend. This zone is now a make-or-break area: will it turn into an accumulation base for a new bullish cycle, or become a distribution zone before further decline?
---
📌 Market Structure & Price Action
Mid-term trend: still forming lower highs → bias remains neutral-to-bearish until reversal signs appear.
Yellow zone ($0.21–$0.25): major demand zone, repeatedly tested with strong rebounds.
Deep wick spikes → liquidity grabs / stop-hunts before price recovery.
Currently consolidating sideways above demand → market waiting for the next decisive move.
---
🟢 Bullish Scenario
For bullish confirmation, price needs:
1. Hold above $0.21–$0.25 zone.
2. Break & close 3D above $0.30 → early reversal confirmation.
3. Establish higher highs & higher lows → sign of trend shift.
📈 Upside targets:
R1: $0.300
R2: $0.354
R3: $0.436
R4: $0.532
R5: $0.659 – $0.703
With strong momentum, the $0.65–$0.70 zone could act as a mid-term price magnet.
---
🔴 Bearish Scenario
For bearish continuation, price needs:
1. 3D close below $0.21 with volume.
2. Failed retest (previous support flips into resistance).
📉 Downside targets:
S1: $0.190
S2: $0.165
S3: $0.148 (major low on chart)
Breaking below $0.148 would heavily weaken long-term structure for buyers.
---
🎯 Trading Approach & Risk Management
Swing setup: Long from $0.22–$0.24 with stop below $0.195 → target $0.30+.
Breakout setup: Wait for 3D close > $0.305, enter on retest → target $0.354+.
Short setup: Only valid if 3D close < $0.205 with failed retest → targets $0.165–$0.148.
⚠️ Risk note: Keep per-trade risk under 1–3% of capital. Always use stop losses.
---
📊 Key Levels
Main demand/support: $0.21–$0.25
Major resistances: $0.30 → $0.35 → $0.43 → $0.53 → $0.65–0.70
Critical low: $0.148
---
✨ Conclusion
1INCH/USDT is at a decisive crossroads.
Holding the $0.21–$0.25 zone could trigger a bounce toward $0.30 and potentially higher. However, a confirmed breakdown below $0.21 exposes the market to deeper correction toward $0.19–$0.148.
Traders should carefully watch the 3D candle close and volume confirmation before committing to directional trades.
---
#1INCH #1INCHUSDT #CryptoAnalysis #Altcoin #TechnicalAnalysis #CryptoTrading #PriceAction #SwingTrading #BreakoutSetup

1INCHUSDT 2D Analysis 1INCH ~ 2D Analysis
#1INCH Buy on retest of this support block with short term target of at least 15%+ from here.

#1INCH/USDT Ready to go higher#1INCH
The price is moving in a descending channel on the 1-hour frame and sticking to it well
We have a bounce from the lower limit of the descending channel, this support is at 0.3950
We have a downtrend on the RSI indicator that is about to be broken, which supports the rise
We have a trend to stabilize above the moving average 100
Entry price 0.5000
First target 0.5586
Second target 0.6014
Third target 0.6555

#1INCHUSDT lONG#1INCH
The price has been moving in a downward channel since July 2023
This descending channel was broken upward
It is expected that the price will continue to rise
Current price 0.4593
The first target is 0.4968
The second target is 0.6020
The third goal is 0.7256

1INCH LONGOne of our favorite coins, 1INCH, can be considered for a medium-term investment during the green zone testing.
Take your risk, make some profit !

1inch token forming a bullish Gartley | A good buy opportunityHi dear friends, hope you are well and welcome to the new trade setup of 1inch token with Bitcoin pair.
Our last successful trade of 1INCH was below:
On a monthly time frame a big move of 1inch is still in play as below:
Now on a 4-hr time frame, 1INCH is about to complete a bullish Gartley pattern.
Note: Above idea is for educational purpose only. It is advised to diversify and strictly follow the stop loss, and don't get stuck with trade

1INCH formed bullish Gartley for upto 3190% big pumpHi dear friends, hope you are well and welcome to the new trade setup of 1inch token.
On a monthly time frame, 1INCH has formed a bullish Gartley pattern:
Note: Above idea is for educational purpose only. It is advised to diversify and strictly follow the stop loss, and don't get stuck with trade

1INCH Falling Wedge1INCH on this daily timeframe has formed a lovely falling wedge
These more often than not break out bullishly to the upside
It seems price is already starting to creep in that direction
Yes it is also confirmed that this falling wedge is only 1INCH in length

1INCH/USDT BUY SETUP 50-100% POTENTIAL1INCH Breakout Falling wedge pattern, and Valid Retest resistance become support after breakout
RSI Bullish divergence
MACD Showing Bullish crossover on Daily
Potential continue upward movement 🚀
Target mentioned in the chart
Stoploss : $1.4
Risk : 10%

1INCHUSDT - Double Bottom1INCHUSDT (1h Chart) Technical analysis
1INCHUSDT (1h Chart) Currently trading at $2.53
Buy level: Above $2.55 (Buy after breakout)
Stop loss: Below $2.33
TP1: $2.63
TP2: $2.72
TP3: $2.82
TP4: $2.95
Max Leverage 3x
Always keep Stop loss
Follow Our Tradingview Account for More Technical Analysis Updates, | Like, Share and Comment Your thoughts.

1INCHUSDT , We broke downward trendlineHello guys
Its amazing decentralized exchange that it work with ARBITRUM , Do you know what is it ? ( if until now you dont know , send us messages )
In here after the price supported from static support zone the price impact to the downward trendline ( dynamic resistance ) and we have compression price in zone , because of the reason we explain , the price break the resistance and it can go a little up for the place of settlement traders and after that pullback to the trend line and ... ( we will update the chart that time )
If you have any question just open private message and send us Hello . :D :D :D :D :D
Dont forget use stop loss and observe money management
Good Luck
Abtin

1Inch USDT Next Potential MovementThis is the next potential movement of 1Inch, if 1Inch price bounce at $4 support, 1Inch will go to $5.5, if there is a breakout at $5.5 resistance, 1Inch will go to $7

NeutralHi guys, wait for the downtrend to break and then you can keep up with the targets and if the price reaches the uptrend again you can buy with the loss of the uptrend.

#1inch ✔🚀1 inch breaks a long-term downtrend and is ready to move towards the targets drawn in the chart.
I hope you find this analysis useful🌹
Follow for more...
#DYOR

LONG! 1inch about to explodeAs long as BTC stays above 42700. Long 1inch.
Entry: 3.05
TP1: 3.78
TP2: 4.58
TP3: 5.19

#1INCHUSDT Ready for Pump. BREAKING OUT!Welcome to this trade setup, everyone. If you are reading my updates for the first time do follow me to get more complex charts in a very simplified way. I also post altcoin setups on Spot, Margin, and Futures.
1inch is breaking out now.
Inverse H&S Breakout with multiple retests on the neckline. SHows signs of accumulation.
ENTRY: $2.05 TO $2.20
TARGETS:
$2.27
$2.32
$2.39
$2.47
$2.55
Stop Loss : $2.03
DYOR before taking this trade.
More setups will be posted soon.
Do hit the like button if you want me to post such setups every day.
Do share your views in the comment section.
Thank you

1inch looks realy good. 5$ possible ? 1 inch has broken many important resistances. If the market remains strong now and also breaks through the current stand-up zone, the 5$ will be left with nothing in the way. of course, the entire market must now remain strong for this. Lets see......

1INCHUSDT Good Entry!1INCHUSDTUSDT(4H CHART) Technical Analysis Update
Falling Wedge
1INCH/USDT currently trading at $5.20
Buy-level: $5.00- $5.20
Stop loss: Below $4.40
Target 1: $5.60
Target 2: $5.90
Target 3: $6.00
Target 4: $6.50
Max Leverage: 2X
ALWAYS KEEP STOP LOSS...
Follow Our Tradingview Account for More Technical Analysis Updates, | Like, Share and Comment Your thoughts.

The easiest +100% ever 👌 🚀🚀technically,
- 1inch was accumulating for long time ago since weeks which means that it still has great potential to go up.
- 1inch is making ATH, which means its already still making new records n the bull run hasn't ended yet.
fundamentally,
- 1inch is an under valued project, n who ever comes n ask me for holding coins I advice him with 1inch.
- Long term target can reach up to $90 within next months.
✅ Buy: 7 - 7.40 ✅
🎯TARGETS:
1- $ 12.00
2- $ 15.02
💵 Trade Size: 5-7% of Portfolio
🚫Invalidation(SL): 4 hr candle close below $ 5.67
Please click LIKE button and Appreciate my hard work.
Must follow me for latest crypto real time updates.
Thank you.

1INCH - Catch the BreakoutBreakout of tight trading range on the USD pair
While on the BTC pair price is in a backwards cup and handle, continuing to form the Cup.
Good buy
