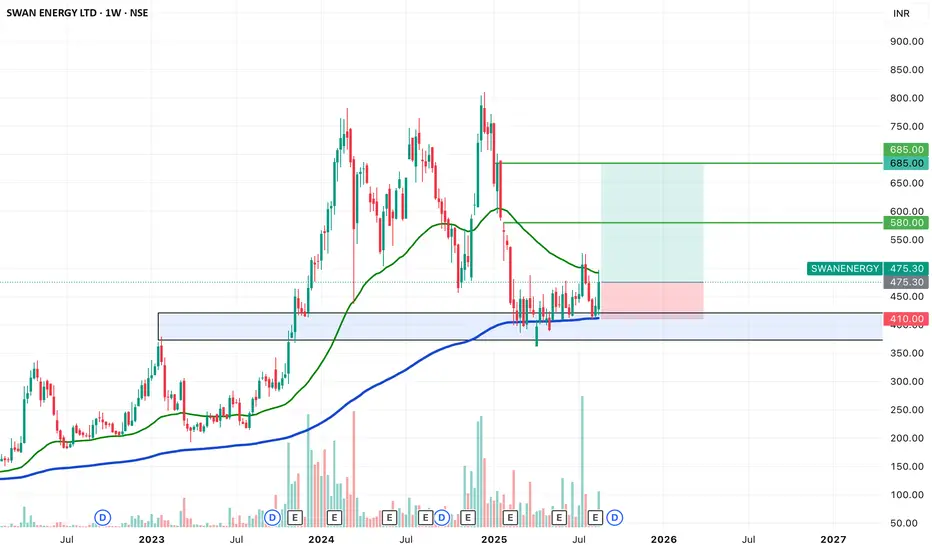
SWING IDEA - SWAN ENERGYSwan Energy , a diversified company with interests across textiles, energy, and real estate, is showcasing a strong swing trade opportunity backed by reliable technical signals.
Reasons are listed below :
The 450 zone has acted as a strong support, and price is now attempting a breakout from a 6-month Darvas box consolidation.
A strong bullish engulfing candle on the weekly timeframe signals renewed buying interest.
The 200 EMA on the weekly chart is acting as a solid support.
The stock is also bouncing from the golden 0.618 Fibonacci retracement zone.
Target - 580 // 685
Stoploss - weekly close below 410
DISCLAIMER -
Decisions to buy, sell, hold or trade in securities, commodities and other investments involve risk and are best made based on the advice of qualified financial professionals. Any trading in securities or other investments involves a risk of substantial losses. The practice of "Day Trading" involves particularly high risks and can cause you to lose substantial sums of money. Before undertaking any trading program, you should consult a qualified financial professional. Please consider carefully whether such trading is suitable for you in light of your financial condition and ability to bear financial risks. Under no circumstances shall we be liable for any loss or damage you or anyone else incurs as a result of any trading or investment activity that you or anyone else engages in based on any information or material you receive through TradingView or our services.
@visionary.growth.insights
200ema-pullback
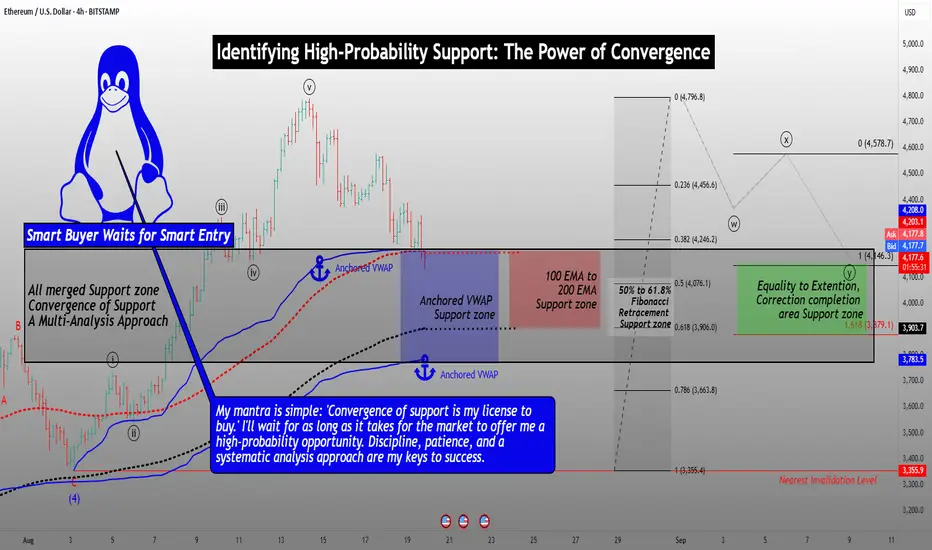
Identifying High-Probability Support: The Power of ConvergenceHello Friends,
Welcome to RK_Chaarts
Today we're going to learn Comprehensive Guide to Identifying Convergent Support Zones
Which are High Probability Support areas. This post is for Educational purpose only.
This detailed analysis will walk you through a step-by-step process of combining multiple technical analysis methods to identify a robust support zone. We'll explore how Elliott Wave theory, Anchored VWAP, EMA200, Fibonacci Retracements, and equality to extensions can coincidentally converge on the same support zone.
Step 1: Elliott Wave Analysis
Begin by identifying the Elliott Wave structure. Look for impulse waves, corrective waves, and the relationships between them. In this example:
- Wave Y is potentially completing near the equality zone (100% to 161.8% extension).
- This level marks a potential reversal point.
Support zone as per Elliott Wave theory Analysis
Step 2: Anchored VWAP Analysis
Apply Anchored VWAP to identify key support levels:
- Plot the VWAP from the last swing low and the second-last swing low.
- Note the convergence of these VWAP levels, which can indicate strong support.
Support zone as per Anchored VWAP Analysis
Step 3: EMA200 Analysis
Add the 200-period Exponential Moving Average (EMA) to your chart:
- The EMA200 has consistently provided support during previous corrections.
- Note the price approaching this level, increasing the likelihood of a bounce.
Support zone as per 200 Exponantial Moving Average
Step 4: Fibonacci Retracement Analysis
Apply Fibonacci retracements to the previous rally:
- Identify the 50%, 61.8%, and 78.6% retracement levels.
- Note the current fall has already exceeded the 38% retracement.
Support zone as per Fibonacci Retracement Analysis
Step 5: Convergence of Support Zones
Combine the analysis from each step:
- Note the striking convergence of support zones:
- Elliott Wave equality zone (100% to 161.8% extension)
- Anchored VWAP support zone
- EMA200 support level
- Fibonacci retracement zone (50%-61.8%)
Coincidentally all these are providing nearly same Support area (Price zone)
Trading Implications
With the convergence of these multiple analysis methods, you can:
- Identify a high-probability support zone.
- Look for buying opportunities near this zone.
- Monitor price action and market sentiment for confirmation of a reversal.
- Consider scaling into positions or setting limit orders within the support zone.
Important Note: Failure to Hold Support
If the price fails to hold support at this converged zone, it may indicate a stronger bearish trend. In this scenario:
- Be prepared for a potential significant downfall.
- Consider adjusting your trading plan to account for the increased bearish momentum.
- Keep a close eye on price action and market sentiment for further guidance.
By understanding the convergence of these multiple analysis methods and being aware of the potential risks, you'll be better equipped to make informed trading decisions and navigate the markets with confidence.
I am not Sebi registered analyst.
My studies are for educational purpose only.
Please Consult your financial advisor before trading or investing.
I am not responsible for any kinds of your profits and your losses.
Most investors treat trading as a hobby because they have a full-time job doing something else.
However, If you treat trading like a business, it will pay you like a business.
If you treat like a hobby, hobbies don't pay, they cost you...!
Hope this post is helpful to community
Thanks
RK💕
Disclaimer and Risk Warning.
The analysis and discussion provided on in.tradingview.com is intended for educational purposes only and should not be relied upon for trading decisions. RK_Chaarts is not an investment adviser and the information provided here should not be taken as professional investment advice. Before buying or selling any investments, securities, or precious metals, it is recommended that you conduct your own due diligence. RK_Chaarts does not share in your profits and will not take responsibility for any losses you may incur. So Please Consult your financial advisor before trading or investing.
BTCUSDT 4H – Key Support Test | Bounce or Breakdown?
Bitcoin has been in a clean uptrend for the past few weeks, making consistent higher highs and higher lows. Recently, we’ve seen a pullback that’s now testing a major confluence zone, which makes me lean bullish in the short term.
Here’s what I’m looking at:
1. 200 EMA (4H)
Price is currently testing the 200 EMA, which has acted as dynamic support throughout this uptrend. This is often a key level where bulls step back in after a healthy correction.
2. High Volume Node (102.5K–103.5K)
This area lines up with a visible HVN on the volume profile, suggesting strong previous acceptance and institutional interest. Holding this area implies a potential base for the next leg higher.
3. Retest of Ascending Trendline (Broken)
We’ve broken the minor ascending trendline, but price is now testing horizontal demand + EMA, which could act as the real support. This isn’t invalidating the uptrend structure yet — just a deeper pullback.
4. Demand Zone + Volume Spike (Recent)
The previous demand zone is still valid, and we saw a decent spike in sell volume into support — which could indicate a liquidity sweep or stop hunt, setting up for a reversal.
Trade Setup
📈 Long Setup: Bounce from Confluence Zone
Entry Zone: $102,300 – $103,300
Stop Loss: $101,400 (below HVN + 200 EMA)
Target 1: $106,000
Risk/Reward: ~1:2.5
This setup banks on BTC holding the 200 EMA and key HVN, continuing its overall bullish structure. A clean 4H bullish engulfing or a strong close above $104K would add even more confirmation.
Invalidation Criteria
If BTC closes a full 4H candle below $101,500 with no immediate buyback, I’ll consider the setup invalid and step aside — the next major HVN is around $96K, and I’ll look to long there instead.
BTC is pulling into a beautiful confluence of structure, volume, and dynamic support.
Short-term bearish pressure looks more like a corrective move within a bullish trend.
I’m looking to scale into longs if this zone holds. Tight invalidation and clean structure — great R/R.
Bullish Argument
First real test of 200 EMA since early April — trending markets often bounce here
Consolidation on top of prior demand — this could be a liquidity sweep / fakeout
High-volume support just below price = buyers likely interested here
We still haven't broken any key swing lows, so higher timeframe structure is intact
Bearish Risks to Watch
Trendline break and sustained lower highs = momentum shift
Lack of immediate bounce = could mean support is weakening
Break and close below $101.5K likely opens the door to $96K–$97K next HVN

$INDEX:BTCUSD Death Cross Potential - 200 EMA test imminent INDEX:BTCUSD
BTC has been stagnant since the initial excitement over the political landscape got brought back to earth through the talk of steep tariffs by the US on imports from its main suppliers and trading partners. The DEEPSEEK bomb went off around the same time sending the big buyers to put a pause on accumulating crypto and we have seen the this translate into a very weary market.
And Now because of investor insecurity smart money is waiting for the price to fall to take advantage of the fear that we are witnessing the end of the cycle and 20k btc is around the corner. No Such luck, however we do get a nice DEATH CROSS on the daily looking like weekend price movement is bound to see selling pressure that will drive the 20 EMA below the 50 EMA which will see bearish results in price and pressure to trend downwards
Anyone reading my Posts knows that I've been eyeing the 200 EMA on the daily as a zone that we are bound to visit before the market can continue to increase and set higher highs. I've previously given my reasons why in previous posts ie. convergence, fvg, support. I believe this could be the pressure that will drive is into those mid to low 80k areas that seemed so far away a few weeks ago, low 70's are also in play if we can't hold the 200 EMA or the psychological 80k support . I believe that enough buyers are waiting down there for those fire sale prices that once we do hit the 200 EMA it will be paramount to assess market conditions before going full in on the bounce likely to take place around 84,500k the 200 EMA's relative area that ties into the liquidity in the FVG.

Bitcoin could retest 4hr 200ema and then run hard!I think a small pull back is likely, we are so close to the 200ema and perhaps it will converge with up-sloping and down-sloping resistance for a volatile reaction. Not financial advice, DYOR

Crypto RUNEUSD. Trade I took long 1hr ago. Lined up on the Daily
Thought I would briefly describe this long trade i entered in RUNEUSD about an hour ago. Volume levels are about average for Crypto, it is now aligned perfectly on the 2ooEMA Daily.
Price has moved back on me a bit. But I think it might go okay from here,

Pick of the Currency Outbreaks AUDUSD. More bulls ahead.
This is the Daily chart of AUDUSD. It's up well over 1% today.
It looks to have strength continuing to the upside due to a change in momentum favouring the Aussie.
You can see in the chart of daily how the 200ema has turned in favour of the Aussie.
I would be looking for a pullback to this 200ema which is about 0.6652 to 0.6655 to offer a wider zone of buying.
If you look ahead on the Daily, you will see a huge head n shoulders bullish setup which the bulls will be chasing.
I wrote a month or 2 ago how I expected the Aussie to breakout, but the USD has also returned to strength.
We also saw AUD perform very strongly against a basket of of other currency's in the Asian session earlier.

Another bullish setup on Daily 200EMA CADJPY
Price recently came out of a falling wedge on an intraday chart and this sort of occurrence is usually bullish as price wants to run on its own outside of a wedge.
Price here is at the 200ema on daily and it looks like it is ready to pop.
I already went long, if you trade it then good luck.

VELO RSI looks beautiful VELO looks beautiful on all higher time frames. I especially like 3D RSI, which is setting up nicely, but needs to stay above 50 level. 12H and D1 look great as well...both RSI position and market structure. I first want to see what happens when price breaks above the previous highs marked with the blue horizontal line.
Ideally I would like to long the restes of the broken level and a retest of 12H 200 EMA and SMA.
Another option would be to simply go in with a starter position once the level breaks. I would preferer option 1. Let see what we get
Happy trading

Polkadot(DOT): 200EMA Rejecting The PricePolkadot is looking similar to Litecoin, where 200EMA is acting as a pretty strong rejection zone, which is pushing the price lower and lower with each touch.
We are looking again for that lower zone (greenish) to be broken and a movement towards that target zone.
Swallow Team

ARKK Finding Support on the 65minARKK found support last week around the $48.50 area, and is currently surfing the 200 EMA on the 65min chart. Two open gaps to the upside leave this with plenty of room to run back up to the local high from late December.

TSLA Trendline RetestTSLA breakout failed to end the year but is now currently backtesting the trendline. It's been surfing the 200 EMA, and If that holds, this seems like a great risk reward spot to go long. A red to green open would provide a great entry. 5 straight days down and then a doji candle smells like a possible reversal as well. Initial Targets $250 $265

$US500 SP500 forecast.Here's what I'm looking at.
I still think $4100 is on the table for a bottom. Reason being, there's multiple levels of confluence there.
1) If you take the AVWAP from the Jan 2022 highs, it comes to around $4100
2) It's a horizontal level
3) It's roughly the measured objective of the Head and Shoulders break down
4) It's also coming in around the 0.618 fib level.
Of course there will be levels of support along the way, one being the current $4260 area.
This $4260 area is also a confluence of support with
1) It's a horizontal level on the weekly
2) The 200EMA on the Daily chart
3) The AVWAP from the recent March 2023 lows.
Either we see a bounce and recovery from here ($4260 area) or if we break lower we'll see 4100.
For now, I still think $4100 may be the low for this correction.

RELIANCE going to 2200?RELIANCE weekly chart had broken down from an upward trendline in January. Since then it has pulled back and retested the trendline. The bearish bar dated 29th May suggests than the selling pressure could resume. Specifically if the price trades below 2400.
We could expect prices of about 2200, a sort of retest of the 200 EMA on the weekly chart in the near future.

SWING TRADE FOR GPILThis is a buy recommendation for this stock
why?
stock is at its 200 ema support
small stop loss but a big target

EURUSD - Potential Long PositionPlease let me know what you thing, your feedback is appreciated.
Classic Pullback Strategy.
Price is currently in a uptrend respecting the trend line and the 200EMA.
Price have retraced back to the 50% Fib Level
As price is at Support Zone we have to look for Price Action before jumping in, If the Support, Trend Line and 200EMa is broken we can look at a possible reversal.

Triangle Break-Out in 1 DTF//HGINFRA+++The Triangle is broken with good candle and also sustained in today's session.
++The Supports(+) and Resistances(-) are also perfectly respected.
+Lets follow the Price Action in keeping the SL(Under 14 Dec candle) and Target R:R should be (2.5)> .
Happy #Christmas Trading Mates!

GBPUSD have bottomed?Has GBPUSD bottomed? Price action suggest that it has. Since GBPUSD dropped to $1.036, higher lows pattern have formed WITH contracting pattern (tightening). From that pattern I drew a trendline.
Price broke the key moving averages confluenced with the trendline break. Currently price is retracing back to its mean 50/100/200 after testing several times the $1.163 level.
Actionable plan : wait for the price to test the key moving averages (keep it simple) and identify a rejection at those level and then Long.
*Rejection could be anything. but preferably confluenced with pocket pivot (blue bar or green bar at volume indicator)

Ford - A good spot for a swing trade Long?Looking at the Ford weekly chart, share price has fallen hard since Jan. of this year with no relief pull-back. Well over 50% from the low in March 2020. Is it at a good level now for that pull-back to happen?
Notice a possible head and shoulder formation brewing in the works. Price is at the 200ema on the weekly and at the .618 fib level. The .618 fib level is at a point of support also. Stoch RSI has been under 20 since early Feb. Maybe a good time to pick up a few shares for the longer term investor. Or possibly a nice swing trade long.
It'll be interesting if price just destroys this zone or reacts to it.

AUDCAD BREAKOUTTIMEFRAME: 4H
TOOLS USED: 200EMA, trend channel, dynamic support/resistance
We can see price has broken the 200EMA on the 4 hour which is a huge confirmation of the trend changing and along with that we break support and trend line which are also very very significant levels
Potential Profit: 500 pips
position: Long

Wallstreets wants the Q's weekly EMA 200 again?Currently we are inmiddle of one of the most chaotic times, and stockmarket is starting to price in some serious fears into the market.
Just eventually be prepared, that wallstreet might be aiming for some real deep value here.
Btw. currently we buy the 100 week average price on nasdaq, not the worst spot to maybe start a fresh longterm depot, DCAing on the way down to maybe the weekly 200 might be somewhat of a chance with long horizon.
Stay safe guys, trade setups coming soon again, busy times..

AUDUSD GOING DOWN FROM HERE - GREAT SWING TRADEI take short trade here from the following reasons:
1.Bear flag (the last wave before breakout)
2.Resistance
3.Supply candle (marked with yellow TL)
4.Bear Shooting star candle
5.200ema
6.Entry the Fib golden zone
7.50,100,200 EMA Weekly just above the price.
Just look nice for me

BIOCONNSE:BIOCON
rectangle pattern breakout and 200 ema/dma breakout
best time to enter for swing trade /intraday
for the short target of 388,394
with stop-loss 351
use retest method
plz do ur own analysis before taking trade.
