Rising Wedge Pattern S&P 500There is clear a Rising Wedge Pattern formed on S&P 500 4h chart .
There was even a retracement from all-time highs of 6979 back inside the wedge before the weekend.
My suggested SL is 7030-7050 and TP 6500-6550 for the short-to-mid term.
On a larger scale, there is also a huge channel that we are testing the top of right now:
Going all the way back to 2008..
It could easily end up like this:
So for longer term I can see 6100, 5500, 5000 and if recession hits than even 3500.
There has never been such a major Fed hiking and cutting cycle that did not eventually cause a recession. Also, the labor market is weaker than the headline numbers make it seem. Lots of massive downward revisions on NFP. Even the unemployment number is growing slowly, mostly because Labor Force Participation is dropping. If we account for that, then the real unemployment rate is more like 5.5%.
Here are some more examples of rising wedges going back to the pandemic:
4h

AAVE/USDT LONGEntry: $184–186.5
SL: $169.9
TP: $195.5–202
Risk: 1%
Long from the local 4h base around the daily demand zone 178–185 after a liquidity sweep below 180 and successful defense of support, targeting a rebound into the upper bullish FVGs and supply zone at 195.6–202+, with potential extension toward the higher cluster $208–220.
Fundamental driver: Aave controls ~72% of the crypto lending market, generates about $90M in monthly revenue and is widening its lead over Spark; whales have added 50k+ AAVE over the last 30 days and now hold an all‑time high of 3.98M tokens, continuing to buy into dips, while one major address is repeatedly using recursive borrowing to accumulate more AAVE. The SEC has officially closed its investigation and did not classify AAVE as a security, removing a key regulatory overhang and opening room for repricing a DeFi blue chip whose tokenomics actually capture protocol fees and value (unlike cases such as Plasma). The setup is counter to the local “total bearish” EMA regime, so execution should be via lower‑TF reaction and partial entries within the range, with staggered profit‑taking at liquidation clusters and FVGs; the idea is fully invalidated on a sustained break below $170 and a clean loss of trend support.

XAUUSD: Channel Push Points to $4,220 as Next TargetHello everyone, here is my breakdown of the current Gold setup.
Market Analysis
Gold remains in a broader bullish structure, but the recent price action is developing inside a well-defined ascending channel, where price is currently moving from the lower boundary toward the upper one. After a sharp correction, XAUUSD found strong support at the $4,040 level, which aligns with the bottom of the channel and produced a fake breakout, signaling lack of bearish continuation.
Currently, price has started a new upward swing, respecting both the channel structure and the mid-line trend dynamics. However, despite the recovery, XAUUSD is still trading below the major $4,220 resistance, which previously acted as a strong reaction zone and remains the key obstacle for buyers.
My Scenario & Strategy
My scenario is bullish, as long as price stays above the support zone around $4,040 and maintains structure inside the ascending channel. I expect Gold to continue climbing toward the $4,220 resistance, where the upper channel boundary also converges, forming a strong confluence area.
Therefore, a clean breakout above $4,220 would open the way for higher targets and continuation of the broader trend. However, if price reaches this zone and shows strong rejection or weakness, we may see a pullback into the channel — but the bullish structure remains intact as long as the lower boundary holds. For now, the market supports a long bias, with the key objective being a retest of the $4,220 resistance zone, which is the next major level buyers are aiming for.
That's the setup I'm tracking. Thank you for your attention, and always manage your risk.

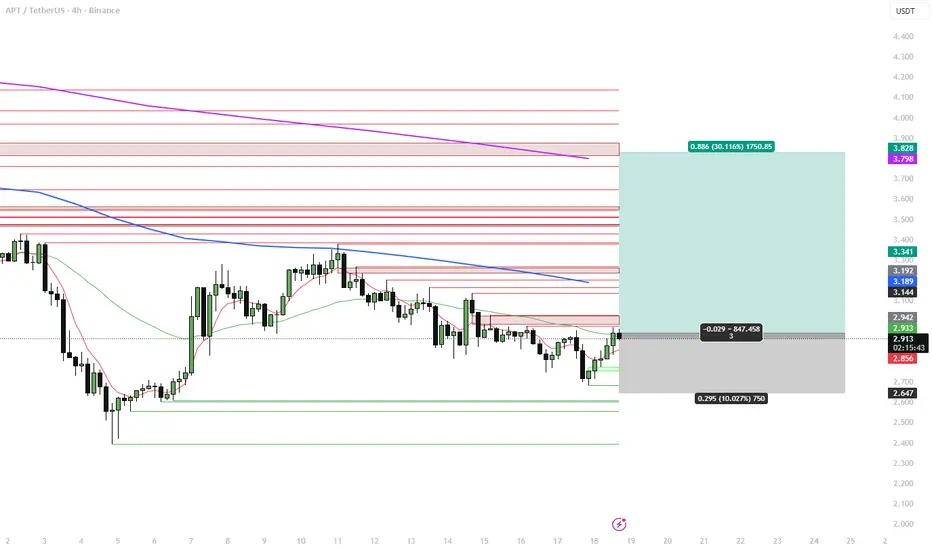
APT 4H – Stablecoin-heavy L1, swing long from local baseAptos is trading around $2.9 with a market cap near $2.1B, still down ~85% from the $19.9 ATH. At the same time the chain carries ~$512M TVL and ~$1.27B in stablecoins (almost half of that in the RWA token BUIDL). That’s a lot of liquidity for a token this depressed.
Over the last month APT is up ~+10%, and on several recent days Aptos briefly beat both Ethereum and Solana by net stablecoin inflows. The main fundamental driver is the Aave V3 launch on Aptos (first non-EVM deployment) plus an institutional staking narrative (Everstake + Paribu Custody). The big overhang is still tokenomics: ~11–12M APT unlocks each month in 2025 and generally high inflation vs current on-chain demand, plus the controversial “freeze” function at protocol level.
Technical view (#4h)
On the 4H chart APT has been in a controlled downtrend from the 3.7–3.8 area and recently put in a local low near 2.63–2.65, right on my lower ATR / demand zone.
Now:
Price is reclaiming the short EMA and pressing into the 4H EMA band from below around 2.9–3.0.
Below sits a well-defined support shelf at 2.60–2.65; above are stacked supply/FVG levels around 3.16–3.20 and a larger cluster near 3.8–3.9, which coincides with higher-TF EMA and previous breakdown zone.
My 4H system has flipped from pure deviation mode to an early trend-reversal long: oversold extension + first reclaim of the EMA band.
I treat this as a swing-long attempt from a local base inside a bigger bearish cycle, targeting a move back into the prior distribution zone.
Trade plan (swing 3–10 days)
Entry: around 2.90–2.95 (current price area).
Main target: 3.30–3.35 – first 4H supply band and old support.
Extended target: 3.80–3.85 – upper supply zone and confluence with higher-TF resistance.
Stop / invalidation: below 2.63–2.65. A confirmed 4H close under this level would mean the current base failed and I step aside instead of averaging down.
This gives roughly 3:1 R:R toward the extended target.
Fundamental context
Aptos is a Move L1 with strong stablecoin presence: ~$1.27B in stables and ~$512M TVL, plus meaningful RWA share (BUIDL ≈44% of stablecoin cap).
Aave V3 on Aptos is the first non-EVM deployment for Aave, anchoring a more “institutional” DeFi narrative on this chain.
Institutional staking partnerships (Everstake + Paribu Custody) support the idea of APT as a staking asset, but not yet as a clear “number go up” token.
Main risks: continuous monthly unlocks (~11M+ APT), inflationary supply vs demand, and competition from larger L1s (Sui, Solana) with bigger TVL and higher chain revenue.
Alternative scenario
If APT loses 2.63–2.65 and starts closing 4H candles below this zone on rising volume, I’ll consider the current long thesis invalid and look for a deeper capitulation / deviation toward 2.4–2.2 before reassessing. No averaging into unlock-driven selling.
Not financial advice – just how I’m structuring a 4H swing long on APT around strong on-chain liquidity and Aave V3, while respecting the heavy tokenomics overhead.
UNI 4H – Post-UNIfication consolidation longUniswap remains one of the key DEX protocols: TVL is around $4.5B and 30-day DEX volume is roughly $94.6B, which keeps Uniswap at the top of the sector by liquidity and fee generation.
Over the last 30 days UNI is up ~+22%, with a sharp acceleration in November (70%+ week) after the UNIfication proposal: enabling protocol fees and burning up to 100M UNI (~16% of supply). That fundamentally changes expectations for UNI as a value-accrual token rather than “governance only”.
On derivatives, UNI trades with deep liquidity: OI ≈ $560M, ~ $1.16B futures volume and ~$220M spot per 24h, so larger positions can enter/exit without severe slippage. Regulatory tail risk also eased earlier this year when the SEC closed its investigation into Uniswap Labs without charges.
Technical setup (#4h)
After the vertical post-UNIfication spike into the 10–11 area, UNI has been digesting the move in a sideways 4H range roughly between 7.3 and 8.1:
Price is hovering around the 4H EMA band; on higher TFs (1D–3D) UNI still trades above the main EMAs, keeping the broader uptrend intact.
Multiple tests of the lower part of the range (7.3–7.5) have been bought back, with my PRICE_EMA long signals firing near the lower deviation/ATR zone.
Overhead, a major supply/OB cluster sits around 10–10.5, which also matches the prior spike highs and HTF resistance.
I view this as a post-news consolidation above support within an emerging bullish trend.
Strategy context
This trade comes from my 4H EMA-based swing system (trend-following mode):
The system focuses on buying pullbacks to the EMA band during strong momentum phases and targeting prior liquidity zones.
Sample of 30+ trades on alts shows roughly ~70% win rate with average winners larger than losers, at the cost of relatively wide stops and multi-day holding times.
UNI currently fits the “momentum + consolidation on EMAs” template for this system.
Trade plan (swing 3–10 days)
Entry zone: ~7.5–7.7 (current spot around 7.6–7.7).
Main target: 10.2–10.3 – retest of the post-UNIfication spike high and upper supply block.
Stop / invalidation: below 6.8–6.9 (under the lower ATR band and recent local lows). A 4H close below this zone would mean the consolidation broke down and the “second leg” scenario is off.
This gives a rough R:R of ~3.5:1 from entry to the 10.2–10.3 target.
I’ll look to trail partial size if price breaks and holds above 8.5 (orange level) with strong volume, but the core idea is to catch one clean extension from the current range into the upper resistance cluster.
Fundamental snapshot
Key bullish points:
UNIfication: proposal to turn on protocol fees and burn up to 100M UNI (~16% supply), aligning Labs, Foundation and DAO economics and finally connecting UNI to protocol cash flows.
Strong fee engine: Uniswap generates ~$1.25B annualized fees, ~$100M in the last 30 days, currently all going to LPs – a large “pool of value” that fee switch can redirect partially to UNI.
Sector leadership: ~$94.6B 30-day DEX volume and deep liquidity in UNI markets (tens of millions in depth), making it one of the core DeFi blue chips.
SEC case closed: investigation into Uniswap Labs ended without charges, cutting a major tail risk.
Key risks:
UNIfication is not fully implemented yet – parameters of fee switch and burn (LP share vs DAO vs burn) can still change and may trigger LP outflows.
DeFi / DEX tokens as a group still trade at a discount vs L1s, and Fear & Greed is in Extreme Fear territory.
UNI is still ~−80% below its $44 ATH, so structurally it’s early in any potential new DeFi cycle.
Alternative scenario
If UNI breaks down and starts closing 4H candles below 6.8–6.9 with no new positive catalysts on UNIfication or DeFi sentiment, I’ll treat this setup as invalid and stand aside, watching the 6.0–5.5 area for a deeper retrace and fresh structure before considering new longs.
Not financial advice — just my structured 4H EMA swing long on UNI, combining the current consolidation pattern with system stats and the UNIfication fundamental narrative.

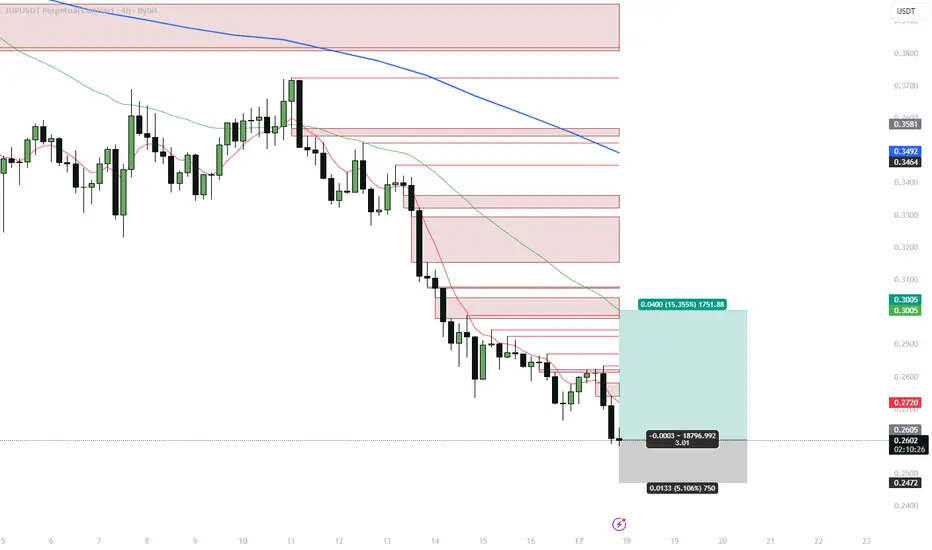
JUP 4H – Deviation long from lower rangeJUPUSDT (Bybit) is trading near the lower end of its autumn range after a clean 4H downtrend from the 0.33–0.34 area. My 4H EMA deviation system has just printed a long signal as price extends away from the higher-timeframe averages.
Technical setup (#4h)
Price is below the 4H, 1D and 3D EMAs, with Dev% on multiple TFs showing strong downside extension (high single-digit / low double-digit % below the mean).
We’ve just tagged a new local low around 0.25–0.26 with several multi-TF exhaustion markers firing near the lower ATR band.
Overhead, the first liquidity pocket and resistance cluster sits around 0.26–0.28, with a larger supply/FVG zone and EMA confluence around 0.30–0.31.
I treat this move as a late leg of the existing selloff and a potential mean-reversion opportunity back into the 4H EMA ribbon and prior supply.
Strategy stats (this 4H deviation system)
Backtest/forward sample: 33 trades, all longs
Win rate: ~69.7% (23 wins / 10 losses)
Avg PnL per trade: ~+4.1%
Avg winning trade: ~+10.0%
Avg losing trade: ~−9.6%
Avg bars in trade: ~34 bars on #4h (≈ 5–6 days), with losers typically lasting longer than winners
The system is built to catch oversold 4H swings with a relatively high hit rate and symmetric win/loss size, so sticking to invalidation levels is crucial.
Trade plan (swing 3–7 days)
Entry: around 0.26 (current long triggered in this area).
Main target: 0.300–0.305 — previous 4H supply zone and confluence with the EMA band.
Stop / invalidation: below 0.247. A 4H close under this level would mean the current demand failed and opens the door toward deeper supports around 0.23–0.22.
This setup offers roughly 3:1 R:R from entry to the 0.30–0.305 target.
Fundamental snapshot (Jupiter)
Jupiter is the main DEX aggregator and perps venue on Solana. Over the last 30 days:
Protocol fees / revenue are roughly $78.8M / $19.0M, showing a robust on-chain business across spot + perps.
Governance approved a burn of ~130M JUP (~4% of circulating supply) from the Litterbox Trust (vote passed on 4 Nov 2025).
Token unlocks continue on a scheduled basis (e.g. ~53.47M JUP on 28 Oct 2025), keeping some overhang in the short term.
November 2025: launch of the Jupiter ICO / launchpad platform, adding another product line on top of swaps and perps.
Saros DLMM integration is aimed at deeper liquidity for JUP and ecosystem pairs.
Net read: cash-flow-positive DeFi infra with upcoming product catalysts, but short-term price still sensitive to unlocks and derivatives positioning — a good environment for volatile swings and mean-reversion trades.
Alternative scenario
If unlock / derivative selling pressure accelerates and JUP starts closing 4H candles below 0.247, I’ll consider this idea invalid and look for a new deviation long lower in the 0.23–0.22 zone rather than averaging down.
Not financial advice — this is my structured 4H EMA deviation long on JUP, combining system stats with current Jupiter fundamentals.
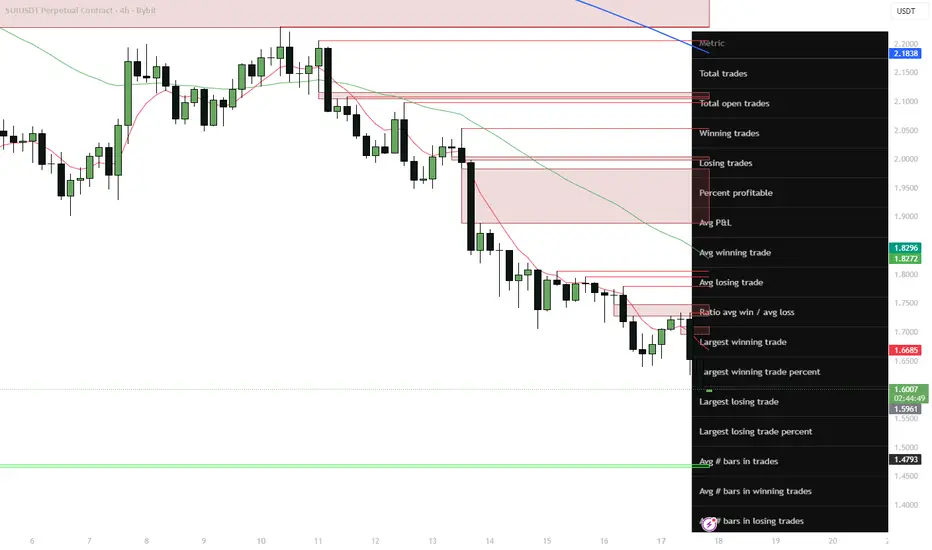
SUI 4H — Deviation long into unlock risk (mean-reversion setup)Got a fresh long signal from my 4H EMA deviation strategy on SUIUSDT (Bybit).
After a persistent downtrend from the 2.3–2.0 area, price has flushed into my lower deviation / demand zone and is now extended from the main EMAs on several timeframes.
On the chart (#4h):
– Price is trading well below the 4H and 1D EMAs, Dev% on multiple TFs shows strong extension away from the mean.
– We just printed another local low with a cluster of my multi-TF “exhaustion” signals, right on the lower ATR band.
– Above price sit the first liquidity pockets around 1.66–1.69 and then a larger supply/FVG zone near 1.75–1.83, aligned with the 4H EMA ribbon.
– I treat this move as a liquidation / unlock front-run leg inside a still-resilient higher-TF range for SUI.
Strategy stats (for this 4H deviation system)
31 trades, all longs:
– Winrate ≈ 83.9% (26W / 5L)
– Avg win ≈ +12.5%, avg loss ≈ −6.6% → avg R:R ≈ 2.37
– Avg holding time ≈ 24 bars on #4h (about 4 days)
So the system is designed to take oversold 4H swings and ride the mean-reversion back into the EMA band / supply zones over 2–5 days.
Trade plan (swing 2–5 days)
– Entry: around 1.60–1.62 (current long triggered near 1.61).
– Main target: 1.75–1.77 — first 4H supply zone and mid of the previous distribution block.
– Extended target: 1.82–1.83 — upper boundary of the 4H supply cluster and confluence with higher EMA/ATR levels.
– Invalidation: 4H close below 1.48. That break would mean the current demand zone failed and I step aside.
This gives an R:R of roughly 1:2 from entry to the extended target.
Fundamental snapshot
SUI is still holding in the upper part of its yearly range despite the recent correction. Over the last 30 days:
– TVL around ~$3.03B (≈$1.64B bridged, ~$1.39B native), with strong DEX volume (~$383.5M/day) and perps volume (~$144.3M/day).
– Narrative tailwinds: upcoming USDsui native stablecoin from Bridge (Stripe-backed), institutional rails via Crypto.com custody/liquidity, and the Mysticeti v2 core upgrade from Mysten Labs.
– Headwinds: notable November unlocks (~$146.6M pool), TVL pullback of ~15% from the October peak and sector-wide risk-off in L1/alt space.
Net read: structurally positive fundamentals and growing ecosystem, but short-term risk is higher due to unlocks and derivatives positioning — ideal conditions for sharp but tradeable mean-reversion moves.
Alternative scenario
If unlock selling and risk-off pressure continue and SUI starts closing 4H candles below 1.48, I’ll treat this as a deeper leg toward the next demand around 1.40–1.35 and will wait for a new deviation signal rather than averaging down.
Not financial advice — just a structured 4H deviation long based on my system stats and current SUI fundamentals.
SYRUP 4H — Deviation long (Maple Finance)SYRUP (Maple Finance) printed a strong flush on the 4H chart and is now trading in my first demand / deviation zone after breaking down from the 0.42–0.45 range.
Fundamentals remain constructive:
– AUM > $5B in Q3, up ~66% QoQ.
– Q3 revenue around $4M with an October ATH of ~$2.16M.
– 25% of protocol revenue is allocated to SYRUP buybacks and staker rewards (MIP-018/019), directly linking the token to cash flows.
So we have a fundamentally supported DeFi credit token going through a short-term deleveraging move.
On the 4H chart:
– Price is trading below both 4H and 1D EMAs, with Dev% showing clear oversold conditions vs the mean.
– The last leg down came with a vertical selling cluster into the lower ATR band.
– Above price, the key liquidity zones are 0.422–0.423 (broken support + EMA area) and 0.44–0.445 (supply cluster / range high).
I treat this as a potential mean-reversion setup rather than a fresh downtrend start.
Trade plan (swing 1–5 days)
– Long area: 0.395–0.405, with optional partial add on a spike toward 0.38.
– Main target: 0.422–0.423 — retest of broken support and the 4H EMA region.
– Extended target: 0.44–0.445 — upper supply zone and range high.
– Invalidaton: 4H closes below 0.355. Stop goes under this level; if it breaks and holds, the setup is done and I wait for a new base lower (0.334–0.31).
This gives an approximate R:R of ~1:2 toward the main target and higher if the extended target is hit.
Alternative scenario
If DeFi risk keeps unwinding and 0.355 fails to hold, I expect price to explore the 0.334–0.31 area, where a new accumulation zone may form. In that case this long idea is invalid and I’ll re-map the structure before looking for the next entry.
Not financial advice — just my 4H EMA deviation swing framework combined with current fundamentals on Maple Finance.

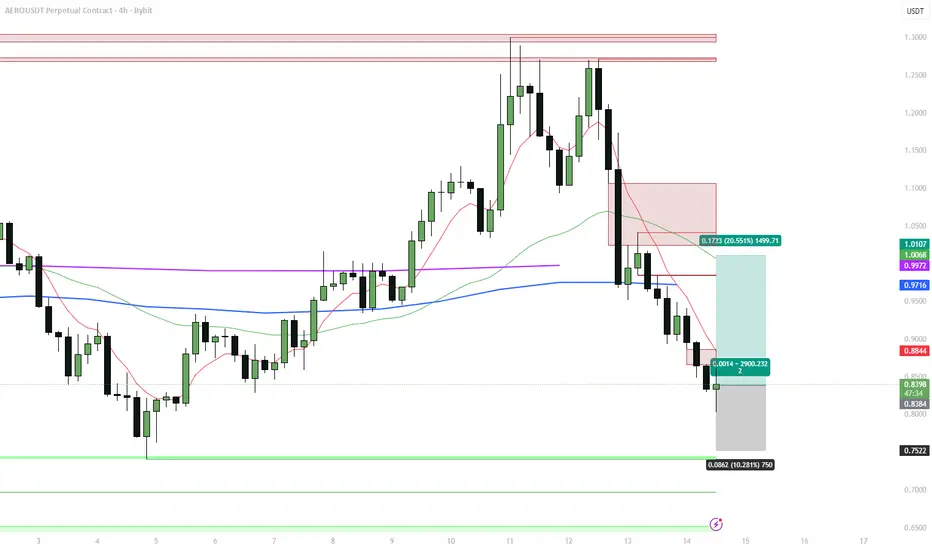
AEROUSDT 4H – EMA Deviation Long on Base Liquidity Engine1. Setup
Aerodrome is still the main liquidity flywheel on Base and is now set to merge with Velodrome into a single AERO token that will also live on Ethereum and Circle’s ARC. After the post-news flush, price on Bybit perps sits around 0.84–0.85, below the 4H EMA band and inside my demand + deviation zone.
I’m taking a 4H EMA Deviation long with a swing horizon of ~1–3 days.
2. Technical context (4H)
The local trend topped near 1.10–1.12, where multiple higher-TF order blocks sit. From there we got a clean breakdown through the 4H EMA ribbon and a series of lower lows into the green demand cluster around 0.82–0.84.
Current trade levels on the chart:
Entry: 0.842
Stop: 0.758 (below demand and the last capitulation wick)
Target: 1.014–1.02 (4H EMA re-test + prior consolidation / supply)
That’s roughly +20.5% upside vs −10.3% downside, R:R ≈ 2:1.
The 4H deviation sits above its average “stretched” reading, so the setup fits my mean-reversion rules rather than chasing trend.
3. Strategy statistics – 4H EMA Dev Long (AERO)
Backtest on this pair / timeframe: 26 trades, long only.
Winrate: 80.77%
Avg PnL per trade: +8.24%
Avg winner: +10.98%
Avg loser: −3.28% → win/loss size ratio ≈ 3.34
Largest winner: +25.17%, largest loser: −5.67%
Avg duration: 24 bars, winners around 21 bars, losers ~36 bars
Historically, losers are shallow but drag out longer; if this bounce doesn’t materialise within a typical 20–24 bar window, I’d rather cut than sit through slow bleed.
4. Fundamentals & narrative
Active positives right now:
Merge with Velodrome into one protocol and token (“AERO”) launching on Ethereum + Circle’s ARC. Existing Aerodrome holders are set to receive 94.5% of the new supply – strong alignment for current AERO holders.
Aerodrome controls ~53% of Base’s ~$4.7B DeFi TVL via ve(3,3) mechanics. About 45% of AERO is locked with an average remaining lock of 2.8 years, and protocols compete for veAERO via $2–4M weekly bribes, generating 35–45% APR from real fees, not emissions.
Narrative kicker: deposit tokens from JPMorgan reportedly already operating on Base, with the chain framed as a “default banking L2”. If that flow scales, first-order liquidity beneficiaries are AERO, lending, and major DEX routes on Base.
Expired but still relevant context:
Programmatic buybacks via the Public Goods Fund – over 150M AERO acquired and 4y-locked across PGF, Flight School, Relay.
Aerodrome crossed into deflation in September 2025, with cumulative $400M+ fees and a model where 100% of DEX revenue goes to veAERO lockers.
Large strategic lockers include Coinbase and Animoca, strengthening the “institutional Base” story.
Score: BBB+ / Positive, with key risks in narrative overextension (Base banking thesis needs confirmation), merge execution, and general market beta.
5. Trade plan & invalidation
Idea: play a mean-reversion bounce from 4H demand + EMA deviation back into the 1.00+ supply zone, while the Base / merge narrative is still hot and fee flows stay strong.
If price closes 4H below 0.758 and can’t quickly reclaim the EMA ribbon, I treat the setup as invalid and step aside – that would indicate a deeper reset of the whole move from 0.70. If we tag 1.00–1.02, I’ll realise most of the position there and only trail a small runner in case the merge and Base catalysts trigger a new leg to fresh highs.
Not financial advice – just documenting a systematic EMA Deviation long on one of the key Base liquidity primitives.
SYRUPUSDT 4H – On-Trend Long in Institutional Credit RWA 1. Setup
BINANCE:SYRUPUSDT is the token of Maple Finance – an institutional on-chain credit / RWA platform with syrupUSDC/USDT products and a clear fee → buyback model.
Spot trades around 0.44–0.45 with 24h volume in the $45–58M range and a market cap near $510M. Drawdown from the June ATH at 0.6532 is only ~31%, so this is not a “dead rebound” but a mid-trend pullback.
My 4H On Trend Long strategy has triggered a fresh long after a higher low around the 4H EMA band, with all intraday timeframes (15m–3D) in “Above trend” state while only 1W remains below.
2. Technical context (4H)
Price has been oscillating around the 4H EMA ribbon, respecting it as dynamic support. The last dip into ~0.43–0.44 was bought up, leaving a higher low at the blue support block. From here I’m following the system and joining the existing uptrend instead of trying to catch an extreme deviation.
Trade levels on the current setup:
Entry zone ≈ 0.449
Invalidaton ≈ 0.428 (break below local demand / 4H EMA stack)
Main target ≈ 0.533–0.537 (prior local high and resistance cluster)
That’s roughly +18.6% upside vs −4.8% downside, R:R ≈ 3.9.
3. Strategy statistics – 4H On Trend Long (SYRUP)
Backtest sample: 65 trades, long only.
Winrate ~41.5% – many small scratches and failed trends.
Average PnL per trade +1.70%.
Average winner +5.6%, average loser −2.1% → win/loss size ratio ≈ 2.45.
Largest winner +22.1%, largest loser −7.3%.
Trades are relatively short-lived: ~5 bars in total on average, ~8 bars in winners.
So the edge is classic trend-following: lower hit-rate, but winners tend to pay for several losers. This current setup fits the profile – risk is kept close to the historical average loss, while the target lies in the upper zone of past winners.
4. Fundamentals & flows
TVL and AUM keep expanding: Maple has >$5B AUM in Q3, +66% QoQ, with institutional inflows above $500M recently.
Revenue momentum is strong: about $4M in Q3 (+41.5% QoQ), with an October revenue ATH around $2.16M.
The protocol directs 25% of protocol revenue into SYRUP buybacks, creating a direct link between credit growth and token demand.
Recent news highlighted integrations with Aave and other DeFi venues, plus a Q4 ecosystem call focused on 2026 plans – all keeping the RWA/credit narrative warm.
On derivatives, OI sits near $25M, with futures volume roughly 1.5–3x spot. This leverage mix can amplify moves in both directions, so invalidation needs to be respected.
Scorecard from my dashboard:
Sentiment +9, Momentum neutral, Liquidity high, Risk medium, Confidence ~80%.
5. Trade plan & invalidation
The idea is simple: follow the existing 4H uptrend with a system long, using the EMA ribbon as a dynamic line in the sand.
If price closes 4H below 0.428 and fails to quickly reclaim the EMA band, I treat the trend leg as broken and exit. If the move plays out, I’ll look to realise most profits around 0.53–0.54, where earlier sellers were active, and only keep a small runner in case the fundamental momentum drives a new ATH push.
Not financial advice – just a structured on-trend long setup in one of the stronger RWA / credit names.

PLUMEUSDT 4H – EMA Deviation Long on RWA + USDC CatalystSetup
BYBIT:PLUMEUSDT just printed a fresh 4H EMA Deviation long signal after a sharp flush below the EMA stack. Price is trading around 0.038–0.039, with all key timeframes (15m, 1H, 4H, 1D, 3D) in “Below / Oversold” state on my EMA Dev dashboard. Current 4H deviation is ~28%, above the historical oversold average (~26%), which fits my rules for a mean-reversion long.
I am looking for a bounce back into the 4H EMA band and the nearest supply zone, where the previous distribution leg started.
Technical context
The downtrend from 0.055–0.056 pushed price under the 4H and 1D EMAs and into the lower ATR corridor. The last impulsive candle washed out local longs and expanded deviation to one of the highest readings in the current sample.
Key levels on the chart:
• Entry zone: 0.038–0.039 (current 4H demand / max negative deviation)
• First target: 0.0485–0.0490 (4H EMA cluster + local supply)
• Optional second target: 0.055–0.056 (prior breakdown area / 1D EMA region)
• Invalidation: sustained 4H close below the spike low around 0.034–0.035
As usual with this strategy, I’m not trying to catch the exact bottom – the edge comes from entering when deviation is stretched and closing into the EMA / resistance band.
Strategy stats (PLUME, 4H EMA Dev long)
Backtest sample: 20 trades, long only.
Winrate: 75%.
Avg PnL per trade: +3.75%, avg winner +8.15%, avg loser −9.45% (win/loss ratio ~0.81).
Largest winner +17.4%, largest loser −15.4%.
Losing trades tend to last longer (≈62 bars) than winners (≈25 bars), so if price sits under EMAs too long without mean reversion, I prefer to cut rather than “marinate” in drawdown.
Given the current ~28% negative deviation, the upside to the 4H EMA/supply (~+25–28%) is larger than the historical average winner, while downside to invalidation is kept near the typical loss profile.
Fundamentals & narrative
Plume is positioning as an RWA chain with a focus on compliant tokenized assets:
CCTP V2 and native USDC are now live on Plume, enabling smoother cross-chain liquidity flows.
Nest Protocol is relaunching on Plume using Pendle-style mechanics with TVL in the hundreds of millions, supporting the yield/RWA narrative.
There is active collaboration with Circle (CCTP + USDC workshop) and a growing stack of institutional RWA products (WisdomTree funds, Galaxy allocation, prior SEC transfer-agent registration, etc.), although some of those catalysts are already “spent” in the short term.
Main overhang: an upcoming unlock of ~239.65M PLUME (~2.4% of supply) on 21 December, which can cap the upside if spot demand doesn’t keep up. My fundamental score here is around BBB+ – constructive RWA + USDC story, but with clear unlock risk.
Trade plan
Base case: fade the current oversold deviation on 4H, ride the move back into 0.048–0.049, and optionally trail a small remainder toward 0.055–0.056 if momentum and flows improve.
If price fails to bounce and closes 4H below 0.034–0.035, I consider the EMA Dev setup invalid for now and step aside until a new deviation cluster forms.
Not financial advice – this is a systematic mean-reversion long based on my EMA Deviation framework plus the current RWA / USDC catalysts on Plume.

ZENUSDT 4H – EMA Deviation Long from Demand Zone after Base Migr1. Setup
BINANCE:ZENUSDT corrected ~38% in the last week and is now sitting in a 4H demand cluster around 11.6–12.0 after the Base migration is mostly priced in. My EMA Deviation strategy printed a fresh long signal here, so I’m taking a swing long on Bybit perps.
2. Technical picture (4H)
Price has been trending below the 4H EMA band, with a sequence of lower lows into stacked demand between 11.6–12.0.
The current entry is taken on a rejection of the lower demand block with risk placed just below the local liquidity sweep.
First target is the 4H EMA / previous breakdown area around 14.2–14.3, where the last strong sell impulse started.
Trade parameters on the chart:
• Entry: ~12.0
• Stop: 11.64 (below demand and recent low)
• Target: 14.28
This gives roughly +19% upside vs ~3% downside, R:R ≈ 6.4.
3. Strategy stats
This long is taken strictly by the EMA Deviation rules on LSE:ZEN 4H:
• Winrate: 68.85%
• Avg PnL per trade: +3.89%
• Avg winner ≈ +10.3%, avg loser ≈ −10.3% (win/loss ratio ~0.92)
• Largest winner: +23.8%, largest loser: −23.7%
• Losing trades on average last more bars (53) than winners (23), so I prefer tight invalidation and not “hoping” through long drawdowns.
Current setup is better than the historical average: risk is compressed to ~3% while the target is in the area of the strategy’s best winners.
4. Fundamentals & flows
Horizen 2.0 migrated BINANCE:ZENUSDT to Base (ERC-20), while the legacy mainchain and EON are being deprecated. Circulating supply is ~17.6M out of 21M max – classic low-float privacy coin profile.
On derivatives, OI is around $50M+, futures volume is several times spot, and funding across major venues is near zero. That combination suggests a heavy perp-driven market without an extreme positioning bias yet, but with potential for accelerated squeezes once spot demand returns.
On-chain, liquidity is concentrated in Base DEX pools (Uniswap / Aerodrome), while aggregated TVL numbers still look underdeveloped – narrative and integrations are lagging price.
Recent catalysts: completion of the Base migration, “Made in USA / privacy” narratives, plus listings for staking/participation products. At the same time, price is still −93% from ATH and just printed a −37% weekly flush – classic environment for mean-reversion rather than momentum chasing.
5. Trade plan & invalidation
Idea: fade the extreme downside deviation from the 4H EMA into demand, ride the bounce back into the 14+ resistance / EMA band while derivatives remain heavy and funding flat.
If price closes 4H below 11.64 and cannot immediately reclaim the demand block, I consider the long idea invalid and step aside – that would open the door for a deeper reset of the whole Base-migration pump.
If we reach 14.0–14.3 quickly, I’ll scale out most of the position there and only trail a small runner toward higher EMA deviation targets.
Not financial advice. This is a structured swing idea based on my EMA Deviation system plus current ZEN fundamentals and derivatives context.

Swing Setup: (1D+4H) POI + 5min DIVERGENCE + FVA RESPECT So I did my top down analysis, saw a 1D FVG and price respected it, so I looked for divergences and i found it on the 5min, saw price made an FVA and displaced through it so I decided it was time to enter that because a 4H and 1D FVG is a strong POI, and the fact that price did not burst through it meant it was getting respected.
So I think it was at this time that I saw the FVA has formed and has been respected so I looked for an entry.
For the actual entry, I think there was a small bullish FVG there above the FVA so I took that.
Since price was at a 1D + 4H FVG, I considered it as the Internal Range Liquidity(IRL) and therefore targeted the External Range Liquidity (ERL). I put my SL quite far, at the bottom of this sting into the FVG. It got me 2.8RR I think, and that's good enough.
I made this trade on friday, and it only resolved the next trading day, which was monday.
TL;DR, 4H and above POI(IRL), once you see it getting respected (with an FVA + FVG), take it as a sign, enter without hesitation, and target the ERL.

USDT.D — 1W FVG Test & RSI Bull Div | Caution for RiskUSDT Dominance is testing a major 1W FVG support area while developing bullish divergences on the 4H RSI. Although a short-term bounce and market correction are likely, the overall bullish trend in BTC means a sharp reversal is not guaranteed. Risk management is a priority here — no high-risk positions until the RSI resets and market context is clearer.
1W FVG support + 4H RSI bull div
Bounce likely = correction on risk assets
RSI needs reset to 50 before reassessing
If lost — risk-off, possible slice down
Reasoning: Support + momentum, but trend is bullish — not risking gains here

Ethereum 4H Range As we approach nearly a month in the range from $4000-4800 it looks like ETH is making a move once again.
Previously once hitting $4800 price gradually sold off back towards range low creating a bearish trendline, once the price broken above that level a rapid move up to range high within two candles.
Now looking at the chart we have a similar setup, strong breakout from the bearish trendline up into midpoint. Bitcoin currently retesting a key level of $112,000, should BTC flip this level I could see alts getting the greenlight to move up and Ethereum up to the highs.
Should BTC reject from $112,000 it makes sense that ETH range midpoint would be strong resistance, rejection could lead to a range low retest. Anything else that isn't either range high, range low or midpoint is noise and for me no action required, no need to over complicate it.

PUMP | #4h #long — Watching for Breakout Confirmation Early signals for a reversal, but not rushing in.
Some clear bullish divergence on the 4h RSI — first positive sign after an extended downtrend. Price can pop from here, but my plan is to wait for a break and hold above the 4h Order Block + MSS zone (red box) before taking any long entry.
Confirmation is key — I only want to get involved if we reclaim this area with momentum.
Scenario:
If we get a strong breakout and close above the red OB + MSS zone, that’s the first entry trigger for a potential trend reversal.
Until then — standing aside, letting the setup prove itself.
Reasoning:
Bullish RSI divergence often marks the beginning of a reversal, but without a structural breakout, the move can easily fail.
Patience pays off in these high-risk, low-liquidity coins.

Gold Respecting Key Support — Downtrend Still Active on the 4HPrice on XAUUSD is currently hovering around the 3,324 zone, reacting to a clear support area that’s held firm since the last major dip.
The uptrend is no longer valid — it's been broken multiple times and has now been decisively rejected.
We’re still trading below a short-term descending trendline, which remains active.
A prior liquidity sweep below support (around 3,247.54) may have been a fakeout to trap late sellers.
If price fails to break the short-term trendline, this bounce could be short-lived.
However, a clean breakout above the trendline could open up retracements toward the 3,360–3,384 area.
Stay alert for a retest of support at 3,310–3,324, and watch how price behaves near the trendline before considering entries.
Bias:
Neutral to Slightly Bearish — Until trendline break is confirmed, downside continuation is still on the table.

Gold: death cross doesn’t forgive bullsTechnically , gold is stuck around 3336–3354, right at the 0.705–0.786 Fibo cluster and strong volume resistance. But the key signal is a death cross: MA50 cutting below MA200. This bearish pattern strengthens the downside outlook. RSI remains weak, confirming lack of buying momentum. If 3336 breaks, targets lie at 3298 and 3282 (1.618 Fibo extension).
Fundamentally , gold lacks bullish support. The dollar may not be overly strong, but it stays stable thanks to Fed’s cautious policy. Oil near highs fuels inflation expectations, making gold less attractive. No new geopolitical shocks mean safe-haven demand stays muted.
Tactical plan : below 3354 pressure remains on sellers. Break under 3336 confirms downside with 3298 → 3282 targets. Only a close above 3354 would flip the short-term bias, but current MA structure and volume point to more weakness.
Bottom line: death cross is not a romantic metaphor - it’s a cold reminder that bulls are losing the fight.

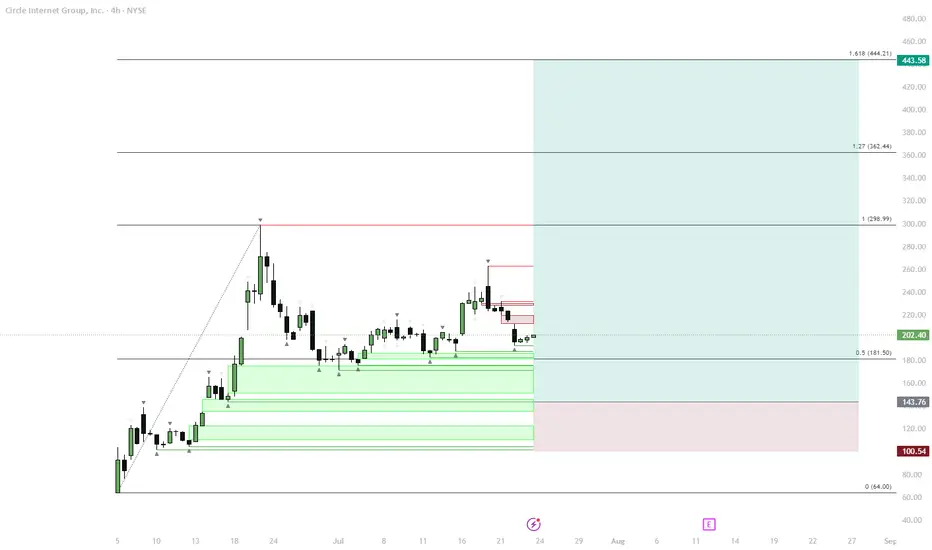
CRCL – Classic Crypto IPO Fractal in Play?Initial Pump:
Price launched rapidly after listing, forming a local high.
Sideways Phase:
Market settled into a sideways consolidation, typical after the first pump.
Retrace:
A retrace toward the 0.5 Fibonacci zone (~$181.50) is developing. Typical retracement in similar "crypto stonks" ranges from 60-80%.
Accumulation in Demand Zone:
Multiple support levels are stacked between $180–$140, indicating a strong demand zone for accumulation.
True Move Potential:
If the support holds, a new bullish leg could start, targeting Fibonacci extensions ($299, $362, $444). If the support is lost, the next levels are $143 and $100.
This scenario is based on the repeating behavioral fractal seen in high-profile crypto listings: explosive initial move, multi-week consolidation, and a deep retracement before the real trend emerges. Current price is entering the key demand area, which aligns with previous market structure seen on token launches. The risk/reward for new longs becomes attractive here if buyers defend the zone. However, invalidation is clear if price breaks below $140.
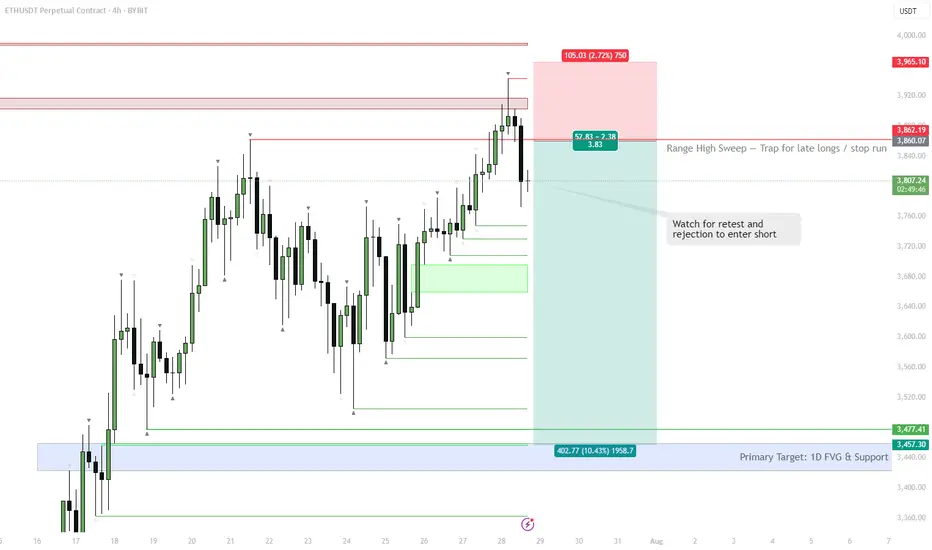
ETH | #4h #short — Range High Sweep & Short SetupScenario:
ETH swept the range high at $3,860, trapping late buyers and triggering stops. Watching for a retest of this level — if it holds as resistance and we see rejection, that’s a short trigger.
Target:
Main target is the 1D FVG at $3,457–$3,477. Possible extension: sweep of range low if selling accelerates.
Why:
Failed breakout setups are classic mean reversion triggers, especially when supported by a visible liquidity pool (FVG) below.
Plan:
Wait for a retest and rejection to confirm short. Partial TP at the FVG zone, manage risk above the sweep high.
BTC | Short Bias — Targeting $113kPrice rejected perfectly off the 0.5 retracement and is now filling the previous imbalance.
Yesterday's daily close was decisively bearish, confirming downside momentum.
There’s a lack of convincing reversal signals at current levels.
Plan:
Main expectation is continued downside toward the $113k support.
Not interested in longs until price stabilizes at or below that level.

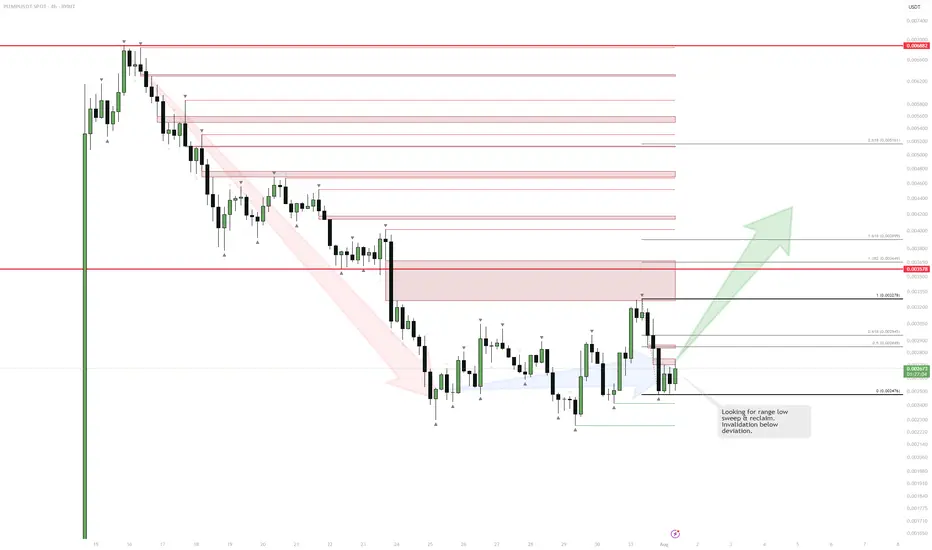
PUMP | Watching for Base ConfirmationThe sharp downtrend is showing signs of exhaustion as price starts to consolidate and build a potential range.
If we see a sweep and reclaim of the range low, that would confirm the start of a new accumulation phase and signal a potential reversal.
The invalidation for any long attempt is a confirmed breakdown below the deviation or the origin of the reclaim.
Plan:
Wait for a clean sweep and reclaim of the range low to trigger a long entry.
Target resistance levels above, with stops set below the reclaim origin.
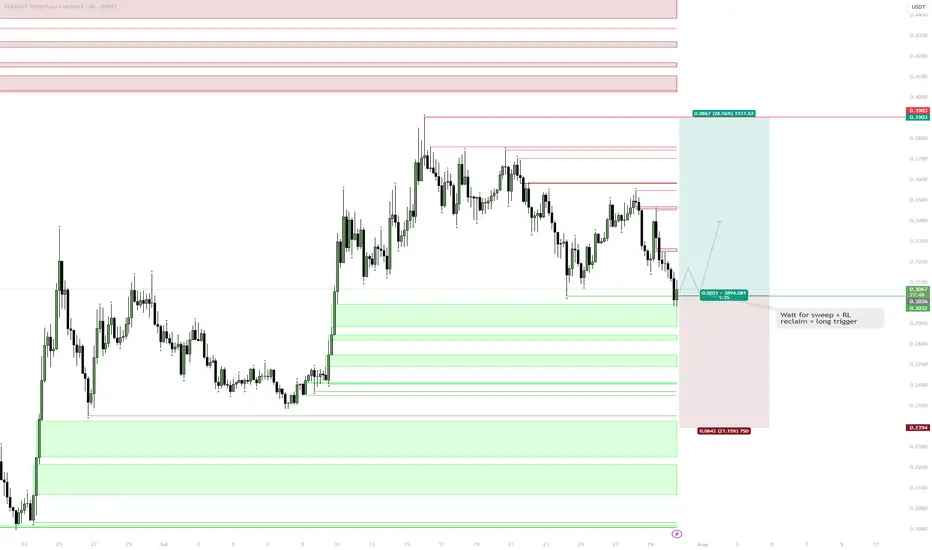
SEI | Setup: Sweep & Reclaim Scenario:Wait for a sweep of the range low (RL) into the Daily FVG (gray box).
Look for a reclaim of RL as the trigger for a long.
Reasoning:
Sweep into FVG traps late sellers and sets up liquidity for a reversal.
Reclaiming RL after the sweep signals strength and confirms a local bottom.
No need to chase entries—best R:R is after liquidity is cleared and level is retaken.