ETH/USDT 4H chart🧭 Trend Context
• Main Trend: Up – clear HH/HL breakout.
• Price respects the uptrend line (orange).
• The last upward impulse was very strong (dynamic breakout to ~3400).
⸻
📊 Key Horizontal Lines
🔴Supports
• 3188–3200 – local support + prior S/R flip
• 3130 – strong structural support
• 3052 – last line of trend defense (critical)
🟢 Resistances
• 3232 – current resistance (price reaction now)
• 3317 – important resistance/consolidation
• 3404 – high impulse (local ATH)
⸻
📐 Price Structure
• The drop from ~3360 to ~3188 looks like an impulse correction, not a trend reversal.
• Currently, the price:
• has rebounded from support
• is above the trend line
• is fighting against 3232
👉Into the decision zone.
⸻
📉 Stochastic RSI
• Was oversold (0–20)
• Now retracing upward
• Potential for an uptrend, but no confirmed breakout
⸻
🔮 Scenarios
✅ Baseline scenario (bullish – more likely)
Conditions:
• Hold >3188
• Breakout and 4-hour close above 3232
Targets:
• 3317
• 3400–3420
⸻
⚠️ Corrective scenario
If:
• Rejection from 3232
• Reversion to the downtrend
Targets:
• 3188
• 3130
• Extreme: 3050 (still uptrend)
4hrchart

BTC/USD 4H Chart Review🔎 Market Structure
Medium-term trend: up
The price is moving within an ascending channel (the lower and upper limits are nicely respected).
Last move = upward impulse from a consolidation breakout.
📈 Current Situation
The price has broken out above key resistance at ~94,600 USD (red line)
We are currently in the 97,500–98,200 USD zone (local resistance).
This is the first test of this zone from below → a natural place for reaction.
🟩 Key Levels
Resistance
98,200–98,300 USD – local resistance (green line)
103,800 USD – main channel target / ATH region
Supports
94,600 USD – most important support (flip from resistance)
89,400 USD – middle of the structure + previous accumulation
Lower channel boundary ~87–88k USD – last defense
📊 MACD
Strong bullish crossover
The histogram is rising → upward momentum is accelerating
No downward divergence (on (for now)
➡️ This supports continued growth, not a reversal.
🧠 Scenarios
🟢 Baseline scenario (most likely)
Short consolidation/pullback
Retest of USD 94,600–95,000
Continuation up → 98k → 100k → 103–104k
🟡 Alternative scenario
Rejection of USD 98k
Drop to USD 89,400
Still uptrend as long as the channel holds
🔴 Bullish negation
4-hour close below 89,400
Then the structure breaks down → drop to 86–84k

SOL/USDT 4H chart📌Market Structure
• Medium-term trend: up
• Clear Higher Low (around 117 → 126 → 133)
• Price respects the ascending trend wave (black)
• Currently consolidating after an upward impulse
⸻
🔴Key Horizontal Lines
Resistances
• 140.4 USDT – local resistance, multiple rejections
• 147.2 USDT – main resistance/supply zone
Supports
• 133.2 USDT – most important short-term support (POC of the structure)
• 126.9 USDT – strong HTF support + trendline
• ~117–120 USDT – extreme (end-of-line scenario)
⸻
📊Oscillator (Stoch RSI)
• Currently in an oversold zone
• No advanced bullish trend yet Crossover
• To the owner:
• Pullback/recovery, not an immediate drop
• Potential available below 140+ if support holds
⸻
🧠 Scenario
🟢 Baseline scenario (more likely)
• Weapons price 133 USDT
• Consolidation 133–140
• Breakout 140.4 → 147.2
• Target: 147–150 USDT
🟡 Corrective scenario
• Breakout of 133 USDT
• Downside to 126.9 USDT (ideal retest of the trendline)
• Market decision there:
• Defense → continuation up
• No defense → deeper correction
🔴 External scenario (less likely)
• Loss of 126.9
• Structure change → entry to area 120 / 117

BTC/USDT 4H Chart📈 Trend
Main trend: up
Local trend: downward correction
The uptrend line (black) has still not been broken → this is crucial.
🟩 Support Zones
The most important levels you have well-marked:
91,120 – 91,400
Current price reaction
Local support + mid-range
Decisive in the short term
90,120
Very important zone
Overlaps with:
previous consolidation
potential retest of the trendline
Loss = deepening correction
88,843
Strong structural support
If price reaches here → high probability of bounce
87,235
Bulls' last line of defense
Break = structure changes to bearish
🔴 Resistance
91,400 – 91,500
Nearest resistance
Here we'll see if the uptrend has fuel
92,718
Very important level
Return above = bulls regain control
94 834
High / supply zone
Unlikely to be broken on the first try without an impulse.
📊 Stochastic RSI
Was heavily oversold.
Now bouncing from the lows → a short-term bounce signal.
Note: in an uptrend, the Stochastic RSI often gives false short signals.
➡️ Supports a corrective bounce scenario, not a dump.
🧠 Scenarios
🟢 Baseline scenario (more likely)
Defense 90-91k
Bounce → test 91.5k → 92.7k
Consolidation and decision
🔴 Negative scenario
Break 90 120
Down to 88.8k
Reaction there (or fake breakdown)

ETH/USDT 4H Chart Review1️⃣ Market structure
• Short-term trend: upwards
• The price respects the upward trend line (orange).
• Breakout and maintenance above 3018 USDT → confirmed higher low.
• Currently consolidating under resistance.
➡️ The market is in the continuation phase, not the distribution phase.
⸻
2️⃣ Key Levels
🔴 Support
• 3018 USDT – key flip (former resistance → support)
• 2898 USDT – strong HTF support/structural lows
• Trendline – dynamic support
🟢 Resistances
• 3205 USDT – local resistance / recent high
• 3428 USDT – major HTF resistance (target for breakout)
⸻
3️⃣ Oscillators
📉 Stochastic RSI
• Was overbought, now it's down to around 40-50
• This is a healthy pullback in an uptrend, NOT a sell signal
➡️ Perfect place to continue after re-accumulation
📊 CHOP
• CHOP was falling → the trend was developing
• Now it returns to around 50-55 → consolidation before the move
Very often followed by a directional impulse
⸻
4️⃣ Scenarios
✅ Baseline scenario (more likely)
• Maintenance >3018
• Short consolidation
• Breakout 3205
• Target: 3,428 USDT
📌 Momentum + structure + oscillators = bullish setup
⸻
⚠️ Corrective scenario
• 3205 rejection
• Pullback to:
• 3018
• or trend lines
• Only then does the demand respond
➡️ As long as there is no 4H close < 3018, the trend is NOT broken.

XRP/USDT 4H chart review🔍 Price structure
• The price was moving in a descending channel (orange lines).
• There was a strong rebound from the low of ~1.825–1.83, with a clear lower wick → demand defended the level.
• Currently, the price has returned to the interior of the channel, but has not broken it above yet.
⸻
📊 Key levels
Support:
• 1.8555 – local support (now crucial, because after breaking up it should act as support)
• 1.8256 – very strong support (bottom + demand reaction)
Resistances:
• 1.8776 – nearest resistance (local high + consolidation)
• 1.9175 – main resistance / target after breaking the channel
⸻
📈 Momentum/indicators
Stochastic RSI:
• A clear exit from the oversold zone
• The lines are dynamically going up → bullish momentum, but:
• We are close to the overbought zone, so a short correction or consolidation is possible
⸻
🧠 Scenarios
🟢 Bullish scenario (more likely in the short term)
• Maintenance 1.855–1.86
• Breakout and closing of the 4H candle above 1.8776
• Goals:
• 1.90
• 1917–1992
➡️ This would be confirmation of exit from the descending channel.
⸻
🔴 Corrective scenario
• Rejection 1.8776
• Back to:
• 1,855
• in a worse variant, retest 1.83
➡️ Until 1.8256 breaks, the structure still looks like a higher order uptrend correction.

ETH/USDT 4H Chart Review🧭 Current Market Structure
Medium-term trend: up, but at risk
The price has broken below the uptrend line (black diagonal).
After a strong upward impulse, a sharp downward candlestick (distribution) appeared → no continuation of the uptrend.
This is a classic signal of bullish weakness, not a full trend reversal, but a warning.
🔑 Key Levels
🟢 Resistance
3059–3070 – very strong resistance (multiple reactions)
3126 – higher timeframe resistance (if it reaches this level → euphoria)
🟡 Decision Zone (now)
2938–2960 – current consolidation
This is where the market decides whether to return above the trend or move lower.
🔴 Supports
2911 – local support (very important)
2868 – strong structural support
2755 – critical support (reversal of the uptrend)
📉 RSI Stochastic
A pullback from the upper levels (80+) to ~20
Downward momentum has not yet expired
No bullish divergence → no signal for an aggressive long
📌 Scenarios
🔵 Scenario A – bullish (less likely)
Conditions:
Defense 2911
Return above 2960 + 4-hour candle close
Trend line reclaim
Targets:
3059
3126
👉 This would be a fake breakdown
🔴 Scenario B – bearish (more likely)
Conditions:
4-hour close below 2911
No quick rebound
Targets:
2868
then 2755
👉 Healthy correction in the trend or a change in structure to sideways/bearish

LINK/USDT 4H Short-Term🔍 Market structure
• Local trend: it was upward (black trend line), it was broken down
• This means lost momentum for the bulls and a transition into correction/consolidation
• No higher low structure yet → the trend is not rebuilt
⸻
📉 Price vs levels (key zones)
🔴 Support:
• 12.20 – upcoming, very important
• 12.00 – psychological + technical
• 11.74 – last line of defense for the bulls
👉 Going below 12.20 increases the chances of 11.74
🟢 Resistances:
• 12.61 – currently strong resistance (flip S/R)
• 12.95 – local peak
• 13.21 – main target when the trend returns
⸻
📊 Momentum – Stochastic RSI
• Indicator close to the oversold zone
• Possible:
• short technical bounce
• BUT without trend confirmation (no HH/HL)
⚠️ Rebound ≠ trend change
⸻
📌 Scenarios (Highlights)
🟡 Scenario A – corrective reflection
• Weapon price 12.20
• Move up to 12.61
• Perfect place for supply response
👉 If 12.61 is rejected → further consolidation or decline
⸻
🔴 Scenario B – continued decline
• 4H close below 12.20
• Movement towards 12.00 → 11.74
• Only there is reasonable demand
⸻
🟢 Scenario C – bulls return (least likely now)
• Breakout and holding above 12.61
• Structure confirmation (HH + HL)
• Targets: 12.95 → 13.21

ETH/USDT 4H Chart Review🔎 Market Structure
Medium-term trend: downward
The price is moving within a descending channel (orange lines).
Each upward breakout has been corrected lower so far.
Current: consolidation after a strong rebound from the low.
📉 Key Levels
🔴 Support
2925 USDT – very important local support (currently being tested).
2756 USDT – strong support from the previous reaction.
2600 USDT – last line of defense (structural low).
🟢 Resistance
3057 USDT – key resistance + near the moving average (SMA).
3225 USDT – strong supply reaction level.
3346 USDT – upper range of the structure, very strong resistance.
📐 Moving Average (green)
Price below the SMA → market still under supply control.
Until the 4-hour period closes clearly above ~3057, any upward move is a correction, not a trend change.
📊 Stochastic RSI
There was an overheating (80+), now a downward turn.
This is a cooling signal, possible:
a sideways correction,
or another decline to support.
🧠 Scenarios
🐻 Baseline scenario (more likely)
Rejection from the downward channel.
Retest of 2925 → if it breaks:
2756
and in an extreme case, 2600.
🐂 Alternative scenario (bullish)
Breakout of 3057 + close of the 4-hour candle above.
Targets:
3225
3346
Condition: Breakout from a descending channel (not just a wick).

BTC/USDT 4H chart📉 Trend and Structure
H4 Trend: Downtrend / Downtrend Consolidation
Sequence of lower highs + lower lows from around 95k
Currently, the price is below key resistance levels; the market has not regained its upward structure.
🟩 Key Chart Levels
Resistance
94,596 – Very strong resistance (upper range zone)
91,600 – Local resistance / consolidation center
90,748 – Flip level (former support → resistance)
Support
88,385 – Short-term support (already tested)
85,226 – Current price reaction zone
83,596 – Key structural support
80,646 – Last line of defense (if 83.6k falls)
📊 RSI (14)
RSI ~40–45 → Lack of strength Buyers
No bullish divergence
RSI has not returned above 50 → trend remains bearish
📉 Stochastic RSI
Recently in the overbought zone → downward trend
This confirms a correction/further weakness
No confirmation of an upward impulse
🧠 What does price action say?
Last candle: strong upward rejection
No follow-through after bounces
Any upward breakout is sold
📌 Scenarios
🔴 Baseline scenario (more likely)
Consolidation / further decline to:
83,600
and with market weakness even 80,600
Shorts have an advantage below 88,400
🟢 Alternative scenario (bullish)
Conditions:
H4 close above 88,400
Then breakout and hold at 90,700
Only then:
Targets: 91,600 → 94,600
Without this = only corrections in a downtrend

BTC/USD 4H Chart🔎 Market Structure (4H)
Medium-term trend: still up, but clearly weakening
Price has broken out of the local uptrend channel (black line broken)
Currently, we have a downward impulse + attempted demand reaction
This looks like a distribution → SL breakout → seeking demand lower
🧱 Key Levels (from your chart)
🟢 Resistance (now selling)
89,255 – first local resistance (now S/R flip)
91,857 – strong resistance, previous consolidation
93,713 – supply zone / last LH
94,700–95,000 – very strong resistance (high range)
👉 Until we return and close the 4H period above 91.8k, longs are counter-trend
🔴 Support (most important)
87,621 – currently being tested / very important
84,216 – key HTF support (must-hold for bulls)
81,308
77,820 – deep range low
📉 Momentum & price action
Last candle: strong decline + long lower wick
= demand reaction, but no confirmation
No 4H HH/HL structure yet
This looks like a dead cat bounce or a retest of the breakout
📊 Stoch RSI
Was heavily oversold
Now a sharp upward move
⚠️ But:
In downtrends, the Stoch RSI often gives false long signals
Price confirmation is needed, not just an oscillator
🧠 Scenarios (specific)
🟡 Scenario 1 – Base case (most likely)
Pullback → further decline
Bounce to 89.2k – 90k
Rejection
Down to 84.2k
Market decision there
👉 This is a textbook retest of a broken structure
🟢 Scenario 2 – Bullish (less likely, but possible)
Conditions:
4-Hour Close > 91,857
Then a retest of the high-low
Then targets:
93.7k
94.7–95k
Only above 95k does the full uptrend resume
🔴 Scenario 3 – Bearish (if demand breaks)
If:
4-Hour Close < 87.6k
Then:
A quick move to 84.2k
Breakout = 81.3k
Extreme: 77.8k

TECHNICAL ANALYSIS – BTCUSD (4H)1. Market Structure: Ascending Channel (Orange)
The chart clearly shows an ascending trend channel – the upper and lower orange lines.
Lower Channel Support: ~$87,000
Upper Channel Resistance: ~$96,000
Medium-term trend = uptrend as long as the price remains within this channel.
2. Key Levels You Have Marked
Resistance
$94,133 – local resistance from which the price recently rejected.
$95,866 – upper boundary of the resistance zone + near-upper channel line.
$99,067 – high target upon channel breakout.
Support
$92,190 – price is currently within this zone, struggling to maintain it.
$90,757 – important intraday support; a breakout opens the way lower.
USD 88,203 – strong support, converging with the lower part of the channel.
3. Price action
Currently, I see:
Rejection from the 94.1k level, which is resistance.
Attempt to return to the center of the structure, but the candlestick is rejected from above.
The market is making a short-term lower high → slight weakening of momentum.
4. Stoch RSI
Stoch RSI (4h):
The lines are in a downward trend from the upper levels, meaning a short-term correction is just beginning.
There is no signal for an upward reversal yet → momentum favors a move to lower support levels.
⭐ 5. Scenarios for the next hours/1–2 days
BULLISH (if BTC maintains 92k–90.7k)
Condition: No break below $90,757
Potential moves:
Consolidation at 92k–91k
Stoch RSI begins to curve upward
Attack:
$94,133
$95,866 (upper channel resistance)
Target:
→ $96,000
→ possible test of $99,000 with a strong breakout
BEARISH (if BTC breaks $90,757 down)
This is a key level. If it breaks:
A quick decline to $88,203
High probability of a retest of the lower channel line (~87k)
This still won't destroy the uptrend, but it will open the door to buying lower.

MY THOUGHTS ON USD/JPYIn my analysis of USD/JPY on the 4HR CHART, This currency pair is moving BEARISHLY to the next level of resistance at price of $114.302. In this analysis, I used the Fib and Trendline Analysis. OANDA:USDJPY

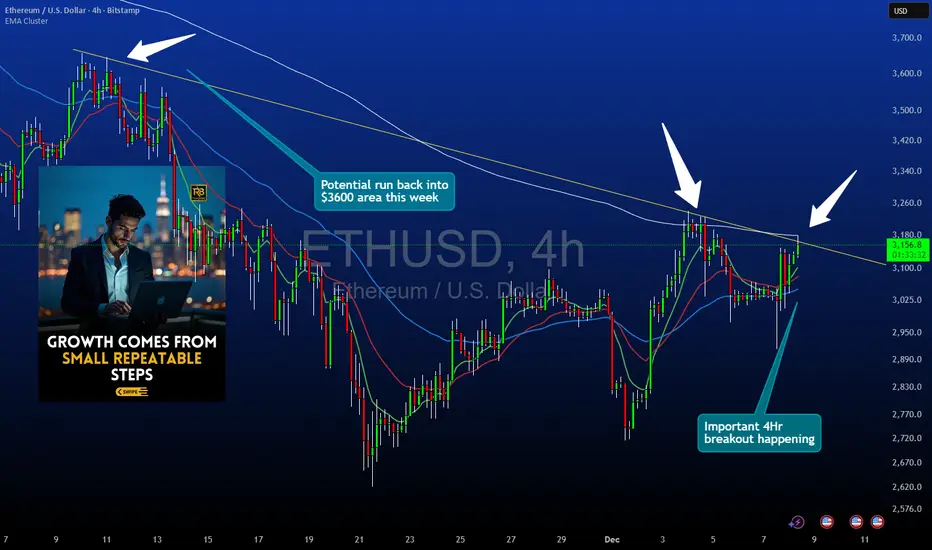
Ethereum 4HR Structure UpdateThis idea focuses on Ethereum on the 4 hour chart.
Price is approaching a descending trendline that has acted as dynamic resistance. A break and confirmed close above this trendline is required before considering any long setups.
Key Levels and Structure
• Primary focus is the descending trendline that has capped every recent bounce
• A full candle close above the trendline is essential before any entry is planned
• The upside reference area for this idea is near 3600 where prior reactions occurred
• Invalidations sit below 2950 which would represent a break beneath the recent structural base
Entry Logic
This setup is based on confirmation rather than anticipation.
• No entries should be taken while price remains under the trendline
• A strong bullish close outside the trendline is needed
• Weak closes or wicks through the trendline without body confirmation do not qualify
• The idea is only valid once the trendline is clearly violated on a closing basis
Why the Close Matters
Closing outside the trendline shows that market participants have accepted price above the descending structure rather than briefly testing it. This helps filter false breaks and reduces reliance on intrabar volatility.
Risk Parameters
Stops would be referenced below 2950 since a move under that area would indicate failure to hold recent structural support. The 3600 region is used as the first upside reference point based on previous reactions on the 4 hour chart.
Notes
This idea evaluates structural behavior and does not forecast future performance. Users should confirm levels and apply their own risk management plan before taking any trade.
BTC/USDT 4H Chart 🔍 MARKET STRUCTURE
The chart shows a broad ascending channel in which BTC has been moving for several days:
Lower trend support: ~$87,500 – $88,000
Upper trend line: ~$94,500 – $95,000
The price has clearly rebounded from around $89,200, an important demand level.
📈 KEY LEVELS
Support
USD 89,284 – local support from which a rebound occurred
USD 87,804 – the next, much stronger support level consistent with the trendline
Resistance
USD 91,466 – currently being tested
USD 94,141 – key resistance and the upper band of the channel
📊 CHART SITUATION (4 hours)
1. Price action
The price has made a strong upward impulse from support at USD 89,280.
It is currently reaching local resistance at USD 91,450 – USD 91,700.
If this level is broken, the target is USD 94,000 – USD 94,500.
If it fails, a pullback to USD 90,200/USD 89,300 can be expected.
📉 MACD
Your MACD shows:
Bullish crossover – buy signal.
The histogram changes from red to green → momentum is increasing.
The curves are diverging, confirming the strength of the move.
This indicates that the short-term trend is turning bullish.
📌 TWO TRADING SCENARIOS
🟢 BULLISH Scenario (more likely)
Condition: H4 candle breakout and close above USD 91,700.
Targets:
TP1 → USD 92,800 – USD 93,200
TP2 → USD 94,000 – USD 94,500 (upper channel)
Stop-loss (if you were going long):
below USD 90,500
Safer below USD 89,280
MACD confirms this scenario.
🔴 BEARISH Scenario
Condition: rejection of USD 91,700 and a close below USD 90,500.
Targets:
TP1 → USD 89,300
TP2 → USD 87,800 (key trendline)
A drop to USD 87,800 would be an ideal place for large players to buy again.

BTC 4H Chart Review1. Market Structure: Rising Channel (Upward Wedge / Rising Channel)
The chart clearly shows that BTC is moving within an ascending channel, with:
the upper boundary around USD 95,000–95,500,
the lower boundary currently reaching USD 86,500–87,000.
This is a potentially exhausting formation, and lower breakouts are often dynamic.
2. Current Situation: Rebound from the upper band and Stoch RSI overbought → decline
The price has stopped exactly at the upper resistance of the channel and has begun a correction.
This is typical behavior – the market usually returns to the middle or lower edge of the channel.
Stoch RSI on 4H – has made a strong reversal from the overbought zone
→ a signal for a short-term correction has already been generated.
3. Support Levels (most important):
🔴 USD 90,500–90,000
A very important zone – previous resistance ⇒ now support.
Breakout = increased risk of a deeper breakout.
🔴 USD 88,500–88,000
A strong demand level for the 4-hour period, also aligned with the MA and local lows.
🔴 USD 86,500–87,000
The lower band of the channel – the most likely place for buyers to become active.
4. Resistance Levels:
🟢 USD 94,800
Previous local high – a breakout will be bullish.
🟢 USD 98,000–98,900
Strong resistance on the chart, likely target after a breakout of the channel to the upside.
5. Scenarios for the coming hours:
📉 Correction scenario (more likely based on the Stoch RSI)
The price could fall to one of the following zones:
92,000 → test in progress
90,500–90,000 USD → main market decision level
If it loses 90,000 → a move to 88,500–88,000 is natural.
Deeper correction: test of the lower channel line – ~86,500 USD.
In this scenario, we remain in an uptrend unless the channel breaks below.
📈 Uptrend scenario
The current decline could only be:
a local correction,
a retest of the previous demand zone.
Uptrend condition:
➡️ 4-hour candlestick retracement and close above ~94,000 USD.
Then the target:
94,800
95,500
and after the channel breakout → $98,000–$99,000

BTC/USDT 4H Chart Review🧭 1. Main Market Structure
The chart shows:
A broad downward channel that has been in place since the end of October.
The price bounced off the upper line of the channel, made a local upward impulse (orange trend line), and then broke it, returning back towards the lower regions of the channel.
➡️ This means that the dominant trend is still downward, and upward bounces are corrections.
🧨 2. Current Chart Situation
BTC has broken through:
the local uptrend (orange line)
fell below the 88,500–89,000 zone (green)
is heading towards further support levels
Currently, the price looks like a typical retest of the broken structure and a continuation of the decline.
🟩 3. Key Price Levels (S/R)
Resistance (upper – green):
91,600 – 92,000 – key level, a breakout would negate the local downtrend
95,000 – 97,500 – upper range of the descending channel
Support (lower – red):
85,300 – 85,800 – local support (price is currently reacting here)
83,000 – 83,100 – strong horizontal support
79,800 – strong support, historically strong in this timeframe
76,600
75,000 – lower band of a potential drop + near the lower boundary of the channel
➡️ The most logical downside targets are 83,000 and 79,800.
📉 4. Descending Channel (black) (lines)
The price has rebounded from the upper range of the channel and is heading towards the lower range.
The middle line of the channel has been broken down → a signal of trend continuation.
The lower boundary of the channel indicates a potential low around 75,000–78,000.
🔄 5. Stoch RSI
Currently oversold in the oversold zone, it is starting to curve upwards.
In a downtrend, long signals are weaker, but a short-term rebound is possible.
🧭 6. Scenarios
📉 Bearish scenario (more likely)
Technical rebound to 88,500 – 89,000
Rejection from this zone → continued decline
Targets:
83,000
79,800
Extremes: 76,000 – 75,000
➡️ This scenario is consistent with the trend and a rebound from the upper channel.

BNB/USDT ANALYSIS - 4H interval🔶 1. Current Trend and Market Structure
The chart shows:
A clear short-term uptrend – the price is respecting the ascending yellow trend line.
An increase after a bounce from the SMA 50 (green).
However, there are still no new higher highs – the market is consolidating between 888–910.
➡️ Short-term trend: up
➡️ Medium-term trend: neutral/consolidation
🟩 2. Key Support/Resistance Levels
Resistance:
910–912 USDT – currently a key resistance, tested multiple times.
930–935 USDT – local higher resistance (green zone on your chart).
957–960 USDT – stronger resistance from D1 (blue SMA95 visible in the screenshot).
Supports:
USDT 889–893 – local support and the current battleground.
USDT 871 – SMA 50 + previous swing low.
USDT 849 – powerful support from the HTF.
USDT 837 – the final “lifeline” of the bullish structure.
📈 3. Indicators (MACD, RSI)
MACD
MACD > 0 – positive.
The MACD line is starting to point upwards → a signal of bullish momentum.
No divergence.
➡️ MACD supports the bullish scenario.
RSI
RSI ~59 – a healthy zone, far from overbought.
RSI breaks the local downtrend → increasing buyer strength.
➡️ RSI confirms the bullish trend.
🟧 4. Key Price Action Now
The price is currently approaching resistance at 910–912 USDT and simultaneously touching the local trend line.
This is the market's decision point.
A breakout → opens the way to 930–935.
A rejection → a return to 889, and below 871.

TCS: SMA 200 for long positionHello traders,
The stock we are going to watch is $NSE:TCS. This stock is related to IT sector. This stock is mostly moving in an upward direction. Currently, it is taking some additional support of SMA200 in 4h time frame. This stock can shoot upwards at anytime.
If you're a option trader, consider buying the premium which is having the liquidity. Consider exiting near 4100 to protect your profits.
Thanks & regards,
Alpha Trading Station

TECHNICAL ANALYSIS – BTC (4H)📉
1. Main trend – still down
I see a clear downward trend channel (yellow lines) on the chart. The price is moving in the lower half of the channel, which means that supply pressure is still dominant.
2. Rebound, but under strong resistance
The recent upside breakout looks more like a correction in a downtrend than a reversal.
The closest resistance levels I see on the chart:
94,500 – 95,000 → EMA + local level
96,000 – 96,500 → next EMA
98,000 – 99,000 → key level where the SMAs are located
Until BTC breaks above 96,500–97,000, there's no way a sustained trend reversal will occur.
3. Current Reaction at the SMA/EMA
The price touched the red moving average (SMA?) but was rejected—a classic reaction in a downtrend.
This signals:
a lack of buying power,
a predominance of supply in the 93,300–94,500 area.
4. Support Levels I See
At the bottom, you have specific lines that make sense:
89,900–90,000 → key support
89,500 → marked level
87,600–86,500 → lower part of the channel + previous bounce
If BTC loses 89,500, a move to the 87,000–86,500 area is very likely.
5. MACD – early, but cautious signal
The MACD has started to move up, but:
there is no clear crossover yet,
the histogram is weak.
Interpretation:
The rebound continues, but there is no confirmation of a trend change.
6. RSI – slightly bullish, but neutral
RSI ~49, so:
it is not oversold,
it is not overbought,
there is room for both a further rebound and a decline.
The RSI does not provide a strong directional signal.
📌 Summary – what looks most realistic?
Baseline scenario (60% chance): continued decline
Price will rebound to:
94,000–95,000,
possibly to the upper band of the channel (95–96K),
and be rejected → a decline to 89,500, and then 87,000–86,500.
Bullish scenario (40%): breakout of the channel
We need to see:
a 4-hour candle close above 96,500,
preferably a retest and hold,
only then can we talk about a trend reversal and a move towards 98,500–100,000.
📈 Market assessment (neutral–bearish)
Everything indicates that we are only in a correction within the descending channel. Until BTC breaks ~96.5K, the advantage is on the bears' side.

BTC/USD 4H chart 🧭 1️⃣ Market structure
• We see a clear upward channel (black trend lines) - the price has been moving within it for several days/weeks.
• Current price: ~USD 101,630, which is just above the lower border of the channel (dynamic support).
• Latest high: ~$107,360 - this is local resistance.
• Final low: ~$99,000 - this is key psychological and technical support.
➡️ Medium-term trend: still upwards, but currently in a downward correction wave 📉 3️⃣ Technical indicators
🔸 Stochastic RSI (bottom panel)
• Both components (blue and orange lines) are close to the oversold zone (<20).
• This is a signal that sellers may be losing momentum, and a rebound from the lower support is possible in the coming hours.
⸻
⚖️ 4️⃣ Short-term scenarios (4H – 1D)
🟢 Bull scenario (probability around 60%)
• The rate remains above USD 101,400 (lower border of the channel).
• Stochastic RSI begins to rebound → buy signal.
• Potential move up to:
• USD 103,900 (first target)
• USD 105,900 (second target)
• USD 107,300 (main resistance)
➡️ Scenario invalidation: 4H candle close below USD 101,000.
⸻
🔴 Bear scenario (probability approx. 40%)
• Breakout of the USD 101,000 level with a 4H close below.
• Decline to $99,000-99,200 zone (major support).
• If this support breaks, next goals:
• $97,800
• $95,000
⸻
📊 5️⃣ Technical signal (4H)
➡️ Decision Zone: $101,000-$101,800
➡️ Technical signal: possible short-term rebound (RSI oversold, close to channel support).
➡️ Confirmation: 4H candle closing above USD 102,000 with volume - then a chance of a move to USD 104-106k.

ETH/USDT 4H CHART REVIEW🔍 Overall market structure
• Ethereum is moving in a descending triangle/converging channel (yellow trend lines).
• The upper trend line acts as strong resistance (~$4,000-$4,150).
• The lower trend line (rising) provides key support around ~$3,730-$3,750.
⸻
📊 Key levels
Resistances:
• $3,875 – local resistance, where the price rebounded several times.
• $3,990 – another resistance resulting from the yellow trend line.
• $4,143 – main resistance in the breakout zone of the formation (potential target after breaking the downtrend).
Support:
• $3,808 – short-term support.
• $3,733 – important level within the formation (lower yellow trendline).
• $3,637 – strong support that should not be broken while maintaining bullish sentiment.
⸻
📈 Indicators
MACD:
• MACD and signal lines are close to each other - no clear momentum.
• Histogram decreases → possible short-term weakness or consolidation.
RSI:
• RSI indicator around 45–50 → neutral, with no clear advantage of buyers or sellers.
• No divergence, but potential for a rebound if RSI drops to ~40 and rebounds.

BTC/USDT Short-Term 4H Review Chart🧩 Market Structure
After a strong decline, the price has rebounded, creating a local uptrend (marked with the orange trend line).
The price has currently broken through the uptrend from below, which is the first sign of bullish weakening.
The current candle is testing this line from below—a classic trendline retracement (potential pullback).
📉 Support and Resistance Levels
From the chart:
Resistance (green lines):
113.868 USDT — key high.
111.240 USDT — strong resistance (previous local high).
109.133 USDT — currently being tested from below (confluence with the trendline).
Support (red lines):
107.524 USDT — first support.
105.253 USDT — lower support, a boundary for maintaining the higher low structure.
103,582 USDT — key support, below which the upward structure will be negated.
🔍 Volume
Increasing volume is visible on the red candles — selling dominated the trend breakout.
The last green candle has a large lower wick and slightly higher volume — a signal of a possible defensive reaction from the bulls, but without confirmation of continuation.
📊 Stochastic RSI (oscillator)
Located in the oversold zone (around 20).
The %K line is starting to curve slightly upward — it could signal a short-term rebound, but until there's a crossover and confirmation, this is only an early signal.
📈 Scenarios
✅ Bullish:
If BTC rebounds and closes the candle above 109,100 USDT, it will be a false breakout of the trend and a possible upward move towards 111,200–113,800 USDT.
Support to be maintained: 107,500 USDT.
❌ Bearish:
If the price remains below the trendline and 109,000 USDT, and then breaks above 107,500 USDT, the path opens to:
105,200 USDT, and then
103,500 USDT (strong support and potential buy zone).
⚙️ Summary
Short-term trend: neutral → slightly downward (after the trendline breakout).
Key level to watch: 109,100 USDT (retest trendline).
Potential support: 107,500 → 105,200 → 103,500.
Momentum (Stoch RSI): A bullish rebound is possible, but confirmation is lacking.
