Great Wins on WTI💰 Celebrating two great wins on WTI in June! But let me clarify, I'm not chasing streaks—I focus on proper setups. Let's dive into the current situation for WTI, aka US Oil.
📈 The market is testing the support line on the weekly chart. While some traders see it as strong support and anticipate buying opportunities, multiple retests increase the likelihood of a break. That's why my highest priority is shorting WTI and monitoring key levels.
⏰ On the 4-hourly chart, I'm cautious about shorting at the Bearish 5-0 pattern. If I spot an RSI divergence, my perspective may change.
⬇️ Instead, I'm patiently waiting for the Bearish Shark Pattern at 72.03 for a shorting opportunity.
⏱️ On the 1-hourly chart, if you're seeking a buying opportunity, watch for a confirmed candlestick pattern on the Bullish Bat setup at 69.61.
📊 Share your trade plan for WTI! What's your top investment product?
5-0 Pattern

Luna Classic: Bearish 5-0 on the Daily LUNC if Breaking Below the 89 Day EMA while showing MACD Bearish Divergence on the Daily after Two very weak Attempted Rallies towards the PCZ of a Potential Bearish 5-0 and now it looks to recover the gaps below the sub one-ten-thousandths level.
I thimnk it Could go as low as 47 Millionths but i will mostly be targetting the zone between 72-55-millionths

Correlation Matters No More
For the longest time, I've been saying that the correlations between the currency pairs have been weakened.
Traders have asked me why I have NZDJPY and NZDUSD in my portfolio. Doesn't it move in the same direction?
Over the years, these correlated pairs move pretty differently. And recently, the WTI and Gold have no longer moved in an inverse relationship.
So yeah, I'm treating them as their own.
Although both the 4-hourly and 1-hourly charts show buying opportunities through a potential Bullish Bat Pattern and a Bullish Shark Pattern, I'm more interested in waiting for a shorting opportunity on the 5-0 Pattern.
What's your take on the NZDUSD?

42K local top ?Hi
I'm long since 25K.
I'm looking for this bearish pattern (5-0) for more consolidation till end of year.
If price hit level of 42K, i will close my long and go short to target 32K / 25.5K / 21K
I hope many sh....-coins will sink to clean the market

$ANY: Momentum Shifting Spring and Bullish SharkANY looks to be springging off an also support level that aligns with the 1.618 Fibonacci Extension of a Log Scale Bullish Shark while at the same time the RSI seems to be shifting it's momentum into the Bullish Control Zone; Hold these levels long Enough and it could rise up to the 50% Retrace up at around 2 dollars.

Expect a pullbackOverall Analysis on EURUSD is still on a Bearish Move; however, this week, I expect a substantial pullback(bullish movement on the EURUSD off the lower timeframe.
If you are looking for a buying opportunity, wait for the Bullish 5-0 Pattern to be completed as early as 1.0723.

Trading within the 2 zonesThis could be interesting!
If you are looking to short, you have a Bearish Shark Pattern that has completed at 174.50, you could wait for a pull back off the lower timeframe, like the 15-minutes chart or the 8-range bar chart for a shorting opportunity.
Alternatively, you could wait for a buying opportunity on the 5-0pattern a 100pips later at 173.50.
Which trade would you take? And why?
comment down below.

One last SHOT!!If you have been following, you should know I've been getting into the long position on the AUDCAD to take a ride on the Weekly Chart's 5-0 Pattern.
If you aren't familiar with harmonic patterns,it means I'm looking to have a ride on the bullish trade from a mid to long-term perspective. (approx 2mths)
There are a couple of attempts, and not all went to loss, it fact I'm pretty profitable with these trading ideas when I didn't get what I want.
This is probably the last or the last is near for these trading ideas to work.
I'd engaged the bullish bat pattern on the 4-hourly chart and see if it able to take me to my final target for the 5-0 patterns and beyond.

Unveiling the Ultimate Trading Setup of the Week: Don't Miss OutAs some of you may recall, I've been seeking a buying opportunity on the AUDCAD for the past few weeks. My motivation for this is the Bullish 5-0 pattern setup that has formed on the Weekly Chart. I've been exploring various avenues to enter into this buying opportunity, and currently, two options are available.
Firstly, we can wait for a candlestick pattern trading setup to appear on the Bullish Gartley Pattern for a buying opportunity (left). Alternatively, a Bullish Deep Gartley Pattern on the 8 range bar chart (bottom right) could provide the trading setup for us to engage the trade.

My Bullish Bias RemainsUSDJPY Shorting Opportunity Looming, But My Bullish Bias Remains Strong
In the midst of a Type 2 Bearish Bat Pattern on the daily chart and a Bearish Shark Pattern on the 1-hourly chart, traders may be eyeing a shorting opportunity for the USDJPY. However, my bullish bias on this currency pair remains steadfast.
Rather than jumping on the bearish bandwagon, I am patiently waiting for a prime buying opportunity on the USDJPY. I'm closely monitoring a Bullish 5-0 pattern that could potentially complete at 134.71, presenting an ideal entry point for a long position. Stay tuned for further updates on this developing trade opportunity.

The Reason Behind My Strong Inclination to Buy AUDCADIf you have been keeping up with my previous analysis, you would have known that my strong interest in buying the AUDCAD is not a crazy obsession, but a well-informed decision based on market trends and patterns.
In fact, if you had engaged in the trade last week, you could have earned a substantial amount of profit, up to 139pips or approximately 1,390 USD per lot .
This week, the market will be testing the 5-0 pattern on the 1-hourly chart for the first time, which could potentially provide another opportunity to hop on this bullish trend.
By identifying the right confirmation pattern, you could take advantage of the Bullish 5-0 Pattern on the weekly chart and not miss out on this trade once again.
Don't underestimate the power of staying informed and being prepared to make strategic moves in the market.

Multiple Buying OpportunityUpon analysis, there are multiple factors that indicate a potential buying opportunity for AUDCAD.
Firstly, the bullish 5-0 pattern on the Weekly chart was identified and discussed in my previous report.
Secondly, various trading strategies have also pointed towards a buying opportunity.
For example, the 4-hourly chart shows a tested support level at 0.8954, which has been tested three times. If this support level is broken, there is a complete AB=CD Harmonic Pattern at 0.8940.
On the 1-hourly chart, a bullish deep crab pattern is observed with a retest at 0.8952, providing an opportunity for traders. The only factor that could deter this trade is a potential market gap when the market opens on Monday.
Nonetheless, with the aforementioned indicators in place, a potential buying opportunity for AUDCAD presents itself.

This could be a Big OneAs an experienced trader, I've identified a significant trading opportunity that I'm eager to execute. My strategy involves a buy and hold approach, with a focus on minimizing risk and maximizing rewards. Rather than setting multiple targets, I prefer to extend my targets and remain flexible based on the market conditions and candlestick patterns that emerge.
This comprehensive trading plan enables me to minimize the time I spend monitoring the markets, allowing me to focus on other important aspects of my work. With a keen eye for detail and a commitment to achieving my goals, I'm excited to see what the future holds for this trade.

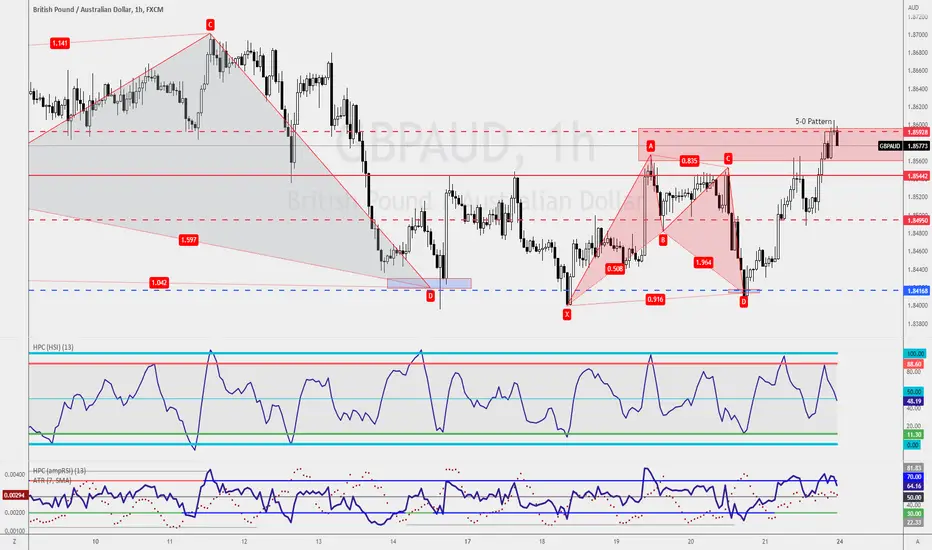
Seize the Day: Aggressive Traders Can Short GBPAUD with 5-0Despite the current bullish trend in GBPAUD, the market is showing signs of a potential shorting opportunity on the 5-0 pattern, with the 3-bar reversal pattern. This presents a unique trading opportunity for aggressive traders to engage in a short-term trade at 1.8577, with a stop loss set above 1.8605 and an appropriate buffer.
What's even more enticing about this setup is when executed correctly, this trade could yield a profit factor of 2, making it a potentially lucrative opportunity for savvy traders looking to capitalize on market movements.
The Big ShortThe Big Short came in on the Weekly Chart with a Triple Top RSI Divergence. Currently, there isn't any opportunity for me to engage in the shorting opportunity.
While waiting for a tested strategy like the Bearish 5-0pattern to appear, I will look out for other trading opportunity like buying on the demand zone or a Bullish Shark Pattern in taking the conservative targets.

It's ONLY ONE Direction, DOWN!!The Bearish 5-0Pattern has been confirmed at 82.91; traders who want to jump in for a shorting opportunity could wait for a retest at that level.
Alternatively, you could wait for a Triple Top Retest at 83.22 on the 1-hourly chart(left).

IEX Trend cycle theory EIX can possible 81.50
as its base on trend cycle theory as mentioned in above chart
as per own parameter with cycle theory 81.50 highly chances to come fare value 45 60.

Unique Combo Trade!Probably a trade that has a 20:1 Reward: Risk trading setup.
On the 1-hourly chart, we have a Bullish Gartley Pattern that comes inline with our 4-hourly chart, the Bullish Shark Pattern retest and on the Weekly Chart, the Bullish 5-0 Patterns.
If I stretch the final target to the Weekly Chart completion, the returns would be stunning, but this trade could take up to 2 months or a month.
Furthermore, we might have more stop-out then hitting the target in 1 U-Turn, so it is NOT a trade for traders who won't afford to have their trade stop out multiple times and still looking for buying opportunities.
If you are thinking of risking more than you usually do; or you plan to follow the trade blindly; or even worst, not putting your stop-loss, this is not the trade for you.
As a full-time trader, I've been very patient to look for the trade that suits my profile and the trade I'm planning.
I couldn't stress any more by saying trading is more like a business than a job. It is not the number of deals you do, but the 1 you chose to take and the 1 you chose not to participate.

BTCUSD: Local Bullish 5-0 at the 200 SMAOn the hourly we are at the 200 SMA and near the local 61.8% retracement, if we can catch a bounce from here i do think that will be the moment BTC truly goes for the breakout of this range and make a run towards $31,800

It's NOT Perfect, but would you say NO to 309pips of Profits? It's NOT Perfect, but would you say NO to 309pips of Profit Potential?
The Bearish 5-0 Patterns has completed on the Daily Chart(right), the doji candle looks great for aggressive trader for a shorting opportunity, the RSI didn't went overbought, and that cause this setup to be not as perfect as we want it to be.
Alternative ways to engage the trade, is to wait for the market to retest at 83.60 on the 4-hourly chart or the 1-hourly chart. When the retest happens, it will produce an RSI Divergence that allow us to engage the trade, that produce a Lower Risk with a Higher Returns.
If you are looking for a buying opportunity, 82.60 is the level you can wait for a retest of support or a double bottom with RSi Divergence.
Which side of the trade would you choose?
Shorting opportunity or Longing opportunity?

368pips x2 profit potentialIt depends if you are looking for a buying or selling opportunity on the EURJPY. Traders who are looking for shorting opportunities could wait for a Bearish Shark Pattern retest at 145.31.
If you are looking for a buying opportunity, the Bullish Gartley Pattern on the Trendline that completes at around 141.63for a buying.
If you have no issues trading both ends, you wait for the confirmation to happen before engaging the trade that will bring 368pips of potential profits trading on both sides.

NZDUSD 121 BEARISH PATTERN NZDUSD has formed an advance harmonics patterns 121 bearish.
The price is trading near the EL: 0.62468.
ST: 0.62666
Target1:
62% XA: 0.59710
79% XA: 0.59283
TARGET2:
127% XA: 0.58026
162% XA: 0.57128

AUDCAD 121 BEARISH AUDCAD has formed an advance harmonics pattern 121 bearish on on its hourly chart.
The price is trading below the EL: 0.91759.
ST: 0.91961
Target1:
62% XA: 0.89729
79% XA: 0.89377
TARGET2:
127% XA:0.88360
162% XA: 0.87638
