Usd/jpy - 5-0 formation
I mentioned the possibility of a bullish cypher in the long term, but before that, the price may show an upward movement again with a 5-0 in the smaller time frame.
5-0 Pattern

5-0 RetardioBullish 5-0 pattern forming on the 4 hour chart for Retardio. Looks like a good risk/reward trade to me.

IPL Investore Property Limited Thought it was interesting to see a Nen star pattern on a monthly chart
Personally the upside is not large enough as there are a couple of fundamental negatives which are putting me off this stock
Posting out of interest only...

$GCT Boom or bust time?NASDAQ:GCT I decided to become a creator today for NASDAQ:GCT #TradingView, which it is an avocatiton to foresee and extrapolate a price.

⚠️Bitcoin Analysis (Mix of Patterns)⚠️👋Hi, everyone. First of all, I apologize for the chart being busy, but I think all the lines and zones are needed to better understand it.
🏃♂️Bitcoin is moving in two descending channels : a ⚫️Black Descending Channel⚫️ and a 🟣Purple Descending Channel🟣 . Also, it is currently moving in the 🔴 Resistance zone($66,050-$64,520) 🔴and near the Upper line of the descending channel and 50_SMA(Daily) and Time Reversal Zone(TRZ) .
📈If we want to look at the chart from the point of view of the Classical and Harmonic patterns , Bitcoin has succeeded in breaking the lower line of the Symmetrical Triangle Pattern , and it seems that a Bearish 5-0 Harmonic Pattern is forming near the upper line of the 🟣descending channel🟣.
💡Before concluding, let's take a look at the Market Cap USDT Dominance% (USDT.D%) chart.
💡 USDT.D% broke the 🔴 Resistance zone(4.72%-4.53%) 🔴 as I expected and is currently pulling back to this zone, the pullback structure seems to be forming with the Falling Wedge Pattern , I expect USDT.D% to rising again and this It will cause another decline in the cryptocurrency market .👇
🔔I expect Bitcoin to start falling again based on the above explanation.
❗️⚠️Note⚠️❗️: An important point you should always remember is capital management and lack of greed.
Bitcoin Analyze ( BTCUSDT ), 4-hour time frame ⏰.
Do not forget to put Stop loss for your positions (For every position you want to open).
Please follow your strategy; this is just my Idea, and I will gladly see your ideas in this post.
Please do not forget the ✅' like '✅ button 🙏😊 & Share it with your friends; thanks, and Trade safe.


SPX500USD: Bullish 5-0 at 0.618 RetraceThe SPX is trading within a Broadening Top near the Demand Line of the pattern, aligning with the 0.618 Retrace after developing a Bullish 5-0 Harmonic Wave Structure. If it plays out we should get a Higher High within the range, which could take us to the Fibonacci Extensions above the current highs.

Buying Opportunity on NZDUSDThis week, I'm eyeing a potential buying opportunity on NZDUSD, and here's my trade plan:
1. Bullish 5-0 Pattern on Weekly Chart: The NZDUSD is currently in the zone of the Bullish 5-0 Pattern on the Weekly Chart, signaling a potential buying opportunity.
2. 4-hourly Chart Setup: The 4-hourly chart presents a candlestick confirmation at the Potential Reversal Zone (PRZ), indicating a possible entry point for long positions.
3. Confirmation with 3-Bar Reversal: Despite the candlestick confirmation at the PRZ, I remain cautious and will wait for further confirmation. I'm looking for a 3-bar reversal pattern, where the next candle closes above 0.6089 and retests the level at 0.6083 before considering a buying opportunity.
By waiting for the 3-bar reversal pattern, I aim to ensure a stronger confirmation of the bullish momentum before entering the trade.
What are your thoughts on NZDUSD? Feel free to share your trade plans and insights below!
Wishing everyone profitable trading ahead!

Bullish Flag Breakout and 5-0 Pattern Combo TradeI'm closely monitoring AUDCAD, and here's why:
1. Bullish Flag Channel Breakout on 4-hourly chart:
- AUDCAD has recently broken out of a Bullish Flag Channel on the 4-hourly chart.
- This breakout suggests a potential bullish move in the market.
2. 5-0 Pattern on 1-hourly chart at 0.8829:
- Waiting for a retracement, I'm eyeing the completion of a 5-0 Pattern at 0.8829 on the 1-hourly chart for a potential long opportunity.
- Utilizing a combo trade strategy to manage risk and enhance returns.
This combo trade involves combining the breakout from the Bullish Flag Channel with a harmonic pattern entry on a lower timeframe (1-hourly 5-0 pattern).
Feel free to share your insights and trade plans for AUDCAD in the comments below. Check the chart link for a visual representation.

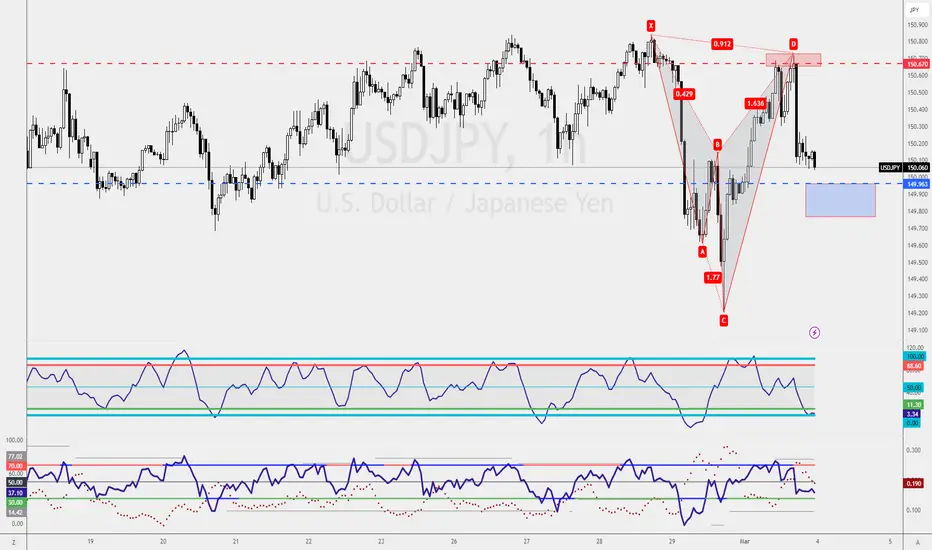
Bullish 5-0 vs. Type2 Bearish Shark PatternIf you're navigating conflicting biases, here are two potential setups:
1. Bullish 5-0 Pattern at 149.96: Long Opportunity
- Engage in a long position based on the completion of the Bullish 5-0 pattern at 149.96.
- This pattern signals a bullish bias, providing an opportunity for traders expecting an upward move.
2. Type2 Bearish Shark Pattern at 150.67: Shorting Opportunity
- Consider a short position if the Type2 Bearish Shark Pattern completes at 150.67.
- This approach factors in the possibility of Fed rate cuts in June, potentially influencing a bearish move.
As a trader, it's essential to weigh the conflicting signals and align your strategy with your overarching market outlook. Feel free to share your preferences and insights on these setups.
NVDA Is Forming 0-5 Pattern .the detail is shown in the above Idea.
I made this Idea based on Candlestick Analysis and Harmonic pattern.
Bullish 5-0 pattern should be formed, not necessarily mandatory, in the downtrend so it can have a much higher success rate.
Bullish 5-0 is drawn as Shark pattern, but with additional C-D leg. That means you can first have the Shark pattern on the chart and then wait until C-D retracement happens.
B-C leg has two Fibonnaci rules so you can watch two bullish scenarios. The final difference will be in your profit target because the C point has two different lengths.
You need to watch out that the A-B leg is reciprocal to C-D leg, AB=CD, to pattern be valid.

ATOMUSD: Holding 21-week SMA After Completion of Bullish SharkATOMUSD has Double Bottomed on the weekly timeframe at the PCZ of a Bullish Shark and is now holding above the 21-week SMA. If it holds, we could see ATOM breakout of the range and rise all the way up to a 61.8% retrace. From there it may then turn into a Bearish 5-0 but for now I'm just focused on the potential Bullish move upwards.
The Shark pattern here is admittedly controversial given the fact the C leg is an equal high to the A leg rather than being a higher high, but I think it is something that this pattern could maybe get away with.


A Promising Bearish SetupI'm keeping a keen eye on what I consider a golden trading opportunity - the retest of a Bearish Shark Pattern coinciding with a higher timeframe Type2 Bearish 5-0 Pattern on the Daily Chart.
My plan is to wait for a retest around 184.15, aiming for a shorting opportunity.
What's your take on GBPJPY? Any strategies or thoughts you'd like to share?

HarmonicsHarmonic Bat Pattern
Harmonic ButterFly Pattern
Harmonic Crab Pattern
Shark & 5-0 Pattern
www.geocities.ws

$COIN: Bullish 5-0 into a Golden CrossCoinbase near the range lows has formed a Bullish 5-0 and has also back tested a Golden Cross as support; as a result, Coinbase should soon be targeting a range breakout that takes it to the 0.382

Shorting Caution and Planning for Long-Term Opportunities!GBPUSD exhibits a stronger bullish trend compared to EURUSD, despite a Weaker Bull Trading setup. I'm eyeing a buying opportunity for a longer-term trade strategy.
However, this doesn't deter me from considering a Bearish Shark Trading setup on the 1-hourly chart as a potential shorter-term play. Simultaneously, I'm patiently awaiting the formation of a Bullish 5-0 Pattern, which could serve as an entry point for a longer-term buying opportunity.
What's your take or strategy on GBPUSD? Share your insights below!

WTICOUSD: Ranging at the 200-Week SMAMy overall sentiment for Oil remains Bearish, though my midterm sentiment has been Bullish, as I think WTICOUSD needs to come back up to revisit some of the highs above 100 and face one last rejection from those levels before I will be fully convinced of oil making significantly lower lows.
For the time being, Oil has dumped below last week's range but is now sitting at the 200-week SMA and at the old 50% retrace which could be where this Bearish Shark starts to act as a Bullish 5-0 which would demand an attempt of a Higher High. I think that it could attempt to hold out here as the RSI is oversold and the MACD is printing potential Hidden Bullish Divergence. My first target for oil, if this level holds is up, is at around $80, then $100, then $114, then $140-155. I will be looking for signs of weakness to potentially take profits at all of those levels on the way up. In the meantime, I will look at Oil Related Stocks: BP, BPT, DVN, IMPP and a few more. The XLE and XOP Exchange Traded Funds may provide a more general way to get exposure.

Navigating Contrasting Trends for Optimal Trading StrategiesThe 4-hourly chart showcases a compelling Bullish 5-0 Pattern retest accompanied by an RSI Divergence.
While direct engagement in the trade is an option, I'm personally inclined towards waiting for a Bullish Gartley Pattern retest around 186.39.
This approach significantly mitigates risk while still allowing for favorable profit potential—a strategy centered on lower risk for higher returns.
What are your thoughts or trade plans on this opportunity?
Feel free to share below!

IT'S A SIMPLE. EFFECTIVE. STRATEGY -FOR BITCOIN[ ]
The "Potential Reversal Zone", or PRZ
-is between the 50% fibonacci retracement level at $32.66K
and
the 66% retracement level at $41.51K.
-----THE WHY---------
[ ]
((the primary tool in all of my technical anaylsis is the use of the "golden ratio" in forecasting 'pivots" as the 61.8% retracement level is the primary guide.
The 50% and 66% fibonnaci retracement levels are simply the most favorable deviations from the 61.8% level that accurately reflect market volatility]]
Synonyms of "Pivot" = "bounces", "bottom", "top", "reversals". ALL of these words essentially entail the same definition -that which the price at which the previous trend, either bullish, or bearish -changes.]]
____________________
FORECAST:
IF
THE BEARISH 5-0 HARMONIC IS VALID:
THEN
We will see a price reversal, or PIVOT between the prices of $32.66K and $41.151K.
THEREFORE -
Price can go as high as $41.5K over the next 173 days (another +6% from current $36.472K)
IF PRICE IS REJECTED AT, or BELOW $41.151K:
Bearish Harmonic 5-0 pattern IS VALID with bearish price targets beginning at:
1) ** AGGGRESSIVE $19950K *OPEN CME GAP
2) **** LIMIT BUY - $17.042K
- - IF PRICE PUSHES BELOW $15.479K - -
** 3) $12.292K
**** 4) $9.615K *OPEN CME GAP
*** 5) $6.66K
*** 6) $4.44K
***** 7) $3.55K *OPEN CME GAP
IF THE BEARISH 5-0 HARMONIC PATTERN IS NOT VALID:
THEN
Price may reach $58.19K -or HIGHER.
THEREFORE -
IF
PRICE BREAKS ABOVE $41.151K IN THE NEXT 173 days
THEN
We will adjust positions to BULLISH and adjust our strategy accordingly.
IF
PRICE IS REJECTED AT, or BELOW $41.151K in the next 173 days
THEN
We will look for LIMIT ORDER FILLS at the 4 targets above.
IT'S A SIMPLE. EFFECTIVE. STRATEGY.
IT ONLY WORKS BECAUSE WE REMAIN RELATIVELY DYNAMIC -AND SO FAR, BITCOIN HAS OUTPERFORMED EVERY SINGLE INVESTIBLE ASSET SINCE 2010.
_____________________
IT IS TIME TO START PLANNING FOR THE NEXT BULLISH WAVE. THAT MEANS SETTING YOUR ORDERS WHEN CONFIRMATIONS ARE MET -AND HAVING THE DISCIPLINE TO WAIT FOR THE NEXT FILL.
**ALL SCRIPTS ARE MY OWN EXCEPT FOR THE RSI. IF YOU WOULD LIKE TO TRY THEM OUT, LET ME KNOW BELOW**

ARB(ARBUSDT): BUYING OPPORTUNITY ↪️ARB is engaged in Elliott wave surge following the formation of a twin base pattern on a daily timeframe. Analyzing from a 4H TF I spotted a bearish flag which suggest further downward move to the daily horizontal support.
Following a prolonged 5-wave surge, the ABC adjustment has commenced. Currently, the motion is in wave 3, and I anticipate its conclusion in wave 4. It is in this range that I will acquire extended positions...Tarde safely 👍✅

Potential Bearish Moves Amidst Bullish SignalsNZDJPY presents an intriguing trading setup despite being a counter-trend trade.
The observation of a Bearish Shark Pattern checkback on the Weekly Chart , along with RSI Divergence , adds weight to this potential trade opportunity.
I'm waiting for a shorting opportunity on lower timeframes and, specifically, looking for a 1-1 trading setup , intending to initiate a short position at 91.99 on the Daily Chart.
Trade plans can vary among traders based on their analysis and risk management approach.
What's your trade plan or strategy for NZDJPY?
Feel free to share your insights or plans below!

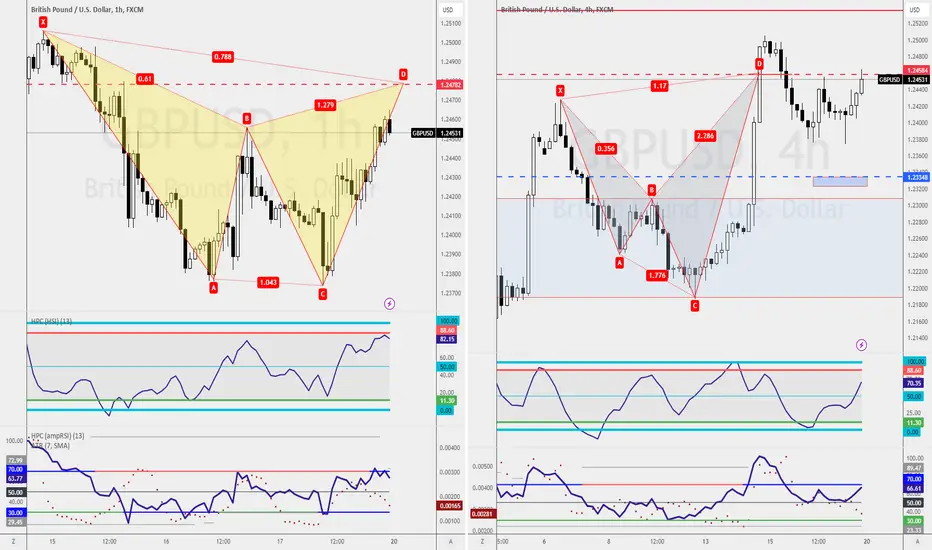
Navigating Contrasting Trading OpportunitiesGBPUSD is currently indicating a Weaker Bull Trend . Here are potential strategies for different trading approaches:
Trend Traders :
Waiting for a Bullish 5-0 Pattern on the 4-hourly chart at 1.2334 might align with your strategy as it complements the ongoing bullish trend.
Counter-Trend Traders :
For those seeking a counter-trend opportunity, a shorting opportunity off the Bearish Shark Pattern retest at 1.2453 or the completion of a Bearish Gartley Pattern on the 1-hourly chart at 1.2478 could be of interest.
Each approach carries its risks and rewards. Ensure to align these strategies with your risk tolerance and trading plan. Best of luck with your trading decisions!