The 50MA Buy/Sell Line still acting as strong support!We plummeted and after we started to go below the 50% green fib line that was officially creating a new lower low/lower high which is often a signal to short. Had youd one so and follwoed it all the way down to the 50MA you would have come out quite a bit ahead. I would mark this idea as a short if it was being updated at that point...but now we have been already been caught once again by the strong support of the Buy/Sell line(50MA in orange). If we close the current 4 hour candle above that line I will be optimistic of a chance at continuing the upside if we close below it it could mean more downside so for now this idea will have to remain neutral, with if any bias being slightly toward a reversal back to the upside. What's interesting this time around is many altcoins actually did well while btc plummeted this go around which hasn't happened in a long while.
50ma

50MA on 4 hour chart acting as very strong support; Ever since we confirmed the last bear flag breakout the price action was sent down and has tested the 50MA multiple times on the last couple candles....but has only wicked below it maintaining very strong support....however as you can see the projected drop target from the bear flag breakout has not yet been met....what's more we are now essentially forming another bear flag with the bottom trendline of the new bear flag being the 50MA(buy/sell line) It's very possible the 50MA may hold support and prevent us from further downside but the probability is higher that we will dip below it and drop to whatever the projected price drop target of the current bear flag before we completely rebound...possibly leading toe ven more downside....best to play it safe and see how this currently developing bear flag plays out though before making any big decisions....however there seems to be a lot of FUD in the news headlines these days which often gives you a heads up more downside is on the way as well as an impending death cross of the 50MA and 200MA on the day chart in the net few coming days...bot indicitave of more downside...probability favors a continued drop...but at least for now due to the strong support of the 50MA this idea will remain neutral....it will also remain not financial advice....thanks for reading.

Predicting downtrend length & the subsequent buy opportunity.Here, I am using a 4H LTC/BTC chart to estimate the length of a potential downtrend, beginning at this point in time. If the trend holds, I see a turnaround & buying opportunity at the point of confluence between the trend-line and major VPVR support @ 0.017 BTC in early April.

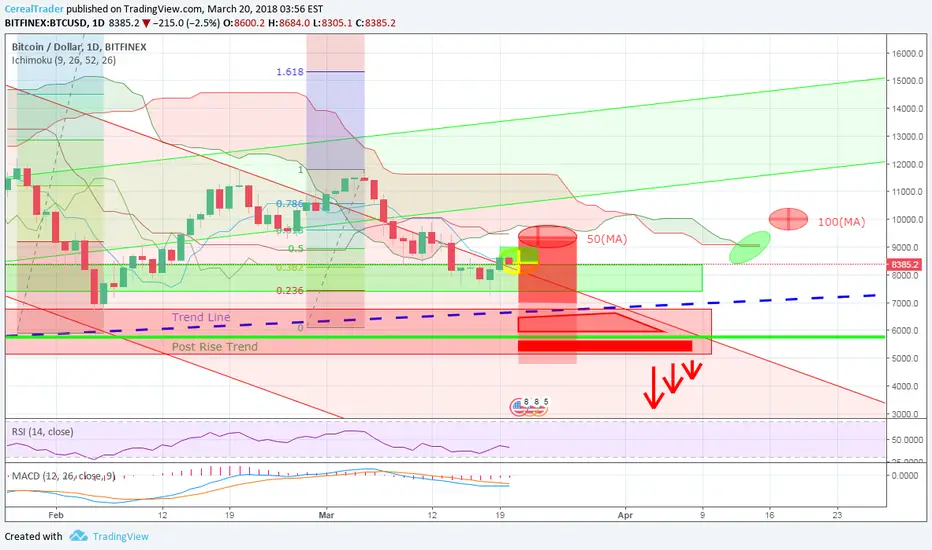
Bitcoin - Support Zones/Future DirectionSupport analysis of both, the previous parabolic move as well as the current slow decline, show areas of support aligning along with impending doom. Currently holding 0.382 Fibonacci, the area below is vulnerable up until the Trend line . At this point an expected rise from the Golden cross approaching within hours (200MA crossing below the 50MA, indicating short term trend upwards) on the 1hr chart along with the longer Weekly chart indicating doom with both the 50(MA) as well as the 100(MA) impending Death Cross (50MA crossing below the 200MA, indicating large waterfall drop, or couple days of trending downwards)
The necessity that these cross-overs must occur before uptrend can be established is nothing new although the alignment/strength of both the 50(MA) and the 100(MA) cross-over within close proximity, along the 1hr Golden Cross reversing within this time period to another Death cross, could be a triple threat add pressure to trend downwards.
Ichimoku cloud squeezing price range under $10,000 and seems it would take rally similar to last to enable support from this indicator, with volume stagnate, only rising in bursts, realistically 2 times lower then needed, this is currently not possible.
RSI currently holding 40, small room with the golden cross approaching before being oversold. Would expect large rise in RSI and price to rebound after/during cross leading along trend line .
MACD would need to see some price action to cross-over into positive rise, this could be possible if the Golden Cross plays out, could push price higher during this short few day period although the divergence appears to be slowing.
Taking a monetary view of the market, USDT trading was very slowly being replaced with real USD, volume non-existent, FUD, the only "support" channel seems to be along the trend line . this would increase pressure on this support in such a weak and reactive market and only a sharp incline in price would allow Investors back in (Investors don't buy dips, they buy on the rise).
Underlining the whole situation is trader's don't believe in the underlying technology (if anything only bitcoin -2.58% ), announcements are being held back until dust settles and constant FUD right at critical support levels. Although the technology hasn't changed from last year, the market has. It seems all indicators are at lowish levels in which a market with "legs" would jump on, but carnivorous nature of this risk built market would ensure lows are low and highs are high.
Short term trade, wait for the indicators to mature and align with others, a rise should be expected within the Golden Cross up until the Death Cross comes into play (50MA expected 23rd March), Alt coin funds will be indicator of reversal, flowing heavily into tether (USDT) and BTC at this stage. One indicator that I don't have access to is if large enough funds have a Fake-out planned...and can pull it off...and hit stop losses. A correction would still occur, long term hold your ground, the market will survive.
BTC -2.62% is seeing some tough times , so I should write this:
***Education Purposes only***
Breakout is confirmed 50 SMA now acting as support!Exciting to see we have confirmed the breakout of the wedge....wedge breakouts tend to have very reliable projected target prices and this one goes all the way to $10335. I have updated my chart to show which fib lines, trendlines, and moving averages can act as support or resistance along the way. The only EMA I have on the chart currently is the T-Line...simply because the Simple moving averages have been acting much more like support/resistance lately than the eponential moving averages have....if that changes I will certainly include any pertinent EMAs on my chart. For now we can see that what was strong resistance at the 50MA (aka the buy sell line) has now flipped to support. This is huge because if we can continue to ahve the 50 MA act as support for 4 more 4 hr candle closes that will mean we are back in a buyers market. Considering the reliability of wedge patterns achieving their breakout targets I'd say that is a high probability, but still something to keep an eye on if for some reason it dips back below it. the current resistance is a previous green fib line as you can see. It bounced down off it and then confirmed the 50MA as support after bouncing up off the 50MA a very very good sign. I'd say keep an eye on the 50MA to make sure it maintains support...if so I have a feeling the green fib line will be resistance for a very temporary amount of time and we will be back in the buyers market soon....suggesting that the second quarter of this year will hopefully be a bullish one.

Hammer ShortSSl recently has been recovering from a market correction. However, even tho the coppock curve and the ADX are saying this could be a buy, I see a hammer candlestick forming. This shows that the prior trend could be changing. So, I put a short position below the 50 MA. Also, volume seems to be decreasing.

ETH showing short-term bullish traitsThis idea is following the same pattern as my previous XRP idea. If the lagging span of the Ichimoku cloud pierces the thin cloud above then we would have a clear buy signal. Futhermore the VWAP has crossed the 50 MA quite aggressively.

Potential short term 20% increase for XRPWhile XRP remains predominantly bearish, we have a few signals here that could indicate a short-term uptrend to our previous resistance (red-dotted line). We have pierced the Ichimoku cloud and the VWAP (pink line) has crossed over the 50 MA (blue line). If the lagging span of the Ichimoku cloud (black line circled in yellow) pierces the Ichimoku cloud then we would have a strong bullish signal for a potential 20% increase in the price of XRP.

General electric breakout failedThe stock is trading below 50 day moving average. Failed to breakout. The technical bottom is 15.25 dollar. When bullish on the stock buy more on that level. Short term the stock can decline more.

BTCUSD 4hr- H&S pattern - Possibly trend reversal?Spotted a Head and Shoulders pattern on the 4 hr chart BTCUSD. The neckline of the H&S pattern crosses close to the 50 day MA. Can we expect a short term downtrend if the trend crosses these levels? Leave your thoughts below. If you have any comments/questions please let me know.
Cheers.

Earnings ReportThe 200 MA is providing resistance and the 50 MA is providing support. This is most likely a flag pattern, and the ADX is about to go green so will most likely be bullish. But, since the earnings report is coming out today, I have chosen to create buy and sell orders.Also, due to past earning reports the volatility is very high so I expect the same to happen.


Carnival ready to bounce ?This stock loves bouncing up from 50 day moving average. RSI is just above 50 and Money flow seems like going to reverse back to buying territory - did not stay much in selling really.


Another Flag PatternGBP/EUR has formed a flag pattern and to see its seems we have a false breakout, thats represented by the RSI showing overbought, so I would wait for the rebound to lower trendline for support and then the partial rise will be complete and then its a buy. Also the 50 MA is showing support and has crossed over with the 20 MA.Also, the price is in a separate area in the pitchfork

Bounce on the 200MAGdx has a tendency to bounce on the 200MA. I am presently holding GDX shares and I will probably switch my position to DUST if the stock goes below the 50MA. If the stock is capable of crossing the 200MA, it would be a great bullish indicator.


Bullish & Low RiskWatch for LNTH to make a move back up to past resistance around $9.70, Price has just broken above the resistance line and it is also just above the 50ma which has been acting as a dynamic support for quite some time. Also volume has been increasing, MACD looks like it is soon going to crossover and the Squeeze Momentum indicator is currently bullish.

Momentum Squeeze Play, GSVIncreasing volume, MACD crossover, broken resistance line, squeeze momentum on. Price target of $3.00, for just under an 18% return.

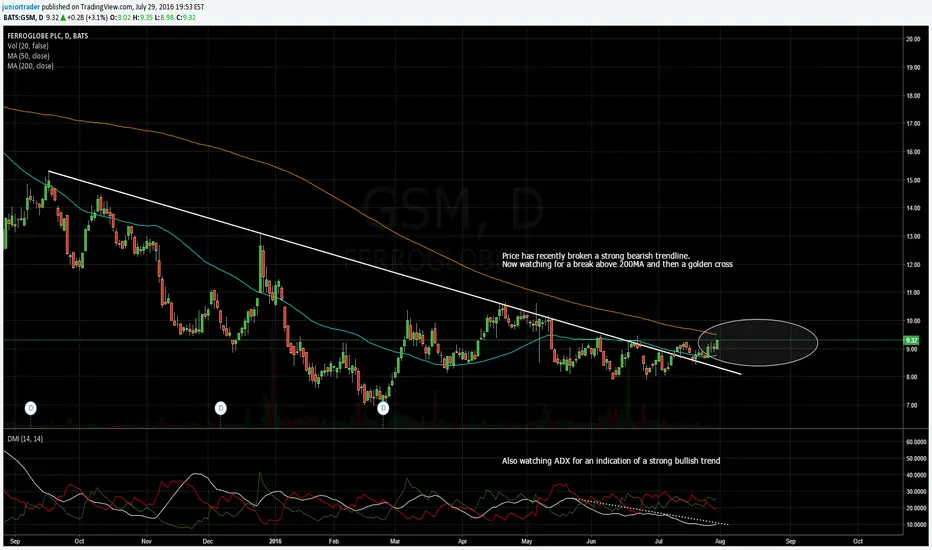
Watching for Golden CrossA long term bearish trendline has recently been broken, and the downtrend seems to be reversing. Watching for price to break above the 200MA to go long and then wait for a golden cross.