$BTC Halfway to Confirming Bear Market - BUT There's HOPE!BAD NEWS ⚠️
₿ITCOIN IS HALFWAY THERE TO CONFIRMING A NEW BEAR MARKET.
🚨 This is the first-time that CRYPTOCAP:BTC has closed below the 50WMA since Dec ’21. We all know what happened after that.
🚨 If we get another consecutive Weekly close below the 50WMA, I am confident this is the beginning of the end for the bull market.
If that happens, I will discuss my new exit strategy and POI in another post.
GOOD NEWS 🙌
⚡️ The long-awaited DEATH CROSS on the Daily Chart has occurred, which historically marks the bottom.
⚡️ PA is sitting at VERY strong support on the .618 Fib
⚡️ RSI is LOWER than the Liberation Day madness Feb - April ’25, and the lowest it’s been since July ’22.
NOTE: This is the smallest correction we’ve had all bull market.
TL;DR 📖
✅ This is the absolute best time to buy CRYPTOCAP:BTC
✅ Just make sure to follow the 50WMA invalidation if you do take a position.
Remember, we have the most insanely bullish macro / regulatory backdrop in crypto’s entire existence.
MY THOUGHTS 🤓
🐂 I truly believe this is the biggest fake-out we’ve ever seen. There’s way too many tailwinds on the horizon to let this go to waste.
🐂 Bulls need a $10k Mega-Candle THIS WEEK to reclaim momentum.
🐂 I’m still a MEGA-BULL until my thesis is invalidated.
⛔️ We could get one last flush ~$92k to grab CME Gap liquidity.
🛑 DO NOT USE LEVERAGE EVER AGAIN!!!
50wma

$BTC Tests 50WMA - Line in the Sand for BullsIt’s only Tuesday, everyone RELAX.
Still a long way from a Weekly Close below the 50WMA for CRYPTOCAP:BTC
RSI is at the Liberation Day lows, and you know what happened after that.
Note: this is the shallowest pullback to the 50WMA all cycle for bitcoin, which is in-line with late cycle behavior.
In other words, this correction won’t take as long either.
We could see a Weekly Close below the 50WMA to shake everyone out, then have a bullish engulfing the following week to send us to the long awaited promise land we call VALHALLA.
In the small chance bulls cannot recover from this, below is a link to my 50WMA analysis that I put out back in February before everyone ran with my work.
Stay vigilant folks.

$USDT.D Cycle Top Indicator HIT !A THIRD CYCLE TOP INDICATOR HAS FLASHED ⚠️
YES this chart is complete chicken scratch, and my mad scientist approach to viewing different trends in USDT Dominance.
I’ve had this November 3rd intersection mapped out for years now.
NO, I do not believe we are anywhere close to the top (see pinned tweet).
Bulls REALLY need to step up big this week with a rally.
We cannot afford two consecutive weeks above 5.5%

$SOL Bullish Engulfing Weekly CloseSolana is looking good here 👍🏽
Reclaimed the 50WMA and closed above the 50% Gann Level.
Note the Bullish Engulfing candle for the Weekly Close.
However CRYPTOCAP:SOL Still trading within the DANGER ZONE ⚠️
Need these next couple weeks to close outside of this POI.
You can see the Liberation Day lower trendline still remains intact for support and we had the Bullish Cross a few weeks ago on the 20 / 50 WMA 🤓

$BTC.D Death Cross Has Occurred! The Signal on ₿itcoin Dominance We've Been Waiting All Cycle For 🔥
20 / 50 WMA Death Cross has officially occurred on CRYPTOCAP:BTC.D
So close to Alt Season I can taste it 😋

$TOTAL Crypto Market Cap Fights Back w/ Weekly CloseCrypto CRYPTOCAP:TOTAL Market Cap looking similar to CRYPTOCAP:BTC
Thankfully did not close outside of the Danger Zone.
It's absolutely imperative that Bulls reclaim the 20WMA this week and close above the .236 Fib
Losing the 20WMA has signaled more downside / sideways chop historically.
Hopefully this is just a fake-out, otherwise the 50% Gann will be retested alongside the 50WMA.

$BTC Bulls Fight Back With Weekly CloseNot sure how I continue to amaze myself, but I do 🤓
Notice how those MMs respected my DANGER ZONE POI to the dollar?
Thankfully CRYPTOCAP:BTC did not close the Week outside the DZ.
The battle between Bulls and Bears is FIERCE 🔥
Bulls cannot afford another blue weekly close.
If so, the 50WMA retest ~102k will be inevitable.
Bulls need to reclaim and close this upcoming week above the 20WMA and .236 Fib
A close ~$116k would be super bullish.
That should be enough ammo to spark the long awaited parabola that UpTober has historically brought us.

$TOTAL Crypto Market Cap Incredible Weekly Close!The Crypto CRYPTOCAP:TOTAL Market Cap showed incredible resilience after nuking ~25% this week.
Closed the Week just below the WEMA9 at $3.86T, but above the .236 Fib and stayed cleared of the DANGER ZONE ⚠️
Notice that wick all the way down to the 50WMA where it bounced literally right off the trendline breakout I drew back in July.
Those MMs are really respecting my TA these days huh 🤓
This dump covered the 50% Gann level retrace, which give me confluence that the hardest part of behind us.
Bears weren't even able to form a Bearish Engulfing candle.
Next up Bulls need to reclaim the 9WEMA as mentioned in the previous post.

$BTC.D Head and Shoulders + Death CrossWho remembers when I put out this Head & Shoulders idea for CRYPTOCAP:BTC.D September 2nd? 🤓
On the verge of the 20 / 50 WMA Death Cross ☠️
This SHOULD be the top for ₿itcoin Dominance.
Does not mean that it won't float around here for a few weeks tho 🫶

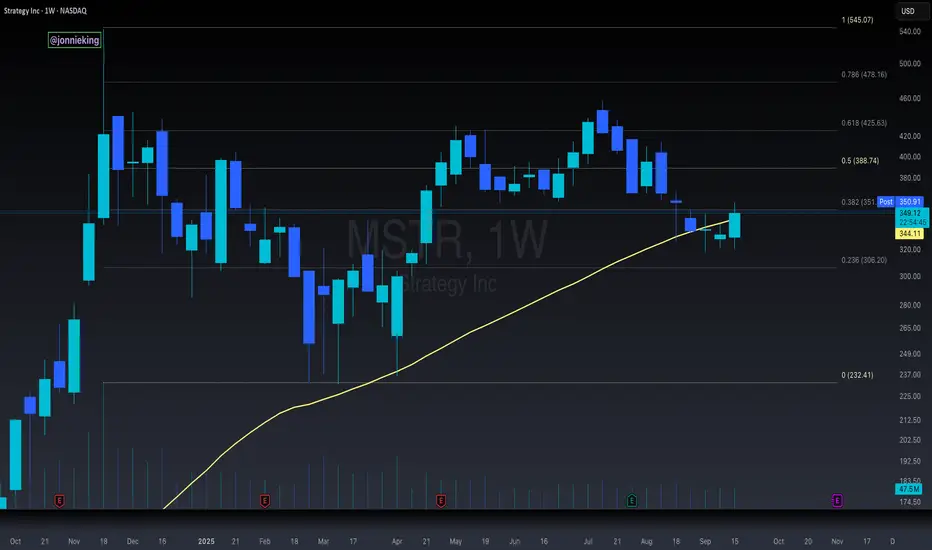
$MSTR 6th Consecutive Week BELOW 50WMAStill kinda shocked at how terrible the NASDAQ:MSTR chart is.
Working on its 6th consecutive week below the 50WMA.
What a complete disaster @saylor
If PA doesn't start showing some real strength here off the .236 Fib then down to ~$235 she blow 🌬️

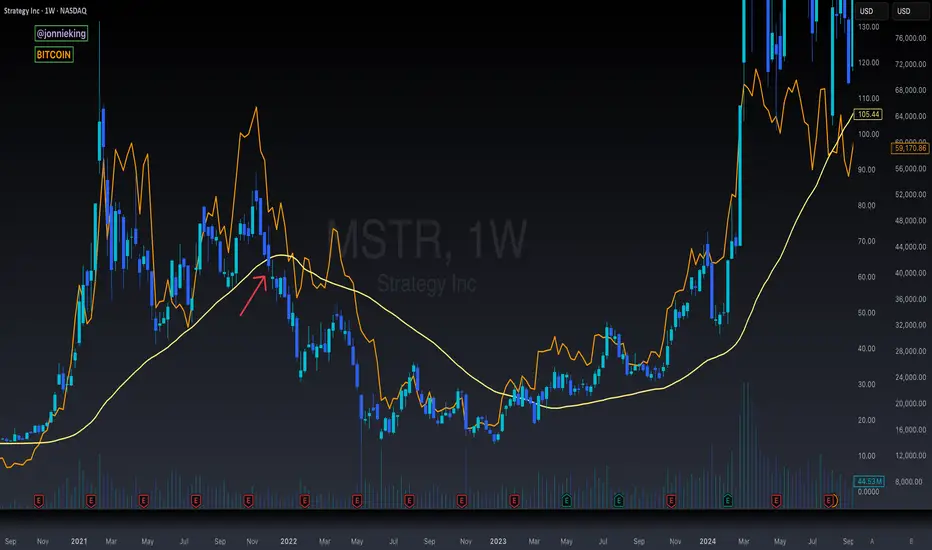
$MSTR Falling Below the 50WMA in 2021 Bull Market Here's a look at last cycle where NASDAQ:MSTR trading under the 50WMA for several weeks led to the CRYPTOCAP:BTC bear market.
The reason why this was so significant last cycle is because they were responsible for such a large share of BTC buy pressure.
This cycle we have lots of other treasury companies, with many more to come, as well as ETFs of course, so I'm not as concerned with this PA.
$MSTR Must Close This Week Above the 50WMA Or Else...The MicroStrategy chart is the only top signal that is somewhat cause for concern at the current moment.
You can see NASDAQ:MSTR has closed the past several weeks below the 50WMA, which signaled the start of the bear market last cycle.
Having said that, it has had a bullish rally this week and is trading above the 50WMA once again.
MSTR must close the week above this level, otherwise the stock could be in for a much deeper correction, which could negatively affect CRYPTOCAP:BTC in October.
Where have you heard that October prediction before?
Coincidence? 🥸
$TOTAL3 / $BTC More Confirmation for Alt Season RotationWe already saw this pattern play out with CRYPTOCAP:TOTAL2 / CRYPTOCAP:BTC and now we have it with CRYPTOCAP:TOTAL3 confirming the rotation into smaller caps.
4th consecutive Weekly close above the 50WMA.
Notice the Bullish Divergence with the RSI.
I’d like to see a few closes above this trend line for added confirmation, but I’m confident we’ve changed the trend.
Note CRYPTOCAP:OTHERS is not there yet, hence why its BTC -> ETH -> Large Caps (SOL).
$SOL / $BTC 50WMA Reclaimed - Alt Season Confirmed!Ladies and Gentlemen,
CRYPTOCAP:SOL / CRYPTOCAP:BTC has officially closed the Week above the 50WMA and is back within the POI.
Double bottom confirmed this setup.
Along with the longest cup and handle I’ve ever seen lol.
Let the rotation for Alt Season begin!

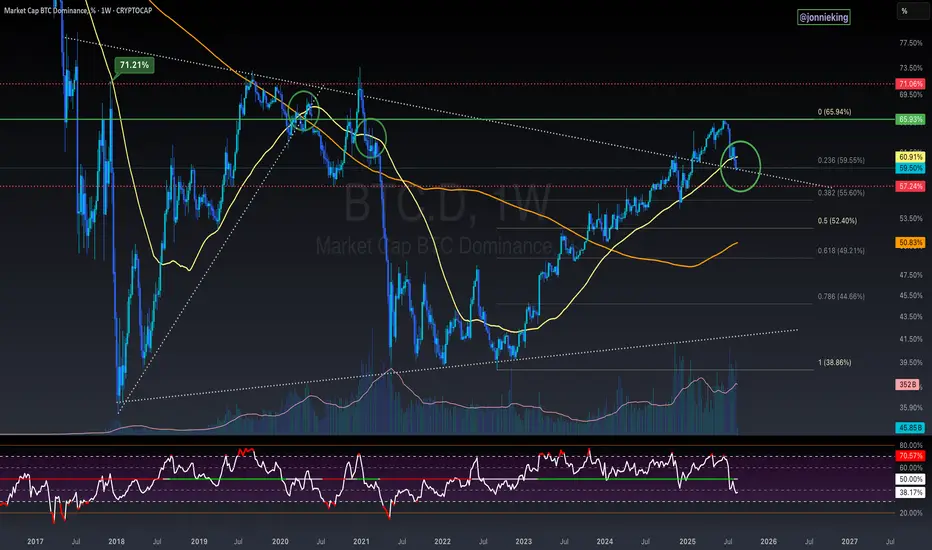
$BTC.D Head and Shoulders Topple to 42%If I were a betting man, this is what the future holds for ₿itcoin Dominance.
A head and shoulders pattern could very well be the eventual topple for CRYPTOCAP:BTC.D as we see it make it's way down to 42% which follows previous cycle's trend.
the RSI shows room for correction back up for one more push.
the 20WMA bearish crossing below the 50WMA will be the nail in the coffin.

$BTC.D On the Cusp Of Breaking Down - What to WatchNothing too exciting to write home about for the Weekly Closes today, but ₿itcoin Dominance shows continued signs of breaking down, now closing the past 2 weeks below the 50WMA.
If we get one more decisive Weekly close beneath it, I’d feel very comfortable calling Alt Season.
BTC.D is also on the verge of breaking below the 8-year trendline, as well as the 0.236 Fib which would add confluence.
Breaking below 57% should seal the deal.
This will be a big week to watch.
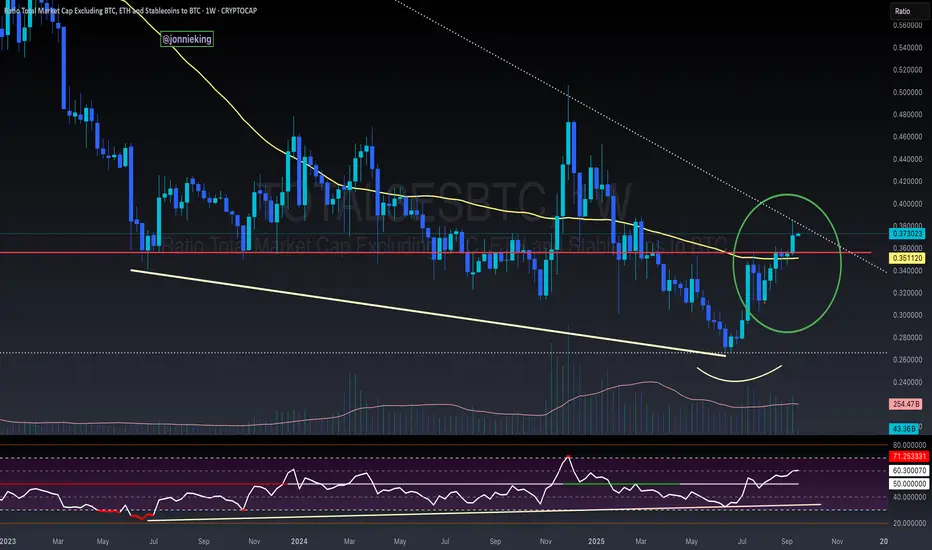
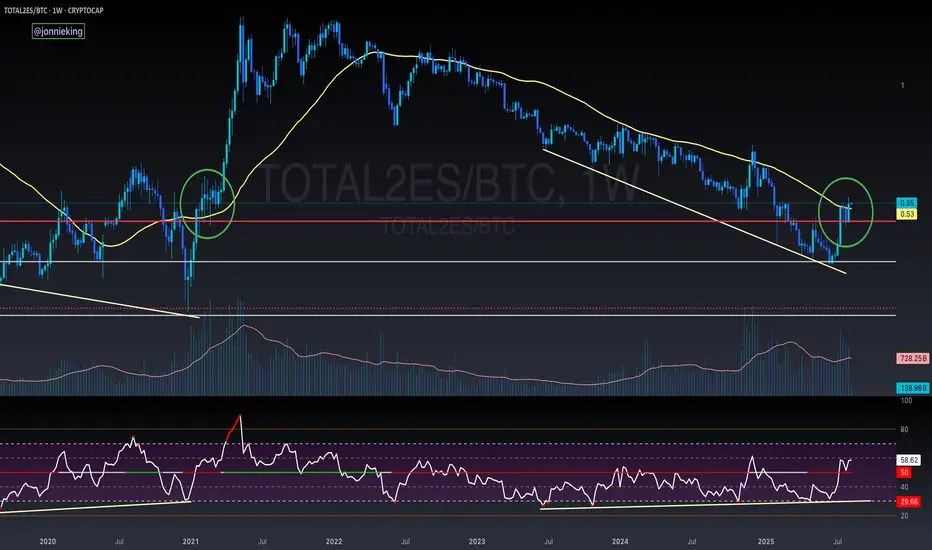
$TOTAL2ES/BTC Showing Hopes of Alt SeasonPromising Weekly Close above the WMA50 for CRYPTOCAP:TOTAL2 against CRYPTOCAP:BTC
PA needs to stay above here the next few weeks so that this does not end up like another prior fake out.
I have a feeling this will be a big week (next tweet 🤑)
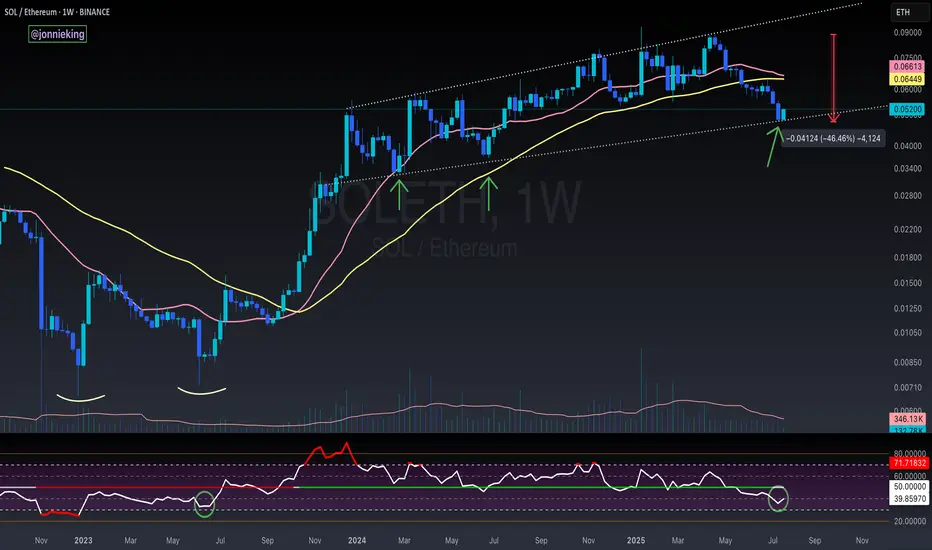
SOL / ETH - Reversal Signs FormingI suspect CRYPTOCAP:ETH has a bit more gas in the tank, but the early signs for the real Alt Season are nearing.
RSI on the weekly is nearing the June 2023 bottom which kicked off the massive bull flag formed on SOL / ETH for the next 2 years.
Still too early to call at this point tho.
Need volume to really burst through in the next week or two.
I’d also like to see BOATS:SOL close the week with a massive bullish engulfing candle.
The bearish cross on the 20 / 50WMA should mark the bottom when it occurs soon.
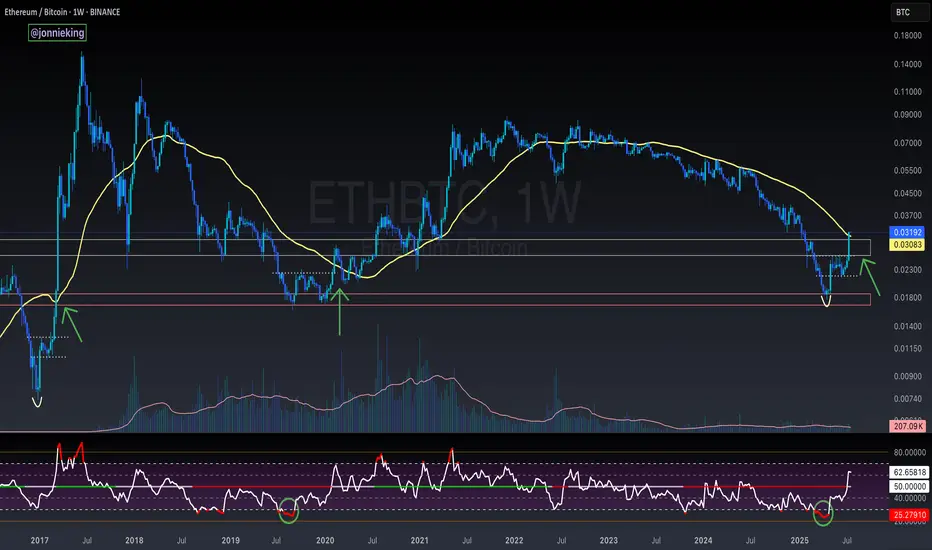
$ETH Closes Above the 50WMA - Alt Season Signal ALT SEASON ALERT 🚨
CRYPTOCAP:ETH Closed the Week ABOVE the 50WMA
Historically this has signaled the start of ALT SEASON.
*NOTE* 2020 had the pandemic hiccup.
This bottoming pattern looks very similar to the 2017 explosion.
Also the RSI matches the 2019 bottom.
Dare I call it yet bros? 🤓
SOL / ETH at Critical Inflection PointSOL / ETH loses the 50WMA.
Has been trading below it for the past 7 weeks, something we haven't seen since 2021.
Has also broken down from the 8 month bull flag / parallel channel. Retesting the key POI I've been eyeing.
HOPIUM: We've seen great rallies after CRYPTOCAP:SOL goes down ~40% vs CRYPTOCAP:ETH , which it is at now. We SHOULD see a turnaround here soon.
And I still believe SOL will greatly outperform ETH this cycle, especially when the ETF launches and Alt Season kickstarts.
Right now we're seeing a typical market cycle BTC > ETH > Large Caps > Mid Caps > Micro Caps

$SOL Bullish Engulfing On WeeklyCRYPTOCAP:SOL closes the week with a Bullish Engulfing candle.
50WMA at $170 next target to smash.

$USDT.D Cycle Top ProjectionI could see CRYPTOCAP:USDT.D playing out like this.
This November data also coincides with my BTC Cycle Thesis in November.
Lotsa other macro factors and indicators at play for a cycle top, but this lines up nicely and where I'll be taking a heavy chunk of profits.

$BTC Not Out Of The Weeds Yet - Must Break $84kIf CRYPTOCAP:BTC can break back above ~$84k then we could continue to follow my OG setup (yellow) and rip,
but since PA dumped slightly below the 50WMA it technically invalidated my inverse h & s idea.
A rejection of $84k would dump us back to ~$78k to form the right shoulder (red) and complete the setup.
nonetheless, i believe we've seen the bottom 👋
