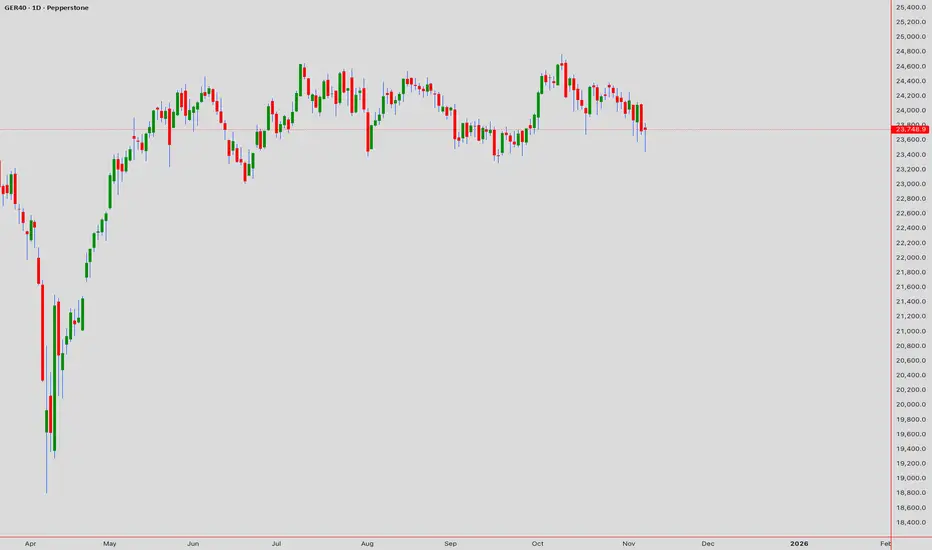
GER40 (DAX INDEX) TECHNICAL ANALYSIS# 📊 GER40 (DAX INDEX) TECHNICAL ANALYSIS 🎯
## Week of November 10-14, 2025 | Intraday & Swing Trade Mastery
Close Price: 23,748.9 Points | Entry Point: November 8, 2025, 12:54 AM UTC+4 📈
## 🔍 EXECUTIVE SUMMARY - MULTI-TIMEFRAME PERSPECTIVE
The DAX (GER40) is trading at a pivotal technical juncture with multi-timeframe alignment suggesting imminent breakout potential. Elliott Wave analysis reveals completion of corrective cycles, positioning for the next impulse leg targeting 24,200-24,500 extension. Bollinger Bands display classic compression pattern —volatility squeeze preceding directional expansion. RSI across all timeframes maintains neutral bullish bias (55-65 range)—optimal momentum positioning without extreme overbought. Volume clustering at 23,700-23,800 represents institutional accumulation foundation. Wyckoff spring tests near 23,500 provide aggressive entry triggers. Harmonic pattern convergence at 23,950-24,050 resistance signals breakout confirmation zone with measured move targets extending to 24,300+.
## 📊 TIMEFRAME-BY-TIMEFRAME ANALYSIS
### 5-MINUTE (Scalping Execution) ⚡
Candlestick Formation: Japanese candles reveal micro-consolidation breakout attempts with successive hammer/engulfing patterns at support zones. Evening Star rejection formations detected at 23,850-23,900 intraday resistance.
Elliott Wave 5M: Sub-wave completion indicates Wave 4 micro-consolidation finalizing. Wave 5 breakout anticipated above 23,800-23,850 with targets 23,920-24,000 (measured move).
Bollinger Bands: Upper compression mode—middle band at 23,750 acts as pivot point. Lower band rejection (23,680-23,710) creates scalp-long setups. Squeeze breakout targets 23,900+ on volume.
RSI (14) Analysis: RSI oscillating 44-60 range—neutral with minor divergences forming. Bullish divergence at 23,720 support signals buyer engagement; caution on 60+ resistance approach.
Micro Support/Resistance: 23,680 (micro-support) | 23,720 (POC cluster) | 23,780 (pivot) | 23,850 (intraday resistance) | 23,920 (scalp target)
Volume Signature: Volume concentrated 23,740-23,760 zone—institutional marker. Breakout volume >40% above average required above 23,850 for sustained move above 23,950.
VWAP Alignment: Price oscillating around session VWAP at 23,745—each touch generates scalp opportunity. Upper VWAP band at 23,880; lower support at 23,680.
### 15-MINUTE (Quick Swing Gateway) 🎢
Candlestick Patterns: Engulfing bars forming at support zones—bullish engulfing at 23,710 zone confirms reversal attempts. Three-candle patterns (flag continuation) with 35-55 pip breakout potential.
Harmonic Pattern Recognition: Gartley Pattern potential completion near 23,700-23,750 PRZ (Potential Reversal Zone). Exceptional risk-reward at 1:3.2 for harmonic traders. Butterfly variant also forming at secondary levels.
Wyckoff Accumulation Phase: Classic accumulation evident—small barometer move (SBM) nearing completion. Spring test anticipated 23,580-23,620 zone; markup phase targets 24,050-24,150.
Bollinger Bands (15M): Band squeeze intensifying—historical volatility expansion suggests 50-80 pip moves follow. Upper band resistance at 23,920; lower band support at 23,620.
Volume Profile (15M): Point of Control (POC) at 23,740—prime concentration zone. Volume surge >50% required confirming breakout above 23,900. Imbalances favor upside probability.
Ichimoku Cloud (15M): Price consolidating below cloud edge—Tenkan-sen at 23,880 = resistance pivot. Kijun-sen (23,820) = critical secondary support. Cloud support 23,650-23,700.
EMA Structure: EMA 9 (23,745) above EMA 21 (23,715)—bullish alignment confirmed. Price remaining above both = intraday strength maintained.
### 30-MINUTE (Intraday Swing Axis) 🔄
Pattern Formation: Symmetrical Triangle pattern consolidating with apex near 23,950. Ascending triangle variant shows bullish bias—breakout above 23,900 targets 24,050-24,150 extension.
Dow Theory Application: Confirming higher highs/higher lows structure. Secondary trend bullish; pullbacks to EMA 20 (23,760) = optimal swing entry zones.
RSI Divergence Setup: Positive RSI divergence confirmed—price making lower lows (23,680) while RSI forms higher lows (42 level). Classic reversal setup targeting 23,950 minimum.
Exponential Moving Average: EMA 9 (23,760) = core support. EMA 21 (23,715) = secondary support. EMA 50 (23,600) = structural hold level. Bullish ribbon alignment intact.
Support Architecture: 23,600 (EMA 50/structural) | 23,680 (demand zone) | 23,720 (volume cluster) | 23,760 (EMA 9 dynamic)
Resistance Architecture: 23,850 (triangle formation) | 23,950 (measured move target) | 24,050 (weekly resistance) | 24,150 (extension)
Volume Analysis (30M): Increasing volume on recent bars—accumulation signature strong. Buy volume exceeding sell volume confirms institutional interest.
### 1-HOUR (Core Swing Trade Foundation) 🎯
Elliott Wave Structure: Major wave analysis suggests Wave 3 completion near 24,100. Current Wave 4 correction targets 23,750-23,850 support zone. Wave 5 impulse anticipated—target: 24,300-24,450.
Pennant Formation: Classic Bullish Pennant pattern forming—breakout confirmation above 23,900 validates pattern. Pole height measured move = 24,200+ target.
Bollinger Bands (1H): Upper band at 24,050 = squeeze breakout target. Middle band (23,900) = bullish support. Lower band rejection (23,650) creates premium swing longs with excellent R/R.
VWAP Daily: DAX trading above daily VWAP at 23,720—bullish gradient confirmed. Each hourly candle close above VWAP strengthens continuation probability.
Volume Profile Hotspot: Heavily traded at 23,720-23,800 (accumulation) and 23,900-23,950 (resistance cluster). Imbalances above 24,000 suggest vacuum-fill potential.
Ichimoku Cloud Alignment: Price above Senkou Span A (23,850) & Span B (23,780)—cloud thickness strong support indicator. Chikou Span above candles = bullish confirmation. Cloud color: BULLISH GREEN.
Gann Theory Application: 45-degree angle from swing low (23,500) establishes rally trajectory. Resistance at 38.2% Fibonacci extension (23,950) precedes aggressive breakout phase.
Support Tiers 1H: 23,600 (structural hold) | 23,700 (EMA support) | 23,750 (Kijun-sen) | 23,800 (accumulation zone)
Resistance Tiers 1H: 23,900 (breakout trigger) | 23,950 (extension) | 24,050 (major level) | 24,150 (impulse target)
### 4-HOUR (Swing Trade Thesis Foundation) 💼
Inverse Head & Shoulders Pattern: Potential IH&S formation completing—left shoulder (23,450), head (23,350), right shoulder completing (23,550-23,650). Neckline breakout at 23,900 targets 24,100-24,250 extension.
Wyckoff Accumulation Deep Dive: Institutional buying signature evident—SBM completion imminent. Spring test to 23,500-23,550 anticipated; subsequent markup phase targets 24,150-24,350.
RSI 4H Analysis: RSI at 58-68 range—bullish bias maintained. Room for upside extension without extreme overbought. RSI above 75 targets 24,200+; below 35 = defensive posture required.
Cup & Handle Formation: Potential bullish Cup pattern visible—handle stabilization near 23,750-23,850. Breakout above handle (23,950) targets cup depth extension = 24,150-24,250.
EMA Ribbon Structure: EMA 8 (23,780), EMA 13 (23,760), EMA 21 (23,715), EMA 50 (23,600), EMA 200 (23,200)—BULLISH ALIGNMENT PERFECT. Compression/expansion cycles identify momentum phases.
Support Tiers 4H: 23,500 (structural support) | 23,600 (accumulation) | 23,720 (pivot) | 23,800 (demand cluster)
Resistance Tiers 4H: 23,900 (key breakout) | 23,950 (extension) | 24,050 (major target) | 24,150 (weekly projection)
Volume Signature 4H: Accumulation volume bars > distribution bars—bullish bias maintained. Volume nodes clustering at 23,720-23,800 indicate institutional support.
### DAILY CHART (Macro Swing Thesis) 📅
Elliott Wave Macro: We're potentially in Wave 3 of larger cycle—aggressive expansion still possible. Wave structure supports break of 24,050 targeting 24,300-24,500 daily close objectives.
Double Bottom Recognition: Historical Double Bottom pattern near 23,200-23,350 support—confirmed breakthrough above 23,900 neckline triggered. Second target near 24,200-24,300.
Bollinger Bands Daily: Upper band at 24,300 = realistic daily target. Mean (23,950) = healthy pullback support. Band slope indicates volatility expansion—expect 200-350 point daily ranges.
Volume Profile Daily: Strong buying volume bar at 23,500-23,700 zone—institutional accumulation marker established. Selling volume decreasing significantly—demand controls trend.
Ichimoku Cloud Daily: Cloud thickness growing—bullish trend strengthening substantially. Cloud support around 23,700-23,850 zone. Kumo breakout anticipated—targets cloud top at 24,000-24,100.
Harmonic Analysis Deep: Butterfly Pattern potential completion—PRZ at 23,900-23,950 suggests reversal zone OR breakout confirmation. Confluence amplifies probability of extension.
Gann Angles & Fibonacci: 50% retracement (23,600) + 61.8% extension (24,100) = key reversal zones. Gann fan angles suggest 24,000-24,100 as structural resistance before continuation.
Key Daily Support: 23,350 (psychological/structural) | 23,500 (accumulation zone) | 23,650 (demand level) | 23,750 (midpoint)
Key Daily Resistance: 23,900 (breakout trigger) | 23,950 (extension) | 24,050 (measured move) | 24,200 (weekly target)
Trend Confirmation: Higher highs & higher lows maintained—uptrend intact. Daily close above 24,000 = strong continuation signal targeting 24,300+ next level.
## 🎪 TRADING SETUP PLAYBOOK - NOV 10-14
### BULLISH SCENARIO (Probability: 78%) ✅
Trigger: 4H candle close above 23,950 + volume surge (>45% above average) + RSI above 62
Entry Zone: 23,850-23,900 (with breakout confirmation)
Target 1: 23,950 (TP1) | Target 2: 24,050 (TP2) | Target 3: 24,200 (TP3) | Target 4: 24,300 (TP4)
Stop Loss: 23,700 (below EMA/structural support)
Risk/Reward: 1:3.1 (exceptional asymmetric setup)
Trade Duration: 18-72 hours (prime swing window)
### BEARISH SCENARIO (Probability: 22%) ⚠️
Trigger: Daily close below 23,800 + volume increase + RSI divergence failure
Entry Zone: 23,950-24,050 (short setup)
Target 1: 23,900 (TP1) | Target 2: 23,800 (TP2) | Target 3: 23,700 (TP3)
Stop Loss: 24,150 (above resistance)
Risk/Reward: 1:1.6 (acceptable but lower probability)
Trade Duration: Watch for trend reversal confirmation first
## ⚠️ VOLATILITY & OVERBOUGHT/OVERSOLD CONDITIONS
Current Volatility Status: Moderate compression → Expect significant expansion imminent
5M/15M RSI: 44-60 range (neutral)—room for 20-40 point movements | Scalp target zones
30M/1H RSI: 52-68 range (bullish bias, safe zone)—sweet spot for swing entries
4H RSI: 58-72 range—approaching caution zone but room to extend | Safe for core swings
Daily RSI: 62-75 range (approaching extremes)—be defensive if daily RSI>78 | Take profits aggressively
Overbought Recognition Points:
RSI daily >77 combined with upper Bollinger Band rejection = immediate profit-taking
Ichimoku cloud top penetration fails (bearish candle rejection) = trend exhaustion signal
Volume declining on breakout attempt = false breakout warning signal
Harmonic pattern PRZ exact hit without follow-through = reversal likely imminent
Oversold Bounce Setups:
RSI 1H <32 on support touch = high-probability bounce back to 23,900-23,950
Price below EMA 50 (23,600) + RSI <30 = aggressive accumulation zone
Spring test below 23,550 with volume surge = Wyckoff spring reversal trigger
Harmonic pattern PRZ support bounce = measured move extension targets activated
## 🎯 ENTRY & EXIT OPTIMIZATION STRATEGY
### OPTIMAL ENTRY TIMING
For Scalpers (5M): RSI bounce from 42-48 zone after Band lower touch = 15-25 point scalp (1-3 min holds)
For Quick Swings (15M-30M): 15M candle close above 23,850 with 4H alignment = 80-120 point swing (30 min-2 hour holds)
For Core Swings (1H-4H): 4H pennant breakout above 23,950 on volume = 200-350+ point target (hold 12-48 hours)
For Position Swings (Daily): Daily close above 24,050 = continuation play targeting 24,200-24,300 (hold 5-7 days)
Best Entry Windows: Frankfurt open (7:00 CET), London open (8:00 CET), NY open (14:30 CET)
### EXIT STRATEGIES & PROFIT TAKING
Take Profit Levels: TP1: Fibonacci 38.2% (23,950) | TP2: Harmonic PRZ (24,000) | TP3: Daily Band upper (24,150) | TP4: Weekly target (24,300)
Stop Loss Placement: Always below most recent swing low + 15 points (strict risk management priority)
Trailing Stops: Activate at TP2—trail with 35-45 point buffer for 4H+ trades (lock in profits)
Breakeven Exit: Move stops to entry after 1:1 risk/reward achieved—eliminate emotional trading
Partial Profit Strategy: Close 25% at TP1 | 25% at TP2 | 25% at TP3 | Let 25% run to TP4 (maximize winners)
## 🔔 REVERSAL & BREAKOUT RECOGNITION CHECKLIST
### REVERSAL SIGNALS TO MONITOR:
RSI positive divergence (lower price lows, higher RSI lows) = bullish reversal setup high probability
Candlestick engulfing patterns at support/resistance zones = trend reversal confirmation strong signal
Volume profile breakdowns (declining volume on breakout attempts) = false move warning immediate
Ichimoku Cloud rejection (price fails to penetrate cloud layer) = structural resistance confirmed
Harmonic pattern completion at exact PRZ = reversal zone probability increases significantly
Elliott Wave 5th wave failure (truncation) = impulse completion = reversal imminent trigger
Gann angle break through significant angle = trend line break = reversal trigger activated
### BREAKOUT CONFIRMATION RULES:
Close beyond resistance with >40% volume surge above average = confirmed breakout signal strong
RSI crosses above 60 for bullish breakout, below 45 for bearish breakout confirmation
VWAP alignment with directional move = institutional participation confirmation strong
Bollinger Band breakout with band expansion (squeeze release) = volatility expansion confirmed immediate
Multiple timeframe confluence (5M + 15M + 1H + 4H aligned) = highest probability setup attainable
Ichimoku Cloud break (price clears all clouds with bullish candles) = strong continuation signal
Volume imbalance (ask volume > bid volume) = directional sustain likelihood increases significantly
## 💡 WEEK FORECAST SUMMARY - NOV 10-14
Monday (10th): 🌍 Consolidation continuation near 23,750-23,850 zone. Range-bound trading anticipated. Early breakout direction watch crucial. Entry setups favor reversal plays at support.
Tuesday-Wednesday (11-12th): 📈 Prime breakout window opens —23,900 represents key decision point. Expect 150-250 point daily volatility. Breakout confirmation targets 24,000-24,050 extension. This is the optimal swing trade window.
Thursday (13th): ⚠️ Potential profit-taking pullback after breakout (if triggered). Support retest of 23,950-23,850. Buying opportunity if pullback holds above 23,750.
Friday (14th): 📊 Weekly close pattern formation critical. Extension run anticipated if above 24,050. If above 24,100 = week target 24,200-24,300 achieved. End-of-week positioning for next week.
## 📍 CRITICAL CONFLUENCE ZONES - KEY TARGETS
23,500-23,550: Major support zone (accumulation marker, Wyckoff spring area, structural hold)
23,650-23,750: Secondary support (EMA 9, demand cluster, psychological level, volume POC)
23,800-23,850: Micro-resistance cluster (consolidation squeeze zone, early breakout resistance)
23,900-23,980: KEY BREAKOUT ZONE (triangle apex, harmonic confluence, all timeframe resistance)
24,000-24,100: Primary upside target (Elliott Wave 5, daily Band upper, measured move extension)
24,150-24,250: Secondary extension target (Gann level, macro resistance, wave projection)
24,300+: Weekly/monthly target (if wave 5 impulse extends beyond base projections)
## 🏆 RISK MANAGEMENT RULEBOOK
✅ 1) Position Sizing: Never risk >2% of account equity per single trade
✅ 2) Risk-Reward Ratio: Minimum 1:2.5 R/R on every entry—1:3+ preferred for swing trades
✅ 3) Profit Scaling: Close 25-50% at 1:1 ratio, let remainder run to 1:2+ targets
✅ 4) Stop Loss Discipline: Place stop IMMEDIATELY on entry—no exceptions (15-20 points tight)
✅ 5) Breakout Confirmation: Avoid FOMO—wait for candle close confirmation + volume surge always
✅ 6) Daily Support Respect: Psychological holds (round numbers 24,000) matter—trade confluence not against
✅ 7) Time Management: Exit losing trades quickly (max 1:0.5 acceptable for educational losses)
✅ 8) Macro Alignment: Always check daily/4H bias before taking 1H or lower trades
## #GER40 #DAX #DAXINDEX #TRADINGSETUP
#TECHNICALANALYSIS #ELLIOTTWAVE #HARMONICPATTERN #BREAKOUTTRADING
#SWINGTRADER #DAYTRADING #INTRADAY #INDICES #TRADINGVIEW
#BOLLINGER BANDS #RSI #ICHIMOKU #VWAP #TRADINGSTRATEGY
#WYCKOFFMETHOD #GANNTHEORY #DOWTHEORY #TECHNICALS #ANALYSIS
#SUPPORTANDRESISTANCE #VOLUMEANALYSIS #OVERBOUGHT #OVERSOLD #REVERSAL
#STOCKINDEXTRADING #GERMANYINDEX #BREAKOUTSETUP #TRADERSOFTWITTER
#TECHNICALTRADER #CANDLESTICK #PATTERRECOGNITION #CHARTANALYSIS #DAYTRADER
## 🎁 BONUS: DAILY PRE-MARKET CHECKLIST
Use this every morning before market open:
☑️ Check daily RSI (should be 60-70 for bullish bias continuation)
☑️ Identify support/resistance zones (23,700 | 23,850 | 23,950 | 24,100)
☑️ Verify 4H chart alignment (pennant/IH&S pattern status update)
☑️ Check Ichimoku cloud position (above/below = trend confirmation signal)
☑️ Review 1H Elliott Wave count (which wave are we trading exactly?)
☑️ Scan volume profile (POC = likely rejection zone area)
☑️ Set entry orders + stop losses BEFORE Frankfurt market opens
☑️ Plan 3 Take Profit levels before entering any position
☑️ Monitor economic calendar (ECB events, German data releases)
## 🌐 EUROPEAN SESSION NOTES
The DAX trades primarily during Frankfurt hours (7:00-17:30 CET) . Highest volatility typically occurs:
Frankfurt Open (7:00-8:00 CET): Initial direction breakout—watch for 50-100 point moves
London Overlap (8:00-12:00 CET): Prime trading hours —best liquidity + volatility combination
NY Open (14:30 CET): Secondary volatility surge—often confirms/reverses DAX direction
💡 Disclaimer: This technical analysis is educational only. Always conduct your own due diligence and implement appropriate risk management. Past performance does not guarantee future results. Trade responsibly within your risk tolerance. Use stop losses on every position. Not financial advice.
Analysis Created: November 8, 2025 | Valid Through: November 14, 2025 | Updated Daily
5m
BITCOIN NETWORKWhen Bitcoin was first introduced by the pseudonymous Satoshi Nakamoto in 2008, it generated a wide range of reactions and predictions from various sectors, including technology enthusiasts, economists, and financial experts. Here are some of the early predictions and opinions about Bitcoin:
1. **Skepticism and Dismissal**:
- Many mainstream financial experts and economists were highly skeptical of Bitcoin. They saw it as a speculative bubble, similar to previous economic bubbles. For instance, economist Nouriel Roubini famously dismissed Bitcoin, predicting its eventual collapse.
- Warren Buffett, a renowned investor, called Bitcoin "rat poison squared" and cautioned investors to stay away from it.
2. **Enthusiasm from Technologists**:
- Among technologists and early adopters, there was significant enthusiasm. They saw Bitcoin as a revolutionary technology with the potential to disrupt the traditional financial system. The decentralized nature of Bitcoin and the underlying blockchain technology were particularly praised.
- Hal Finney, a noted cryptographer, was one of the earliest supporters and received the first Bitcoin transaction from Satoshi Nakamoto.
3. **Libertarian Support**:
- Bitcoin garnered considerable support from libertarians and those advocating for financial privacy and freedom. They viewed Bitcoin as a tool to circumvent government control and provide individuals with greater financial autonomy.
4. **Media Coverage**:
- Early media coverage was a mix of curiosity and skepticism. Some articles highlighted the potential of Bitcoin to change the world, while others focused on its association with illicit activities due to its pseudonymous nature.
5. **Comparison to Gold**:
- Some early proponents referred to Bitcoin as "digital gold," emphasizing its potential as a store of value. This comparison was made due to Bitcoin's limited supply (21 million coins) and its potential to act as a hedge against inflation and economic instability.
6. **Volatility Concerns**:
- Many critics pointed to Bitcoin's extreme volatility as a major drawback, arguing that it would prevent Bitcoin from being used as a stable medium of exchange or store of value.
Here are a few notable early quotes and predictions:
- **Satoshi Nakamoto (2008)**: "I've been working on a new electronic cash system that's fully peer-to-peer, with no trusted third party."
- **Hal Finney (2009)**: "Thinking about how to reduce CO2 emissions from a widespread Bitcoin implementation."
- **Paul Krugman (2013)**: "Bitcoin is evil" - reflecting his strong skepticism and belief that Bitcoin would not succeed.
Despite the mixed predictions and opinions, Bitcoin has grown significantly since its inception, influencing financial markets, inspiring numerous other cryptocurrencies, and sparking widespread interest in blockchain technology.

ATRSL & ATRTPYou checked the daily pattern, today is a uptrend day. On 30m & 5m chart, you draw out support & resistance levels. Current price is at the middle.
You already have a good pattern price that has recenty formed a possible swing low.
You checked the ATR levels at 1.25.
You set the ATRSL (ATR + $1 SL, then the ATRTP (1 ATR). (Here you forgot to put the 2nd level ATRTP...is it even necessary?)
The price moves slowly.. Threatening to touch but did not and price move slowly towards ATRTP.
After a time, price still did not touch ATRTP or ATRSL. But moving towards ATRTP.
This means new buyers are entering the markets.
You can find new patterns and ATR levels after a while.
You can enter new positions now or increase/decrease your ATRTP levels now.
At the ATRTP, price can either reverse or continue. It depends on the price action most recently after you have entered the position. If there are obvious targets of ATRTP and S&R, price will go on. It is better to set the ATRTP level as it is difficult to catch sudden jumps in price that is only few seconds...

WHAT A GOOD DAY TO SCALP !!!!!!!!GO TO 1M AND 5M TO UNDERSTAND IT BETTER
USUALLY DONT SCALP BUT HOW CAN YOU MISS AN OPPORTUNITY IF ITS IN FRONT OF YOU /////////////// AND IF YOU ARE NEW TO TRADING JUST PLEASE DONT DO THAT IT WILL BLOW YOUR ACCOUNT.
50+ PIPS BANKED FOR TODAY.
JUT USE PRICE ACTION TRY TO SYNC WITH THE MARKETS.
STOCH RSI I USE IT FOR POSSIBLE PULBACKS STILL ITS AN INDICATOR BUT PRICE ACTION WITH THIS INDICATOR IS MIND BLOWING

NZDJPY 5m SUPPLYThis here is a high probability supply zone actually on the 5m chart that one can take for a quick 3:1 RR gain.

AUDUSD | December 15, 2020Hey i'm Amir .
Here's update for AUDUSD Guys...
Get confirmation in 5m Timeframe.
1H:
4H Head and shoulders:
I have been learning Forex for 2 month now.

EUR/USD | December 9, 2020Hey guys welcome back, I'm Amir.
I'm looking for 1.21010, anyway i taking my +30pips profit...
I have been learning Forex for 1 month now.


HARMONICS IN MINUTESThis style is Hedge trading, creating a full sized risk free position in both directions.
Closing 50% of each position at 2R creates a risk free position, should price move to the stop loss, profit for each position would be 0.75R
Closing 50% of each remaining position at 4R Secures 2R profit on all positions, should price move to the stop loss, profit for each position would be just over 1.9R
Closing 50% of each remaining position at 8R Secures 3R profit on all positions, should price move to the stop loss, profit for each position would be 2.875R

ETHUSD 15M (OR 5M) Day Trading Cryptocurrency Day Trading Cryptocurrency – How To Make $500/Day with Consistency
Would you like to learn day trading cryptocurrency and make a consistent $500 per day? We often hear about all the money you can make by day trading stocks. But what about crypto day trading? In today’s lesson, you’ll learn how to day trade cryptocurrency using our favorite crypto analysis tools.
Our team at Trading Strategy Guides is lucky to have over 50 years of combined day trading experience. We’re going to share with you what it takes to day trade for a living, and hopefully, by the end of this trading guide, you’ll know if you have what it takes to succeed in this business.
First and foremost, when day trading, it’s essential to have a structured approach and a rule-based strategy. The same as swing trading or positional trading you are not going to trade every day, and you’re not going to make money every day. So, you need a day trading cryptocurrency strategy to protect your balance.
The high volatility nature of Bitcoin and other cryptocurrencies has made the crypto market like a roller-coaster. This is the perfect environment for day trading because during the day you’ll have enough up and down swings to make a decent profit.
Moving forward, we’re going to teach you what you need to learn how to day trade cryptocurrency and we’re going to share some out-of-the-box rule-based day trading strategies.
How to Day Trade Cryptocurrency
The crypto market’s unique characteristics require you to have a firm understanding of how it works. Otherwise, your experience can be like skydiving without a parachute.
The good news is that we’re going to provide you with everything you need to survive crypto day trading.
Day trading the cryptocurrency market can be a very lucrative business because of the high volatility. Since the crypto market is a relatively new asset class, it has led to significant price swings.
Before day trading Bitcoin or any other altcoins, it’s prudent to wait until we have a high reading of volatility. The good news is that even when we have a low reading of volatility relative to other asset classes, this volatility is still high enough that you can generate a modest profit on your trades.
Crypto day trading also requires the right timing and good liquidity to make precise entries.
A lot of the cryptocurrencies and crypto exchanges are very illiquid and don’t have the liquidity to offer instant execution that you might find when trading Forex currencies.
Before day trading Bitcoin or any other alt coins, it’s also important to check how liquid the cryptocurrency you wish to trade is. You can do so by simply verifying the 24-hour volume of the crypto trade.
CoinMarketCap is a good free resource to read and gauge the market volume of any particular coin.
Note* Always remember that not having enough liquidity could lead to substantial slippage and subsequent to bigger losses.
As previously stated, crypto day trading doesn’t require trading every single day. We only like day trading cryptocurrencies when all the conditions align in our favor. In this case, avoid trading on weekends and limit trading only on the highest-volume days.
Crypto Day Trading Strategy
The idea behind crypto day trading is to look for trading opportunities that offer you the potential to make a quick profit. If day trading suits your own personality, let’s dive in and get through a step-by-step guide on how to day trade cryptocurrency.
Now, before we go any further, we always recommend taking a piece of paper and a pen and note down the rules of this scalping strategy.
In this article, we’re going to look at the ‘buy’ side.
Pick up Coins with High Volatility and High Liquidity
As previously discussed, the number one choice you need to make is to pick coins that have high volatility and high liquidity. If you’re not day trading Bitcoin, which is the most liquid coin out there, and you like the altcoins, try to pick those coins that have good liquidity and volatility.
There are more than 1600 coins on the market and growing. By following only the top cryptocurrencies, you’ll reduce your area of selection.
Day trading smaller cryptocurrencies can also be a very lucrative business, but there are higher risks. Remember, crypto prices can crash just as fast as they have risen.
Step #1: Apply the Money Flow Index Indicator on the 5-Minute Chart
This specific day trading strategy uses one simple technical indicator, namely the Money Flow Index. We use this indicator to track the activity of the smart money and to gauge when the institutions are buying and selling cryptocurrencies.
The preferred settings for the MFI indicator are 3 periods.
We’re also going to alter the default buying and selling levels from 80 to 100 and respectively from 20 to 0.
Step #2: Wait for the Money Flow Index to reach the 100 level
An MFI reading of 100 shows the presence of the big sharks stepping into the markets. When buying, smart money can’t hide their footsteps. They inevitably leave tracks of their activity in the market and we can read that activity through the MFI indicator.
Technical indicators aren’t always right, so in order to fine-tune our day trading strategy, we’ve added a few more conditions. Namely, during the current day, we need to skip the first two MFI readings of 100 and study the crypto price reaction.
The price needs to hold up during the first and second 100 MFI reading.
If the price drops after the first two MFI 100 readings, then this suggests that most likely we’re going to have a down day.
Let’s now determine the appropriate place to go buy Bitcoin and what are the technical conditions that need to be satisfied.
Step #3: Buy if MFI = 100 and if the subsequent candle is bullish
We can now wait for the third MFI reading above 100. It doesn’t necessarily have to be the third MFI = 100 reading, you can take every other MFI = 100 readings. If your time doesn’t allow you to catch the third 100 reading on the MFI indicator, you can simply pick the next one as long as all the other technical conditions are satisfied.
Next, we also need the candlestick when we got the MFI = 100 reading to be a bullish candle. The close of this candle needs to be near the upper end, giving us a candle with very small wicks.
Step #4: Hide your protective Stop Loss below the low of the day. Take Profit during the first 60 minutes after you opened the trade.
The obvious place to hide your protective stop loss is below the low of the day. A break below it will signal a shift in the market sentiment, and it’s best to get out of the trade. This can also signal a reversal day.
Step #5: We’re more flexible when it comes to our exit strategy. However, the only rule you need to abide by is to take profits during the first 60 minutes or the first hour after your trade got triggered. Holding the trade longer than one hour will result in a lower success rate. At least that’s what our backtested results showed us.
Conclusion – Crypto Day Trading
If you took the time to read the whole day trading crypto guide, then you should be able to buy and sell Bitcoin and alts and make some daily profits. If you are interested in learning how to day trade cryptocurrency, be sure to equip yourself with enough information before diving into the market.
Crypto day trading can be a great way to grow your crypto portfolio and it’s a very lucrative alternative to the holding mentality that it’s crippling the crypto community.
Making a living day trading cryptocurrency can be a lot easier due to the high volatility nature of the crypto market. High volatility suits day trading very well, so you have the right environment to succeed.

EURAUD 4H/5M SHORT TRADEPrice is falling to 4h 50 sma
Enter trade on a 5m chart
Enter on a 5m candle close of trendline breakout
Sell Take Profit @ 1.5650
Find yourself a SL

CADJPY 15M MFI DAY TRADING STRATEGY WORKS ON FOREXThis is a great Day trading strategy
What ever session you trade this will work
Best on 5m charts but all TF work
Rule 1 - add MFI to chart and change these settings - Length 3 / Levels 0/100
Rule 2 - I like to add the 50 ema to determine what direction I want to trade
Rule 3 - Wait for MFI to hit the 100 level twice if bullish bias trade
Rule 4 - Buy when MFI hits 100 3rd time and there is a green candle close also
Rule 5 - SL nearest fractal low
Rule 6 - you determine TP strategy

Copper: Add-On Trade for Bearish Continuation WavePrevious position has been brought to breakeven. This set-up is actually based on the 5M chart so I will be active in managing this, but it is in line with all of my thoughts and provides a great reward:risk.

AUDNZD 4H OPEN TRADE-ABLE SPACE Bearish Continuation move on 4H has no consolidation to the left just 2 large body candles
Price should easly fall through that ope trade-able space
Watch 5m - break-hook-go completed - now just needs to breakout of support level
Take Profit towards bottom of blue box


GBP/USD Shorting Opportunity with an upside down Crab PatternThe market is about to complete a crab pattern, upon completion in the potential reversal zone, the market should retrace back to the 1.618 fib of the BC leg. please like and comment and don,t forget to follow me. Good trading !
