NVDA – Consolidation Breakout Toward 200 Core Resistance?🔶 Downside structure
Looking at NVDA on the daily chart, one level clearly stands out on the downside:
170 PUT support , where price has bounced multiple times in the past. This level has been well defended by put positioning, creating a solid structural floor. 🔴
🔶 Consolidation behavior
Over the past weeks, price spent a considerable amount of time sitting on the 50-day moving average , repeatedly testing it from below but failing to break through decisively. That dynamic now appears to be changing. NVDA is starting to push higher, suggesting a potential breakout from this consolidation range. 🟢
🔶 Upside reference level
If this breakout holds, the next key level to watch is 200 Call Resistance . This is currently the largest Call Resistance on the board, and it also aligns with an 8/8 MM level , adding technical confluence to the zone. 🟢
🔶 Options sentiment context
What’s important here is sentiment:
🔵 Call Pricing Skew is currently minimal, meaning the options market is not aggressively positioned for upside yet. This keeps the move cleaner and reduces the risk of an overcrowded bullish trade. In other words, this is not a euphoric call-heavy environment, which often allows price to travel further if momentum builds.
🔶 Scenario
🟢 If NVDA successfully breaks out of this consolidation and holds above the 50-day MA , a move toward the 200 Call Resistance becomes a very realistic upside target.
🔶 Key levels
🔴 PUT Support: 170
🔵 Trigger: Sustained breakout above the 50-day MA
🟢 Upside Target: 200 Call Resistance (8/8 MM)
Not financial advice — just a clean structure driven by price, positioning, and option market context.
Optionstrading

Options Greeks + AI: The New Era of Derivatives Trading
Options Already Feel Like 4D Chess - AI Just Adds More Dimensions
For many traders, options feel intimidating because there isn't just "price" — there are Greeks, volatility, time decay, and complex payoffs.
AI doesn't magically simplify options. What it does is help you see and manage all those moving parts at once.
---
Quick Greek Refresher (The Calm Version)
Delta (Δ) – How much the option price moves when the underlying moves
Gamma (Γ) – How fast Delta itself changes
Theta (Θ) – How much you pay or collect per day in time decay
Vega (ν) – How much the option responds to changes in implied volatility
Think of it like this:
Delta: Direction
Gamma: Acceleration
Theta: Rent for time
Vega: Sensitivity to fear/volatility
---
Where AI Actually Helps With Options
Instead of guessing, AI‑driven tools can:
Monitor your total portfolio Greeks in real‑time (net Delta, net Vega, etc.)
Run what‑if scenarios : "What happens to my P&L if we gap 3% overnight? If IV drops 10 points?"
Search across chains to find structures that fit your risk profile
You still choose the playbook. AI just gives you a clearer picture of the board.
---
Example: Using AI for Volatility, Not Just Direction
Most traders focus on "Will price go up or down?".
Options traders (and their models) often focus on:
"Will price move more or less than the market expects?" (Realized vs implied volatility)
AI can:
Compare current implied volatility to realized volatility over multiple windows
Flag when options look historically expensive or cheap
Suggest whether you should be long or short volatility for your idea
Direction is still a bet - but at least now, your bet on volatility is informed.
---

Positive GEX Profile Points Toward 700 Gap FillMETA – Holding Above HVL, 50 DMA Reclaim in Progress, Upside Call Resistance at 700
META is currently trading below the 200-day moving average , but recent price action suggests a potential structural improvement rather than continued weakness.
From an options perspective, the broader structure remains Positive GEX , indicating that dealer positioning is still supportive on pullbacks. At the same time, IV remains low , which typically favors range expansion and directional follow-through once key technical levels are reclaimed.
On the daily chart, price is now starting to reclaim the 50-day moving average , a level that previously acted as dynamic resistance. Importantly, META is also holding above the High Volatility Level (HVL) , which keeps the short-term regime constructive rather than defensive.
Volatility conditions remain favorable:
Call Pricing Skew is elevated (~31.6%), showing persistent call demand
IV remains controlled, allowing price to move without immediate volatility compression pressure
Looking forward, the most important upside call resistance is the 700 level, which represents:
Highest core call resistance on the Feb 20 (Optimal Monthly) expiration
A major gap fill from the prior breakdown
A clear technical resistance zone visible on the daily chart
This confluence makes 700 a logical upside target if price can hold above HVL and fully reclaim the 50 DMA.
Key structure to watch:
200 DMA – higher timeframe resistance overhead
50 DMA – short-term trend reclaim in progress
HVL – holding above keeps structure constructive
700 – primary upside target (gap fill + core call resistance)
As long as price holds above HVL with supportive GEX structure, rotational upside toward 700 remains the higher-probability path .

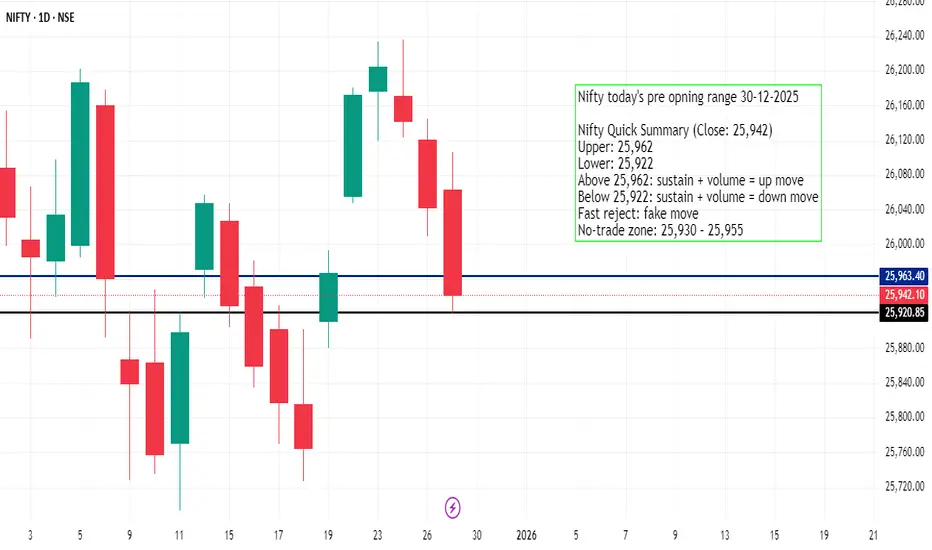
(FIIs-DIIs) Nifty levels & range for tomorrow 31-12-2025(FIIs-DIIs) Nifty levels & range for tomorrow 31-12-2025
use levels in 5 minutes time frame for intraday trading

today's nifty analysis 30-12-2012Nifty Quick Summary (Close: 25,942)
Upper: 25,962
Lower: 25,922
Above 25,962: sustain + volume = up move
Below 25,922: sustain + volume = down move
Fast reject: fake move
No-trade zone: 25,930 – 25,955
Buying CCLI’ve looked at the company’s numbers, and I can see that this ticker has momentum for at least the next 53 days. This is why I’m buying cash secured calls, nothing fancy, strike at $31, expiry on March 20th, 2026. I’ve had quite a few successful trades, especially in the last quarter of 2025, so I’m hoping this starts the year off right.
There’s nothing major behind the fundamentals, but I noticed that cash is flowing into the Consumer Discretionary sector, which makes sense with Q4 buyers. Still, this company is trading very cheaply compared to what it makes versus peers and the broader market. I try not to marry my bias, just seeing a lot of rational business being done in 2026 as well.
I will probably have 2 to 5 more trades added with similar expiries. Happy New Year!

DIXON | Weekly Bearish Options Setup | Jan ExpiryTrade Idea
• Sell 12,500 CE
• Buy 13,000 CE
• Defined-risk bear call spread
Why this setup works
DIXON NSE:DIXON has broken below the mid-band and is trading under key short-term moving averages. The recent bounce attempt near the upper band was sold into, confirming supply at higher levels.
Momentum is weak, RSI is slipping below the mid-zone, and price is now making lower highs on the weekly chart. As long as DIXON stays below the 12,600–12,700 resistance zone, upside looks capped.
With steady IV, call spreads offer a clean risk-defined way to express this view.
View
Moderately bearish — expecting DIXON to stay below resistance and drift sideways to lower levels.
This post is for education only. It’s not financial advice or a recommendation to trade.
#WeeklyOptions
#BearishSetup
#DIXON
#OptionsTradingIndia
#BearCallSpread
#ThetaDecay
#NSEOptions

Ticker - $BULLWe have a triple inversed bottom with yoru inverse head and shoulders coming out of a head and shoudlers. I have my decision zone marked where I expect it to break here soon 8.77 with my first and second price targets mixed. I am personally in 2028 ITM leaps

Disney's Possible Swing SetupHi Traders!
As I analyze Disney, I am seeing it's in a counter trend on the 24HR with a resistance at $120. I'm staying patient watching to see how far price will retrace with a 24HR CHOCH sitting at around $102.50. That seems far away, but that would help fill in some of the gap, and give a nice set up for a reversal. In addition, there are 4 days left in the current Monthly candle, and they've been closing small. IMO that could indicate that price could eventually make it to $130.
For now, I have alerts set and I'm planning to take a long swing.
Let me know what you guys think in the comments! Good luck!
*DISCLAIMER: I am not a financial advisor. The ideas and trades I take on my page are for educational and entertainment purposes only. I'm just showing you guys how I trade. Remember, trading of any kind involves risk. Your investments are solely your responsibility and not mine.*

Why Bitcoin Feels Stuck And What Options Have To Do With ItWhat are options? 🧾
- An option is a contract on Bitcoin.
-Calls = right to buy BTC later at a fixed price.
-Puts = right to sell BTC later at a fixed price.
Big traders and market‑makers hedge these contracts by buying or selling real BTC and futures. When there is a lot of options at a few key prices, their hedging can hold BTC in a tight range.
Why BTC feels stuck around 85k–93k 🧲
For December there is a lot of open interest around:
~85k (many puts).
~100k (many calls).
Because of this:
- When BTC moves up, dealers often sell to hedge → upside gets capped.
- When BTC moves down, they often buy → downside gets supported.
Result: price just chops sideways in a band, instead of trending strongly.
What changes after 26 December? 🎄➡️📈📉
On 26 December, a huge batch of Bitcoin options expires (tens of billions in notional value). When they expire:
- Those hedges are no longer needed.
- The “invisible wall” around 85k–100k weakens.
BTC is freer to move.
What that usually means:
Before 26 Dec: sideways range is likely to continue.
After 26 Dec: we can expect bigger, faster moves, either:
Up, if fresh spot buying / ETF inflows stay strong and macro is calm.
Or down, if sentiment turns risk‑off and new buyers don’t step in.

HDFC Bank Option Chart Near Major Support AreaHDFC Bank – 1 Hour Timeframe Analysis OPTION 980 CE Chart .
This is the 1-hour timeframe chart of HDFC Bank. The stock is currently moving within a descending parallel channel, with a key support zone near ₹12–13.
A bullish candle formation is visible at this support level.
If the price sustains above this zone, a potential reversal can be expected, with the stock likely to move towards higher resistance levels from here.
Thank you.

GOOGL GEX & Bullish Decision Point at 320February 20 Expiration – GEX & Options Structure
Looking at the February 20 expiration, the options and GEX structure suggests that price is currently sitting at a critical decision zone .
Put side
The chart shows a clear put support level around 310 .
Price has briefly traded through this level, but there has been no strong downside continuation .
This keeps the scenario alive that 310 can still act as put support into this expiration.
Call side / Decision point
The next core resistance is located around 320 .
This level represents a bullish decision zone .
A clean break and acceptance above 320 could quickly shift dealer positioning.
Such a move would open the door for a potential gamma squeeze to the upside.
Technical context
Since summer, this is already the third similar bull flag structure on the daily chart.
The previous two structures resolved to the upside.
The current pattern has not yet confirmed a breakout.
This makes the 320 level especially important for technical confirmation.
Upside scenario
If price accepts above 320 , the next logical magnet becomes the next core resistance.
Based on daily structure and call wall positioning, this sits around 350 .
Volatility & Skew
Core pricing skew is currently around +25% , favoring calls.
Implied volatility has been compressing for several sessions .
This supports the idea that a directional expansion could follow once price resolves this range.
Summary
310 = key put support
320 = bullish decision point
Acceptance above 320 increases the probability of gamma-driven upside toward higher call resistance levels

DRI Darden Restaurants Options Ahead of EarningsIf you haven`t bought DRI before the rally:
Now analyzing the options chain and the chart patterns of DRI Darden Restaurants prior to the earnings report this week,
I would consider purchasing the 180usd strike price puts with
an expiration date of 2025-12-19,
for a premium of approximately $3.75.
If these options prove to be profitable prior to the earnings release, I would sell at least half of them.

$TGT is testing a key weekly resistance level NYSE:TGT is testing a key weekly resistance level, the same zone it’s failed to clear since August.
This week closed strong: highest weekly close since August and on increasing volume.
Price did reject intraday, but it’s knocking at the door. A retest of $95.84 is healthy and a solid spot to assess for continuation if it holds.
If price loses $95.84, a move back toward $93.24 becomes likely.
Calls over $98.25
Target → $100.36
Puts under $90.90
Targets → $90.56, $88.85

Meta - $450 Target - The Next Big Short?Even though Meta is holding up in the LLM race with Llama, Meta has had a massive failure (over $70B+) on the failed Metaverse project in which is their new namesake along with now the Australian social media ban for people 16 and younger, and people realizing the intensity of the data Meta collects on people. The stronghold Meta has on social media is coming to a pause, and at the same time questions are arising on whether or not they can differentiate themselves enough having a hard time tackling growth beyond Facebook's user stagnation point and advertising. That said, short volume is increasing, and the recent bull run could be due for a correction. The MACD trading indicators show two recent pushes over short volume, and at the same time, this seems to be the top of the bullish trendline. A retracement back to $450 making this a big short is possible. As always, none of this is investment or financial advice. Please do your own due diligence and research.

Pre-Market Morning Levels & Setups: META • SPY • ZS • AMZN •NVDAQuick morning breakdown covering META, SPY, ZS, AMZN, and NVDA.
Touched on futures structure, overnight sentiment, key levels, and what I’m watching into the open.
Straightforward setups and the zones that matter.

TCS: SMA 200 for long positionHello traders,
The stock we are going to watch is $NSE:TCS. This stock is related to IT sector. This stock is mostly moving in an upward direction. Currently, it is taking some additional support of SMA200 in 4h time frame. This stock can shoot upwards at anytime.
If you're a option trader, consider buying the premium which is having the liquidity. Consider exiting near 4100 to protect your profits.
Thanks & regards,
Alpha Trading Station

Weekly QQQ (NQ-US100) Outlook - Prediction (23 NOV)Weekly QQQ (NQ-US100) Outlook - Prediction
📊 Market Sentiment
Market sentiment is driven by fear at the moment. In my opinion, we are trading inside a bearish zone. Unless we get meaningful data or positive news, I expect the market to continue declining. Core PPI will be released on Tuesday at 08:30, which could create a minor bullish reaction; however, I personally do not think this will shift the overall sentiment. PPI is not a strong catalyst for a major sentiment change, so bearish conditions are likely to remain in play.
📈 Technical Analysis
Price ran the 613 level strongly and reversed aggressively on Thursday after NVDA earnings. This move trapped the bulls and filled institutional put positions. As I mentioned on Thursday evening, a weak bounce was possible and that is exactly what occurred.
📌 Outlook – Prediction
Scenario 1 (Bearish Scenario):
I believe this scenario is more likely to play out. I expect price to retrace toward 559. If we see strong bullish momentum on Monday, I will likely become more cautious with my puts.
Scenario 2 (Bullish Scenario):
If price shows strong momentum on Monday and reprices toward 614, then I will consider buying calls around 606, targeting all-time highs afterward.
Follow me for daily SPY–QQQ updates. I will update the idea based on evolving price action.
💬 For detailed insights and broader market context, please check my Substack link in profile.
⚠️ For educational purposes only. This is not financial advice.

IMPP Imperial Petroleum Options Ahead of EarningsIf you haven`t bought IMPP before the rally:
Now analyzing the options chain and the chart patterns of IMPP Imperial Petroleum prior to the earnings report this week,
I would consider purchasing the 7usd strike price Calls with
an expiration date of 2026-4-17,
for a premium of approximately $0.85.
If these options prove to be profitable prior to the earnings release, I would sell at least half of them.

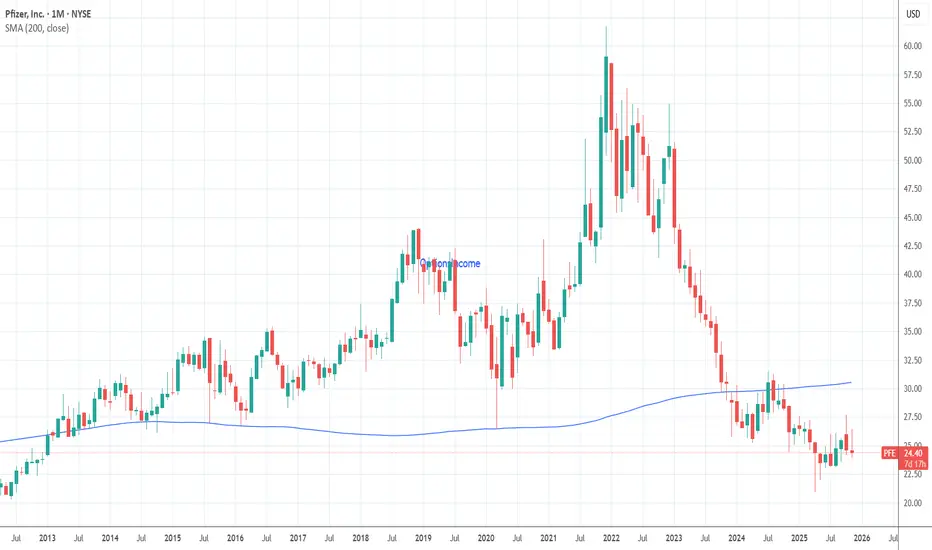
Pfizer (PFE) – Hedged Covered Call Income CampaignAfter Pfizer’s return to price levels closer to its pre-COVID range, I personally believe the stock is undervalued relative to its current earnings profile and long-term potential. This view is also influenced by Pfizer’s recent acquisition of Metsera, which brings a pipeline of obesity and cardiometabolic candidates — including GLP-1 receptor agonists, an amylin analog, and other metabolic therapies.
Whether this pipeline ultimately succeeds is uncertain, but in my opinion, it meaningfully strengthens Pfizer’s long-term outlook.
This campaign is structured as a hedged, conservative covered-call income strategy, combining downside protection with steady premium generation.
Current Position
1. Long Shares: 700 shares @ $24.94
2. Protective Long Puts: 7 puts @ $19 strike (exp. 1/16/26), Cost: $35 total
Because PFE’s implied volatility is relatively low, these long-dated puts provide very inexpensive downside protection, defining maximum risk and allowing me to run covered calls with confidence. This is my preferred way to reduce tail risk on slower-moving stocks.
Covered Calls (Income)
I am selling near-term calls at the $25 strike and rolling as needed.
Call Activity So Far:
A. Initial Sell
• 7 contracts @ $0.11 → $77 total
• Expiration: 11/07/2025
B. Roll #1
• 7 contracts @ $0.15 → $105 total
• Expiration: 11/11/2025
C. Roll #2
• 7 contracts @ $0.15 → $105 total
• Expiration: 11/17/2025
Dividend Component:
Pfizer’s dividend provides a third income source that complements the weekly call premiums. With 700 shares, my next scheduled dividend payment is $310.89 on December 1st. this is nearly a 7% yield.
Dividends enhance this strategy by:
1. Reducing effective cost basis over time
2. Providing a reliable quarterly income
3. Making slower-moving stocks like PFE well-suited for hedged income trading
4. Smoothing returns even during flat price periods
This is one reason I favor PFE for long-term defensive income strategies.
These rolls follow my usual “roll out only” approach — extending time value without paying unnecessary extrinsic premium. This keeps weekly income stable while managing assignment risk.
$TSLA Update NASDAQ:TSLA has a solid finish today during the market stress test.
Please watch the recording for levels and price targets.
Cheers.

SLS SELLAS Life Sciences Group Options Ahead of EarningsAnalyzing the options chain and the chart patterns of SLS SELLAS Life Sciences Group prior to the earnings report this week,
I would consider purchasing the 3.50usd strike price Calls with
an expiration date of 2027-1-15,
for a premium of approximately $0.52.
If these options prove to be profitable prior to the earnings release, I would sell at least half of them.

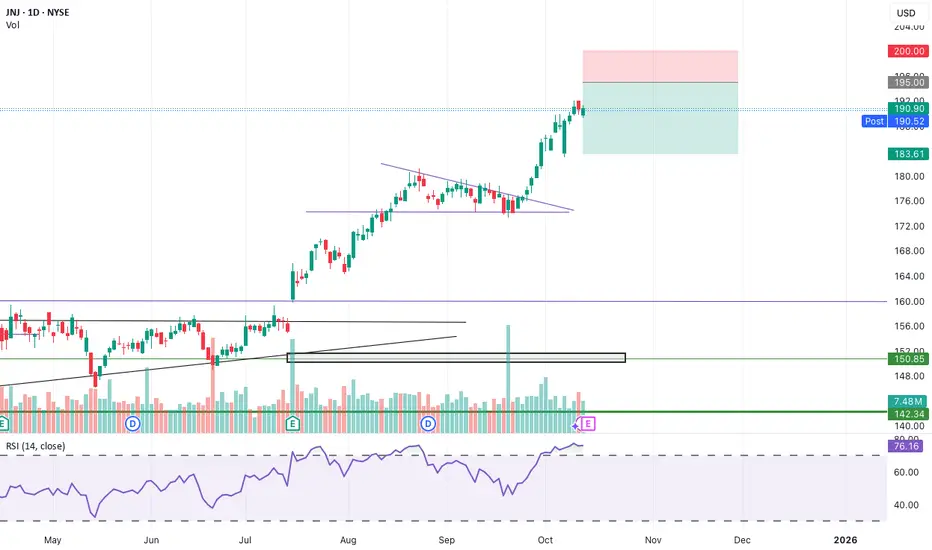
Bear Call Spread on JNJBear Call Spread Sell 195 Call strike and Buy 200 Call Strike, Exp: Nov 28 (45 DTE) for no less than $1.55
Trade has about 67% probability of profit
Taking advantage of high IV rank of 40
Credit received = $155
BP Effect = $345
Max Loss = (5 - 1.55) * 100 = $345
Breakeven = 195 + 1.55 = $196.55
Percentage return: (155 / 345) * 100 =44.928%
Exit Target: 40% - 70% of Credit received ($62 - $108.50)
Stop-loss: close if price threatens the short strike and cost to buy back exceeds 50% of max loss or predefined dollar loss,
Exit no later than 7 days before expiration
JNJ has seen a significant rise and it at ATH, RSI indicator also shows JNJ being overbought
Trade is just for educational purposes and willing to learn consistent option trading