$AAPL $245 to WatchI posted this a while back, but the post; reposting it. $245 is a confluence of my algo support zone and also the 50 Fib. Watching this level to hold for a next move higher to $341
AAPL

AAPL long-term TAApple is in good solid uptrend on weekly time frame, but be careful on mid-term there's negative divergence between volumes and price, eventually it may pull back, watch for the support area between $256-266 to hold once correction occurs.

-15% in the next 1-2 monthsAAPL has been messing around in this bear flag for quite a bit.
Most of the Mag7 have broken down aside from Google.
Next major support on AAPL is not until 237....
Looking for the next leg down.
I'm honestly not sure "why" this is happening, which is more frightening long-term. Typically when there is a news event reason, the market prices it in and we continue up.
But, when markets flip without any reason, it means they know the reason but aren't telling the public because they need time to get out of the burning building while you're all eating the cake and getting fat.
If you are buying Mag7 stocks, SPY, QQQ right now.
You are a pig, getting fat, inside a burning building.

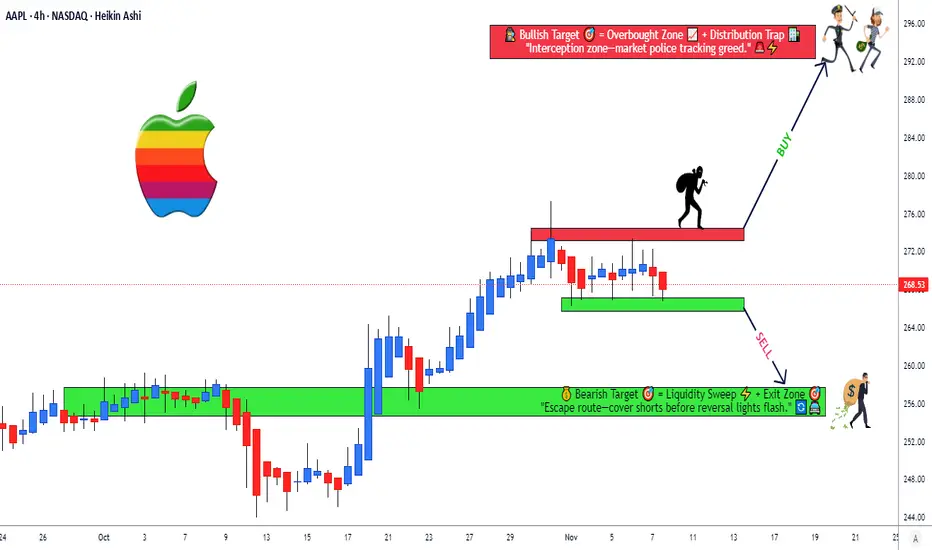
Its Going Down $AAPLWhat It Dew Yall!
Its NASDAQ:AAPL with 3 rejections at the confirmation Level for me! Please See Chart, I Placed entries & exit on it. This is on the 20 min Time Frame. The Golden Zone Box is white because of the Sniper Entries added However if/when price reaches the Golden and it actually holds that level, I may exit. However, if price breaks below the .382 I'll wait for the following levels to transpire. Because of the Sniper Entry the R:R is beautiful! Lets Go!
Happy Trading, Alerts Set.

AAPL – Bullish Flag If the Catalysts Show UpApple is pulling back into a descending flag after a strong multi-month rally. This still looks like a healthy consolidation if the next move higher is backed by fundamentals. The bullish case needs catalysts to trigger: iPhone 17 supply catching up to demand, Services growth holding in the mid-teens (high-margin EPS leverage), and gross margins staying resilient despite higher AI spend.
If these start to confirm and price pushes higher, the flag can resolve to the upside. If not, a failure could lead to a minor correction toward the anchored VWAP, which would still be consistent with the broader bullish structure. The oversold RSI suggests downside may be limited near-term, supporting the idea of consolidation rather than a full trend break.

AAPL | 30m | ShortTech rotation: Pre-earnings neutral (Jan 29, 10-12% rev guide positive but China risks). USD strength pressures growth. News impact: Quiet Monday, rotation continues. Liquidity high.
_________
Execution:
Entry: Sell below 269.00 (strong resistance)
Stop: 282.30-283 (above MA20)
Targets: 255.00 - 245.22 (use trailing SL)
_________
Disclaimer: This is not financial advice — just my thoughts for educational purposes only. Always DYOR and trade at your own risk.
Stay tuned. Follow for more. Daily setups.

Stock Market Forecast | BTC TSLA NVDA AAPL AMZN META MSFT0:00 Intro
0:19 Sector Data
0:44 Sentiment Data
1:38 Dark Pools (Mag 7 ETF)
5:10 S&P 500 (SPY)
7:12 Nasdaq 100 (QQQ)
10:46 Bitcoin (BTC)
13:44 Tesla (TSLA)
16:39 Meta (META)
18:16 Amazon (AMZN)
19:11 Microsoft (MSFT)
21:35 Apple (AAPL)
23:55 Nvidia (NVDA)
26:06 Outro
QQQ stock market Forecast
Nvidia Stock NVDA Forecast
Apple Stock AAPL Forecast
Microsoft Stock MSFT Forecast
Google Stock GOOGL Forecast
Amazon Stock AMZN Forecast
Meta Forecast Technical Analysis
Tesla Stock TSLA Forecast
Magnificent 7 stocks forecast
Bitcoin BTC forecast
CRYPTOCAP:BTC SP:SPX NASDAQ:NDX NYMEX:NG1!
#daytrading #btc #stockmarketanalysis #nvda #tsla #aapl #msft #technicalanalysis #stockmarketeducation #mag7

AAPL: The 30% Rule — Why Apple’s Next True Low Likely at 200 USD🍎 AAPL WEEKLY SNAPSHOT — EXECUTIVE SUMMARY
✨ Apple Inc. is entering the late phase of a multi-year corrective cycle
📉 Primary thesis: A ~30% correction is still unfolding, consistent with prior Apple macro drawdowns
🏛️ Macro backdrop: Dow Jones Industrial Average extended near psychological 50,000 → late-cycle risk elevated
⏳ Timing focus: 2025 distribution → 2026 corrective low
🎯 Projected downside target: $200 ±10 macro support + valuation reset
________________________________________
🔍 Why the 30% Correction Matters Historical Fractal Logic
Apple has repeatedly respected ~30% drawdowns during secular bull markets — not crashes, but controlled re-ratings:
• 📌 2021 → 2022:
• High → Low ≈ -30%
• Trigger: tightening cycle + growth multiple compression
• Outcome: strong multi-quarter recovery
• 📌 2024 → 2025:
• High → Low ≈ -30%
• Trigger: AI-led over-extension + index concentration risk
• Outcome: range repair, not trend resumption
• 📍 Current Cycle (2025 → 2026):
• Structure suggests another proportional leg
• Distribution at highs → rolling lower highs → trend exhaustion
• Measured move from 286 ⇒ ~200 aligns with historical symmetry
📐 Market logic: Apple doesn’t usually collapse — it compresses.
________________________________________
🧱 Key Technical Zones Weekly / Monthly
• 🔺 286–280: Macro ceiling / cycle high (distribution complete)
• ⚖️ 245–235: Mid-range congestion (temporary reactions possible)
• 🟨 215–200: High-probability terminal support zone
• 🚨 Invalidation (bear thesis): Sustained acceptance above 286
________________________________________
🧠 Macro Confluence Why 2026 Matters
• 📊 DJIA near historic extension → mean reversion risk rising
• 💰 Passive flows crowded into mega-caps (AAPL = core holding)
• 🧮 Valuation sensitivity at cycle peaks historically resolves via price, not time
• 🕰️ Apple corrections often lag index tops, bottoming after broader sentiment breaks
________________________________________
🎯 Strategic Trade Framework
• ❌ Avoid chasing long exposure at highs
• 🧘♂️ Expect volatility + range expansion before clarity
• 🛒 Best long-term accumulation: only near 200 zone, not earlier
• 🧭 Tactical traders may short rallies below 280 with tight risk
• 🏦 Post-2026: High-quality reset likely sets up next secular advance
________________________________________
🗳️ AAPL Weekly Scenarios — Levels Quiz
Which path do you see next?
🅰️ Hold above 245 → extended range before final breakdown
🅱️ Break 235 → acceleration toward 215–200 macro support
🅲 Flush to ~200 in 2026 → generational accumulation window
🅳 Your level: comment the one price that changes your bias

AAPL CRACK!AAPL just flashed its first CRACK! of this structure.
AAPL has moved from the upper trendline to the bottom more through time than price.
In my BKC (Bare Knuckle Charting) read, the real tell isn’t the crack… It’s the miss. The previous high couldn’t even tag the upper trendline. That’s subtle, but it’s a big signal of weakening momentum.
Then came the CRACK! at the bottom, confirming it.
Lastly, we have a mini Head & Shoulders formed at the top.
APPL is growing revenues at a rate of 1–2% per quarter, while the stock has been growing at a rate of 5–6% per quarter. That extra 3–4% per quarter is pure multiple & narrative expansion — which is exactly why cracks in charts start to appear.
I urge CAUTION to Bulls!
THANK YOU for getting me to 5,000 followers! 🙏🔥
Let’s keep climbing.
If you enjoy the work:
👉 Drop a solid comment
Let’s push it to 6,000 and keep building a community grounded in truth, not hype.

Stock Market Forecast | BTC TSLA NVDA AAPL AMZN META MSFTQQQ stock market Forecast
Nvidia Stock NVDA Forecast
Apple Stock AAPL Forecast
Microsoft Stock MSFT Forecast
Google Stock GOOGL Forecast
Amazon Stock AMZN Forecast
Meta Forecast Technical Analysis
Tesla Stock TSLA Forecast
Magnificent 7 stocks forecast
Bitcoin CRYPTOCAP:BTC forecast
SP:SPX NASDAQ:NDX CME_MINI:NQ1! CME_MINI:ES1!

Stock Market Forecast | BTC TSLA NVDA AAPL AMZN META MSFTQQQ stock market Forecast CME_MINI:ES1! SP:SPX NASDAQ:NDX
Nvidia Stock NVDA Forecast
Apple Stock AAPL Forecast
Microsoft Stock MSFT Forecast
Google Stock GOOGL Forecast
Amazon Stock AMZN Forecast
Meta Forecast Technical Analysis
Tesla Stock TSLA Forecast
Magnificent 7 stocks forecast
Bitcoin CRYPTOCAP:BTC forecast

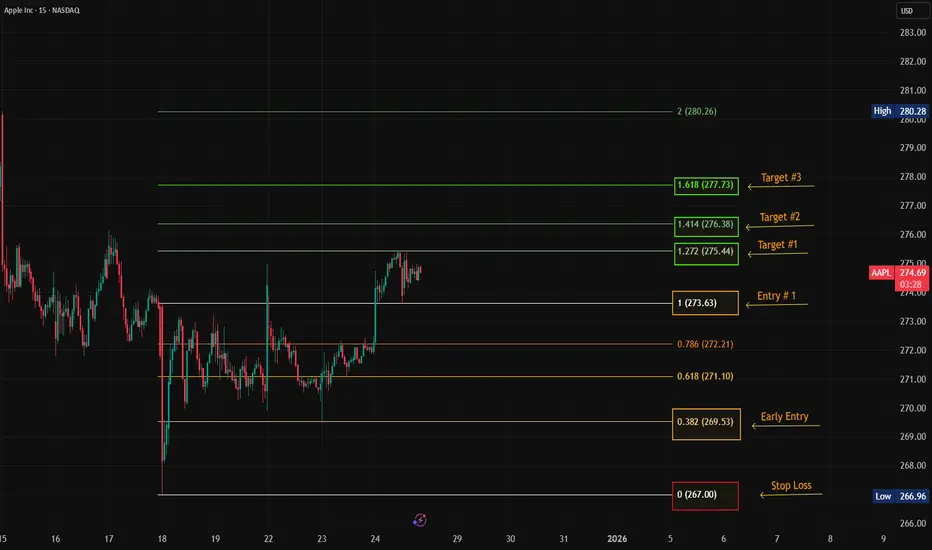
Update On $AAPLGreat Entry! Stop Loss never Triggered. 275 Calls did well this week! NASDAQ:AAPL is priming up for a bigger MOVE! Price rejected the 1.272 level HARD and went back to the 1 level and now attempting the 1.272 again. It wouldn't be surprising if price wanted to go to .786 or 0.618 to find liquidity before proceeding, so keep that in mind as well.
P.S. Do not insult what you lack understanding of. Its not a good look. Tradingview dont let you delete hatin' ahh comments. Its a Stain on your name LOL.
Also, there is nothing bad in being wrong, how else will one learn? Stay positive and optimistic!
Happy Trading Alerts Set!
Stock Market Forecast | BTC TSLA NVDA AAPL AMZN META MSFTQQQ stock market Forecast
Nvidia Stock NVDA Forecast
Apple Stock AAPL Forecast
Microsoft Stock MSFT Forecast
Google Stock GOOGL Forecast
Amazon Stock AMZN Forecast
Meta Forecast Technical Analysis
Tesla Stock TSLA Forecast
Magnificent 7 stocks forecast
Bitcoin CRYPTOCAP:BTC forecast
SP:SPX NASDAQ:NDX CME_MINI:ES1!

AAPLApple's recent record-breaking stock price may create an illusion of invulnerability.
However, serious structural problems are simmering beneath the surface
1. Soaring Memory Prices: A Direct Hit on Margins
DRAM and NAND (memory chip) prices have soared 50-300% since the beginning of 2025 due to surging demand from AI servers.
74% of Apple's revenue comes from hardware (iPhone, Mac, iPad), where memory is a critical component of the cost. Analysis indicates that if Apple is forced to purchase memory at market prices, this could impact its gross margin by approximately 4.9%.
Long-term contracts with Samsung, SK Hynix, and Micron are currently shielding Apple. Crucially, current preferential DRAM supply agreements expire in December 2025.
Samsung and SK Hynix are reportedly planning to significantly raise chip prices for NASDAQ:AAPL starting in January 2026.
2. Weak Position in the AI Race and Key Talent Attrition
🔎

$AAPLNASDAQ:AAPL you owe Me. Lets Get it. Big Bounce back candle is being ENGULFED by green buy candles, so 1.272, 1.414 & 1.618 are all target for this Light show.
Happy Trading, Alerts Set!

$AAPL Two-Way Plan: Sell Strength, Buy Structure🍎 ASSET OVERVIEW
Asset: NASDAQ:AAPL — Apple Inc.
Exchange: NASDAQ
Style: Swing Trade
Market Context: Extended price action near resistance with overbought signals, followed by potential mean reversion toward moving average structure.
🧠 MARKET PLAN (PROFESSIONAL + FUN VIBE)
📉 PHASE 1 — SHORT-TERM BEARISH BIAS
Price is currently overextended, sitting near a strong resistance zone with signs of buyer exhaustion.
Overbought conditions ⚠️
Resistance + liquidity trap potential
Expectation: Pullback toward the moving average
📈 PHASE 2 — STRUCTURED BULLISH PULLBACK
After the retracement, trend continuation is possible if price respects the dynamic moving average support near 267.00.
This is a two-scenario plan, not prediction — react, don’t predict.
🎯 EXECUTION LEVELS
🔴 Entry (Bearish Leg)
Sell: Current price zone (into resistance / overextension)
🟢 Buy Zone (Bullish Pullback)
Buy: Near Moving Average Support @ 267.00
🛑 RISK MANAGEMENT (ADJUSTABLE)
Bearish Stop Loss: @ 278.00
Bullish Stop Loss: @ 260.00
⚠️ Dear Ladies & Gentlemen (Thief OGs)
These stop levels are reference points only.
Risk management is personal — adjust position size and stops based on your own strategy and risk tolerance.
🎯 TARGETS
📉 Bearish Objective
Target: Near Dynamic Moving Average Support @ 267.00
📈 Bullish Continuation Objective
Target: 288.00
🚨 Strong resistance + prior overbought zone suggests partial profit booking is smart.
Market gives, market takes — protect gains.
⚠️ Dear Ladies & Gentlemen (Thief OGs)
These targets are not mandatory — manage profits at your discretion.
🔗 RELATED PAIRS & CORRELATED WATCHLIST
Keeping an eye on correlated instruments can confirm or invalidate this setup:
NASDAQ:NDX / PEPPERSTONE:NAS100 📊
Apple is a heavyweight — weakness or strength here directly impacts AAPL momentum.
SP:SPX / AMEX:SPY 🏦
Broad market risk sentiment helps confirm pullback sustainability.
NASDAQ:QQQ 🚀
Tech ETF correlation — divergence may signal early reversal or continuation.
NASDAQ:MSFT & NASDAQ:NVDA 🧠
Relative strength comparison within mega-cap tech.
🧩 KEY TAKEAWAYS
Trade the reaction, not emotions
Respect moving average dynamics
Scale wisely, protect capital
No single bias — adapt with structure
✨ “If you find value in my analysis, a 👍 and 🚀 boost is much appreciated — it helps me share more setups with the community!”
⚠️ DISCLAIMER
This is a thief-style trading strategy just for fun 🎭
Educational & entertainment purposes only — not financial advice.
Always do your own analysis and manage risk responsibly.
#AAPL #Apple #NASDAQ #SwingTrading #Pullback #MovingAverage
#PriceAction #MarketStructure #RiskManagement #TraderCommunity
#TechnicalAnalysis #Stocks #USMarkets #TradingView

Apple - $265 Target, Shorts Catching Up, Losing the AI WarThe shorts seem to be catching up on the indicators with the bullish trendline breaking in support. Apple is also losing the AI wars, at least figuratively speaking (to some), and at the same time people are uncertain about earnings in 43 days. As always, none of this is investment or financial advice. Please do your own due diligence and research.

$AAPL On the Move NASDAQ:AAPL Look just like the rest of them with the HARD rejection at -0.414 & -0.272. The Chart Explains it self for the Most Part. The Risk to Reward Ratio is Super Litty!. A whole lot to get and not too much to lose. Stay Discipline and yall will be just FINE.
Alerts Sets, Happy Trading!
TUESDAY is my Favorite day of the Week, Its random as hell.

Apple Inc. Swing Setup – Breakout or Breakdown Ahead?🍎 AAPL | Apple Inc. - Swing Trade Profit Blueprint 💰
NASDAQ: AAPL | Breakout Pattern Setup ⚡
Master the Swing Trade Game 🎯
📊 TECHNICAL OVERVIEW
Currently trading at $268.47 with strong momentum indicators aligning for a breakout scenario. Apple is positioned in a critical decision zone with defined technical levels offering professional risk/reward opportunities.
🎲 Market Structure: Tight consolidation phase with multiple confluences at key resistance and support zones.
📈 SWING TRADE SETUP - DUAL SCENARIO ANALYSIS
SCENARIO 1: BULLISH BREAKOUT 🚀
Entry Signal: Price breaks above resistance with volume confirmation
Entry Zone: Above $272.00 (Daily Close Confirmation)
Initial Target: $290.00 TP1 🎯
Extended Target: $295.00 TP2 (Ultimate Profit Zone) 🏆
Stop Loss: $264.00 (Risk Management Point) 🛑
SCENARIO 2: BEARISH BREAKDOWN 📉
Entry Signal: Price breaks below support with selling pressure
Entry Zone: Below $266.50 (Daily Close Confirmation)
Target 1: $262.00 TP1 🎯
Target 2: $256.00 TP2 (Profit Protection Zone) 🏆
Stop Loss: $276.00 (Risk Management Point) 🛑
🔍 KEY TECHNICAL FACTORS
✅ Momentum Alignment: Multiple timeframe convergence detected
✅ Volume Profile: Above average volume supporting breakout potential
✅ Support/Resistance: Well-defined levels from historical price action
✅ RSI Positioning: Neutral to strong momentum setup
✅ Moving Averages: Key dynamic support levels in play
🎯 SCENARIO CORRELATION PAIRS TO MONITOR
Primary Correlations:
🔗 NASDAQ:MSFT (Microsoft) - Tech sector strength indicator | Tech giants move together | Watch for divergence signals
🔗 NASDAQ:QQQ (Nasdaq-100 ETF) - Broader market direction | If QQQ breaks down, AAPL pressure increases | Use as macro confirmation
🔗 AMEX:VGT (Vanguard Info Tech ETF) - Sector sentiment gauge | Tech rotation plays | Confirms sector health
🔗 AMEX:IVV (iShares S&P 500 ETF) - S&P 500 correlation | Broad market support/resistance | Risk-on/risk-off indicator
🔗 AMEX:GLD (Gold) - Risk sentiment inverse correlation | Gold up = Risk-off = Tech pressure | Macro economic climate
📍 IMPORTANT REMINDERS FOR TRADERS
Your Entry Is Your Choice ✓ Only enter when YOUR checklist is complete
Your Stop Loss Is Your Decision ✓ Set it where YOU feel comfortable with risk
Your Take Profit Is Your Call ✓ Exit when your profit target is achieved or thesis breaks
Every trader's risk tolerance differs. These levels are technical reference points, not personal recommendations.
🎓 STRATEGY NOTES
✨ Best used on 1H-4H timeframes for swing trading
✨ Volume confirmation is CRITICAL before entries
✨ Wait for candle closes above/below levels - no wick trading
✨ Use this alongside your own technical analysis
✨ Market conditions can invalidate setups rapidly - stay flexible
✨ The breakout zone is where patience rewards traders
💡 CORRELATION SUMMARY
Green Lights ✅: When MSFT, QQQ, and VGT all confirm uptrend = Stronger AAPL bullish case
Yellow Caution ⚠️: When divergence appears between AAPL and QQQ = Possible reversal warning
Red Lights 🔴: When GLD spikes & IVV breaks support = Risk-off environment = Tech pressure incoming
✨ If you find value in my analysis, a 👍 and 🚀 boost is much appreciated — it helps me share more setups with the community!
Stock Market Forecast | BTC TSLA NVDA AAPL AMZN META MSFTStock Market Forecast | CRYPTOCAP:BTC CME_MINI:ES1! CME_MINI:NQ1! SP:SPX
Mag 7 | TSLA NVDA AAPL AMZN META MSFT GOOGL

QuantSiganls V3 AAPL Call Opportunity – Jump on the Momentum!Instrument: AAPL
Direction: BUY CALLS (LONG)
Confidence: 58% (Low-Medium)
Conviction Level: LOW–MEDIUM
Expiry: 2025-12-12 (2–3 days)
Recommended Strike: $277.50
Entry Price: $2.50 (range: $2.48–$2.52)
Target 1: $3.50 (≈40% gain)
Target 2: $4.25 (≈70% gain)
Stop Loss: $1.75 (≈30% loss)
Position Size: 2% of portfolio
Weekly Momentum: NEUTRAL (+0.13% 1-week)
Flow Intel: Bullish (Low P/C Ratio, PCR 0.68)
Risk Level: HIGH – low conviction, short-term expiry, moderate gamma risk
Technical Summary:
Current price ~$278.22 in tight daily range ($276.10–$280.03)
VWAP at $277.66 provides immediate support
Resistance at $280, support at $276.10
Oversold stochastics and bullish MACD divergence signal rebound potential
News / Catalysts:
Positive analyst rating: Citigroup Buy target $330 (+19%)
Apple CEO discussions at Capitol Hill potentially favorable for regulation
Sector news mixed, no major negative catalysts
Options / Flow Summary:
Put/Call Ratio 0.68 → bullish institutional positioning
High call volume at $288 strike, low IV → cheap option premiums
Gamma risk high heading into expiration
Katy AI Notes:
Katy AI: NEUTRAL trend, 50% confidence, slight upside bias
Flow-override trade due to bullish institutional options activity and technical setup
Trading Notes / Risk Management:
Enter near VWAP support
Tight stop loss (30%) to limit downside
Monitor early price action and manage gamma exposure carefully
Consider taking profits at Target 1 if momentum stalls

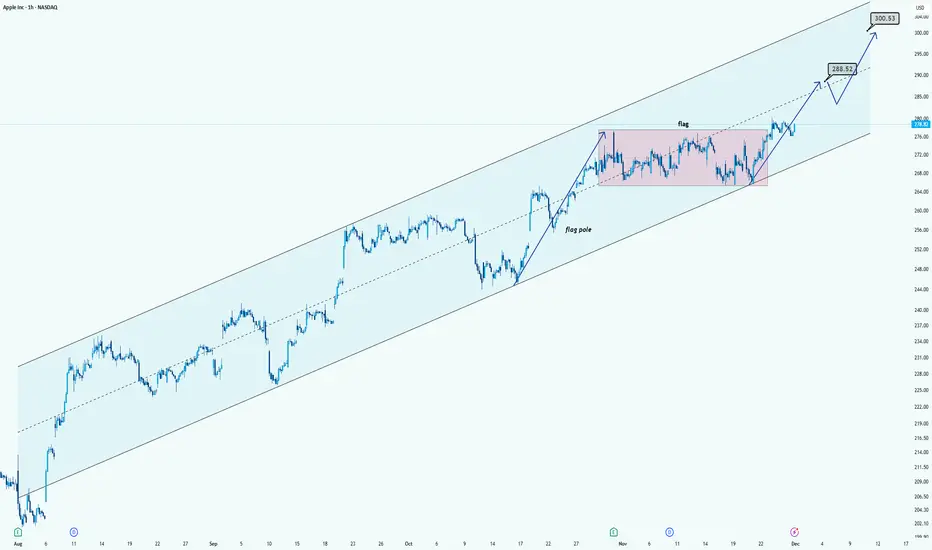
AAPL Chart AnalysisHi!
AAPL is trading inside a clean long-term ascending channel, showing a strong uptrend. Recently, the price formed a bullish flag (pink zone) after a sharp move up. The breakout above the flag signals continuation of the trend.
The chart projects two key upside levels:
$288.52 as the first target (flag breakout objective / mid-channel resistance)
$300.53 as the second target (upper channel boundary + psychological level)
As long as price stays above the flag range and respects the channel, the bullish structure remains intact.
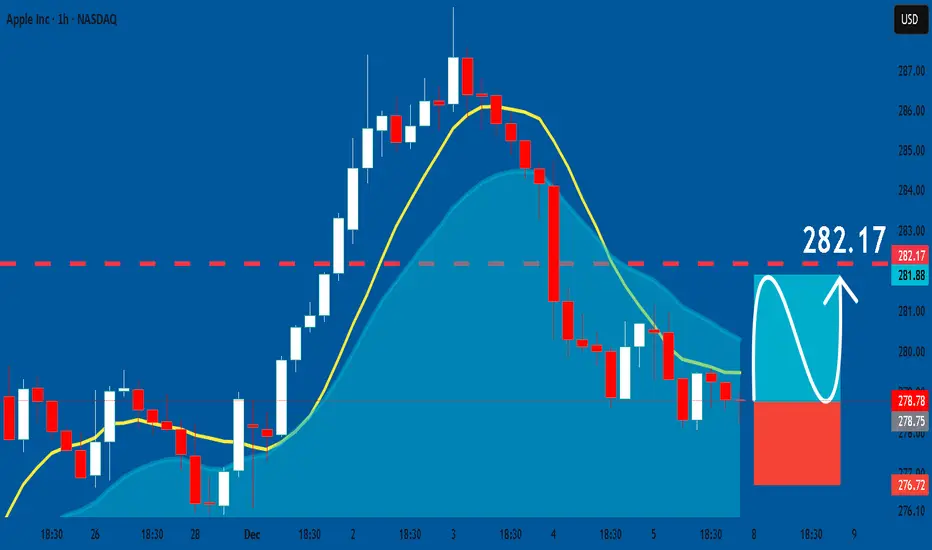
APPLE: Bullish Continuation & Long Signal
APPLE
- Classic bullish pattern
- Our team expects retracement
SUGGESTED TRADE:
Swing Trade
Buy EURUSD
Entry - 278.78
Stop- 276.72
Take - 282.17
Our Risk - 1%
Start protection of your profits from lower levels
Disclosure: I am part of Trade Nation's Influencer program and receive a monthly fee for using their TradingView charts in my analysis.
❤️ Please, support our work with like & comment! ❤️