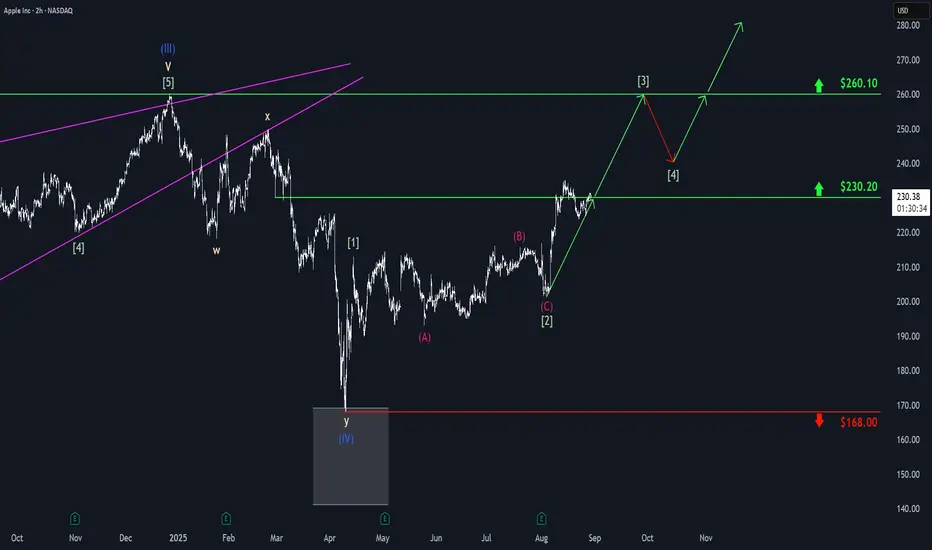
Apple: Another Run at Key ResistanceApple shortly dipped back below the $230.20 mark but has since begun another push higher. We expect the stock to soon break through the $230.20 level sustainably and – as part of the green wave – move up toward the next major resistance at $260.10. The following wave pullback should remain above $230.20, allowing the broader green upward trend to continue gaining momentum.
AAPL
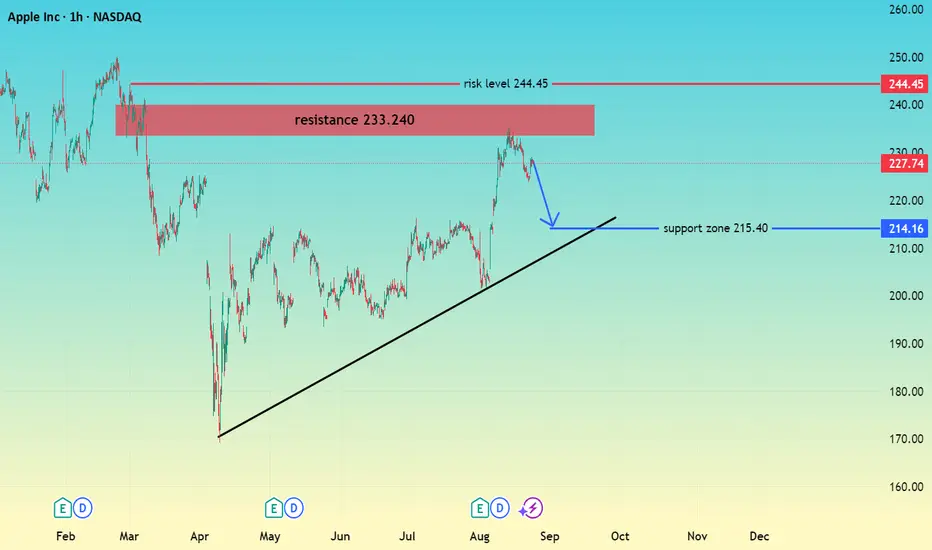
AAPL RESISTANCE 233VS SUPPORT 215 hi trader's
Apple price is testing a major resistance zone around 233 – 240.
If sellers hold this resistance, a retracement toward the 215.40 support zone and trendline is possible.
A sustained break above the 244.45 risk level would invalidate this bearish view and may open the way for higher prices
Resistance Zone: 233 – 240
Support Zone: 215.40
Risk Level ( 244.45
don't forget to like comment and follow
Is Fridays Bounce a Bull Trap?CME_MINI:NQ1! CME_MINI:ES1! stock market Forecast
Nvidia Stock NASDAQ:NVDA Forecast
Apple Stock NASDAQ:AAPL Forecast
Microsoft Stock MSFT Forecast
Google Stock GOOGL Forecast
Amazon Stock AMZN Forecast
Meta Forecast Technical Analysis
Tesla Stock TSLA Forecast
Magnificent 7 stocks forecast

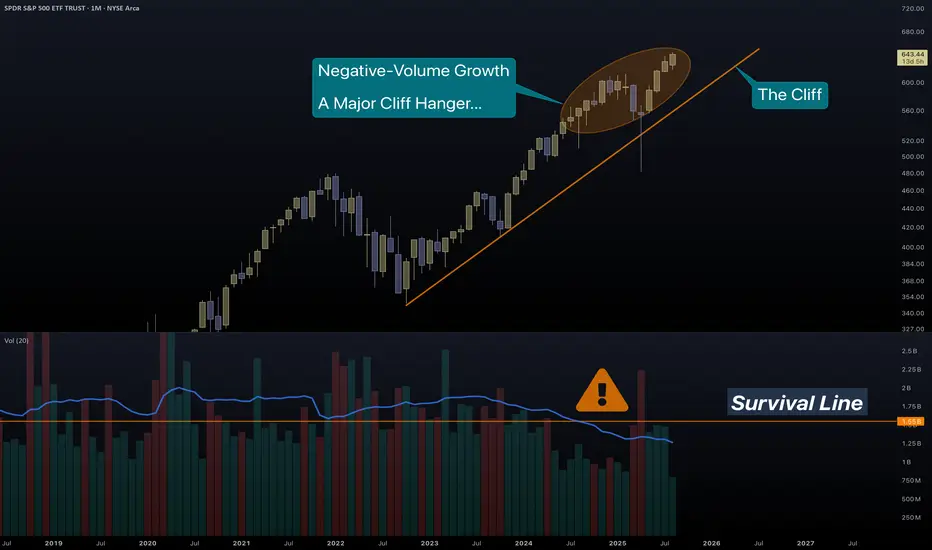
SPY | Leap of Doom?SPY just jumped...
The wrong way up!
To sustain you must conserve. To climb up a hill, you need energy, resources like food and water. The energy they give you far out-weighs their absolute mass. Therefore it makes sense for you to carry them.
And they have taken you very far...
But now you have run out of energy.
Price growth needs transaction volume to have strength and meaning.
You are too light(headed) to realize that moving further up is a dead-end.
THIS IS NOT SOMETHING SMALL.
SPY is one of the largest Funds in the world. A first-ever major violation of volume trend, in such a big index, must not be ignored. Imagine what is happening underneath...
Look at some examples:
NVDA
The most massive of companies, has a multi-year issue with volume.
MSFT
Unlike its first growth, Microsoft has a tremendous loss of strength in volume metrics.
Such long-term drop in volume means that companies offload real stocks for cheap futures .
We witness the same with Bitcoin...
And gold...
Not quite doomed yet, but troublesome still.
TSLA
Tesla with their shiny and financially pointless cars, has made a pointless growth. Just like many stocks as you will soon realize.
AAPL
The masses, even though their name suggests that they have some matter, in reality they don't. 10% of people have 90% of wealth. Investors have long left Apple, leaving the hoard inside to bubble up the dream.
There is more and more proof that the Fab5 (well the Fab500 as we can see from SPY/SPX) are replacing stocks with derivatives. Real money replaced by weapons of mass destruction, just like Warren Buffett said.
Good luck to us all...
PS. Something irrelevant to stocks, but relevant to the fundamentals of investing in AAPL.
Judging by the recent UI decisions, they trapped the users in bubbles and they are unable to see the truth. Brilliantly, they changed the name of soap bubbles to liquid glass. (bubbles are shiny, crystals are rough).
As a long-time Apple user, now not much of an Apple lover, I know quite well the changing philosophy of them. iPhone (and all products) began as a phone for the "smart" ones and ended up the No1 desire for the masses.
After a decade, I have switched to Fedora Silverblue for 90% of my leisure.
DAX/GER30 SHORT/LONG sequence Swing Trade +500/+500 points 🔸Hello traders, let’s review the 2hour chart for GER30/DAX. Strong recovery from recent lows, however price testing key resistance and support zones where major reactions are expected.
🔸Speculative setup defined by resistance at 24,500 and key S/R demand zone at 24,000. Both zones have recently been validated with +500 point reactions.
🔸Currently both resistance and support levels are respected and price action remains technical around these areas.
🔸Recommended strategy for DAX traders:
Short Sell at Market from resistance 24,500
SL above resistance, TP 24,200 / 24,100 / 24,000.
Buy & Hold Long from key S/R 24,000
SL below support, TP 24,300 / 24,400 / 24,500.
🎁Please hit the like button and
🎁Leave a comment to support our team!
RISK DISCLAIMER:
Trading Futures, Forex, CFDs and Stocks involves a risk of loss.
Please consider carefully if such trading is appropriate for you.
Past performance is not indicative of future results.
Always limit your leverage and use tight stop loss.

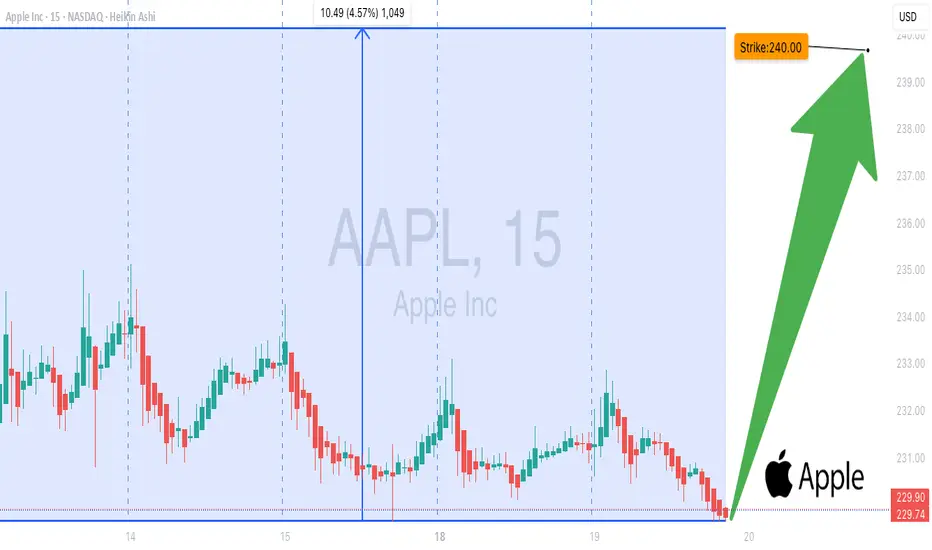
AAPL Weekly Options: $240 Call in Play!
# 🍏💥 AAPL \$240 Call Weekly Trade Setup (Aug 18, 2025) 🚀🔥
### **Market Snapshot**
📊 **Daily RSI / Weekly RSI:** Falling → Neutral ⚖️
📉 **Volume:** Weak (0.6x vs last week) 🚨
🔥 **Options Flow:** Strong bullish calls (1.84 C/P ratio) 💎
✅ **Volatility:** VIX \~15 → Favorable conditions 🌈
💡 **Overall Bias:** Moderate Bullish (but cautious on volume & momentum)
---
### **Model Highlights**
* **Agreement:**
* Weak institutional volume 📉
* Strong call buying sentiment 🔥
* Falling RSI → caution ⚠️
* **Disagreement:**
* Some lean **moderate bullish** 📈
* Others advise **no trade** due to weak confirmations ❌
---
### **💥 Trade Recommendation**
🎯 **Strategy:** Naked Call
* 🍏 **Instrument:** AAPL
* 💵 **Strike:** \$240 Call
* 🗓️ **Expiry:** Aug 22, 2025
* 💰 **Entry Price:** \$0.63
* 🎯 **Profit Target:** \$1.22 (up to 100%)
* 🛑 **Stop Loss:** \$0.37
* ⏰ **Entry Timing:** Market Open
* 📈 **Confidence:** 65%
⚠️ **Risks:**
* Momentum exhaustion 💤
* Weak volume = fragile bullish setup 🚨
* Gamma risk moderate ⚖️
---
### **Trade JSON**
```json
{
"instrument": "AAPL",
"direction": "call",
"strike": 240.00,
"expiry": "2025-08-22",
"confidence": 0.65,
"profit_target": 1.22,
"stop_loss": 0.37,
"size": 1,
"entry_price": 0.63,
"entry_timing": "open",
"signal_publish_time": "2025-08-18 14:38:09 UTC-04:00"
}
```
📊 **Quick Trade Recap:**
🎯 CALL \$240 | 💵 \$0.63 → 🎯 \$1.22 | 🛑 \$0.37 | 📅 Aug 22 | 📈 65%
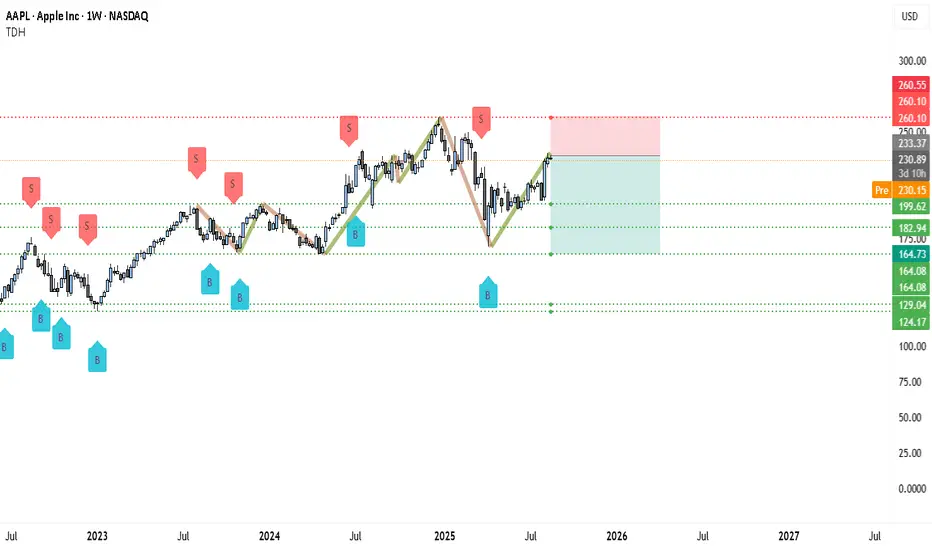
AAPL Headed for Breakdown? Bears Eye $182 Support🍎 AAPL Weekly Chart Analysis — Bearish Outlook
Apple (AAPL) is trading near $230–233 on the weekly chart after staging a rebound from early 2025 lows. The chart, however, shows a clear double-top pattern around the $260.10–260.55 resistance zone (red dashed line), which has repeatedly acted as a ceiling. Each test of this zone has been followed by sharp corrections, and the most recent “S” (sell) marker confirms this rejection area as a strong supply zone.
The latest rally has brought price back toward resistance, but structure-wise AAPL is printing lower highs and lower lows since mid-2024. The bounce into $230–233 looks more like a relief rally within a larger corrective phase rather than a fresh bullish trend.
________________________________________
🔎 Bearish Justifications
• Double/Triple Resistance Layer: $260 has capped price multiple times. Without a clear weekly close above it, bears remain in control.
• Trend Structure: From July 2024 peak to early 2025 lows, price made a decisive lower low. The current rally has failed to reclaim that structure.
• Volume Trap: Weekly candles show waning momentum on rallies—less aggressive buying versus prior uptrends.
• Clean Downside Ladder: The chart highlights green dotted support zones at $199 → $182 → $164 → $129 → $124. If $230–233 fails to hold, price could unwind quickly toward these levels.
________________________________________
🔴 AAPL Short Setup (Weekly Chart)
• Entry Zone: $230–233 rejection area (current price)
• Stop-Loss: Above $260.55 (strong invalidation level, beyond supply zone) ❌
• Target 1: $199 (psychological + technical support, book partial profits ✅)
• Target 2: $182.94 (major mid-term support, lock more gains 🔒)
• Target 3: $164.73 (deeper corrective target if selling accelerates 📉)
• Stretch Target: $129–124 if broader market weakness hits tech
________________________________________
⚠️ Risk & Trade Management
Given that this is a weekly timeframe setup, swings will be larg6e and volatile. Position sizing should be smaller than usual because stops and targets are wide. Booking partial profits at $199 and $182 is essential — this way, you reduce risk exposure and can let the remainder run. If AAPL surprisingly pushes above $260 and closes strong, the bearish thesis is invalid and shorts should exit rather than hold against trend.
✅ In summary, AAPL looks heavy under $260, with the current bounce likely a retracement rally rather than fresh bullish strength. Unless bulls can flip $260 into support, the chart favors a short bias with targets at $199 → $182 → $164.
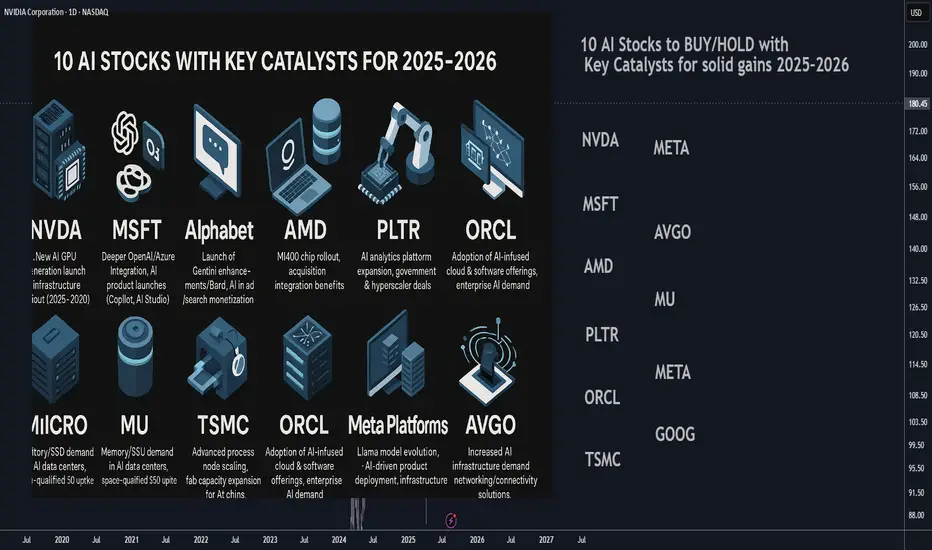
10 AI Stocks to BUY/HOLD with Key Catalysts for solid gains 202510 AI Stocks to BUY/HOLD with Key Catalysts for solid gains 2025–2026
________________________________________
1. NVIDIA (NASDAQ: NVDA)
• Catalyst: Expansion of AI infrastructure via new GPU generations (e.g., Blackwell), continued dominance in AI training/deployment. Regulatory/availability clarity in key markets like China could also drive demand.
• Highlights: Leader in AI GPUs; high analyst upgrades and raised targets; strong global demand from data centers and hyperscale AI deployments.
________________________________________
2. Microsoft (NASDAQ: MSFT)
• Catalyst: Deepening integration of AI across products and services (e.g., Office, Teams), OpenAI partnership further embedded in Azure services, AI product launches (Copilot, AI Studio).
• Highlights: Extensive cloud & enterprise reach; strong balance sheet; strategic positioning as AI infrastructure and application leader.
________________________________________
3. Alphabet (NASDAQ: GOOGL)
• Catalyst: Rollout of key AI products (e.g., Gemini, Bard enhancements), continued monetization of AI in search & advertising, rising AI-related cloud license revenue.
• Highlights: Core AI research leader; growing earnings momentum; sustained institutional inflows and investor confidence tied to AI growth.
________________________________________
4. AMD (NASDAQ: AMD)
• Catalyst: Launch of AI-optimized server chips (e.g., MI400 series), integration of AI functionality in CPUs/GPUs, synergy from Xilinx and Silo AI acquisitions.
• Highlights: Aggressive roadmap in AI compute; acquisitions bringing AI IP and talent; gaining share in AI server ecosystem.
________________________________________
5. Palantir (NYSE: PLTR)
• Catalyst: Expansion of AI-driven government and commercial contracts, rollout of AI-enabled analytics platforms such as Palantir AI suite, new hyperscaler partnerships.
• Highlights: AI-analytics leader with strong public-sector footprint; pivoting toward cloud-based AI; high-margin recurring revenue potential.
________________________________________
6. Micron Technology (NASDAQ: MU)
• Catalyst: Accelerated demand for AI-optimized memory and storage (e.g., HBM, SSDs); uptake of Micron's AI/space-qualified SSDs; expansions into AI data center deployments.
• Highlights: Strong sequential performance in earnings; double-digit growth in AI segments; positioned as non-GPU hardware beneficiary of AI boom.
________________________________________
7. TSMC (NYSE: TSM)
• Catalyst: Scaling advanced process nodes (e.g., N3E, N2) to support AI chips, capacity expansion initiatives, securing AI chip orders from Nvidia, AMD, and other fabless players.
• Highlights: Global leader in semiconductor foundry; high-barrier-to-entry business model; direct beneficiary of AI silicon ramp-up.
________________________________________
8. Oracle (NYSE: ORCL)
• Catalyst: Launch and adoption of Oracle Cloud AI capabilities (OCI AI, embedded ML), AI-driven Oracle Fusion applications, increasing AI-related capex by enterprise customers.
• Highlights: Strong enterprise penetration; AI-infused software suite; renewed investor interest from hedge funds targeting AI exposure.
________________________________________
9. Meta Platforms (NASDAQ: META)
• Catalyst: Continued investment in large-scale AI infrastructure (data centers), Llama 3 and generative AI models, new AI products in social, AR/VR, and enterprise.
• Highlights: Massive AI compute investments; pioneering open models like Llama; turning AI into a core product strategy beyond social media.
________________________________________
10. Broadcom (NASDAQ: AVGO)
• Catalyst: AI-related semiconductor solutions (e.g., networking, connectivity, acceleration) embedded in data center infrastructure, demand from AI workload networking.
• Highlights: Integral player in AI infrastructure as part of the “Fab 4”; diversified exposure across chips critical for AI workloads.
________________________________________
How to Monitor These Catalysts
• Product Launches & Roadmap Updates (e.g., NVDA GPU release events, AMD MI400 launch, META model updates)
• Earnings Calls / Financial Guidance revealing AI revenue — especially with MSFT, GOOGL, ORCL, MU, and AVGO
• Partnership or Contract Announcements — e.g., Palantir industry deals, Oracle enterprise AI deployments
• Capacity & Scaling News — e.g., TSMC fab expansion, Micron memory contracts, Meta data center buildouts
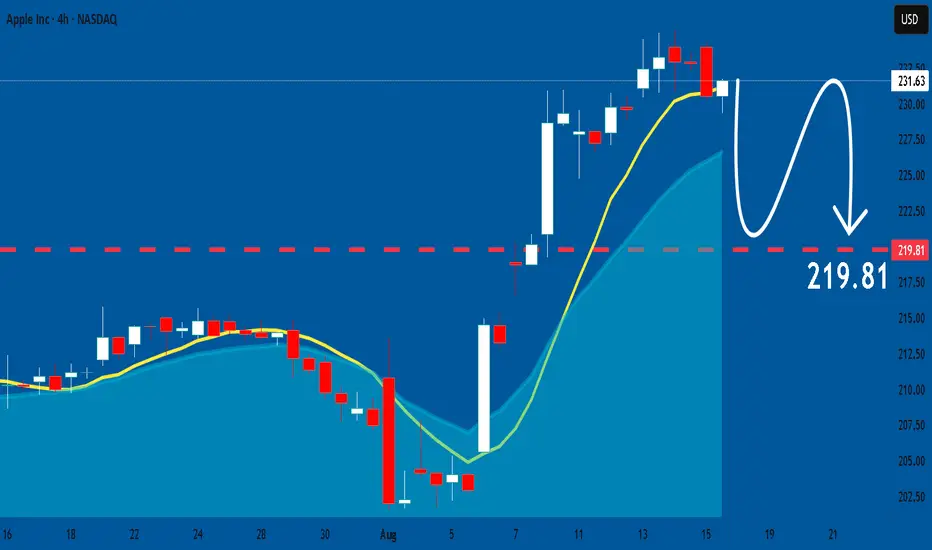
APPLE: Expecting Bearish Movement! Here is Why:
Looking at the chart of APPLE right now we are seeing some interesting price action on the lower timeframes. Thus a local move down seems to be quite likely.
Disclosure: I am part of Trade Nation's Influencer program and receive a monthly fee for using their TradingView charts in my analysis.
❤️ Please, support our work with like & comment! ❤️
Stock Market Forecast | TSLA NVDA AAPL AMZN META MSFTQQQ CME_MINI:NQ1! CME_MINI:ES1! stock market Forecast
Nvidia Stock NASDAQ:NVDA Forecast
Apple Stock AAPL Forecast
Microsoft Stock MSFT Forecast
Google Stock GOOGL Forecast
Amazon Stock AMZN Forecast
Meta Forecast Technical Analysis
Tesla Stock NASDAQ:TSLA Forecast
Magnificent 7 stocks forecast

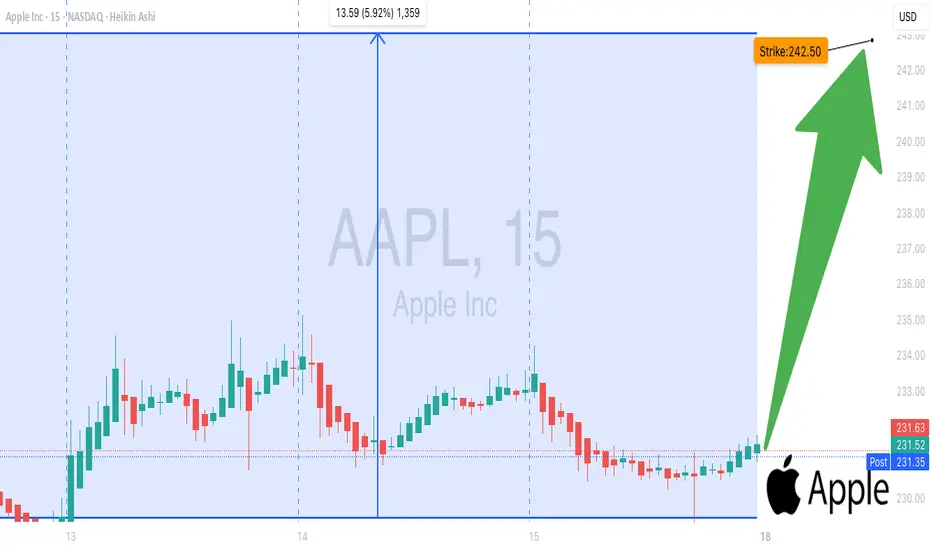
AAPL Bull Call $242.5-- Don’t Miss Out
# 🚀 AAPL Swing Alert – 2025-08-15 🚀
**Sentiment:** Moderate Bullish
**Setup:** Call Option Trade
---
## 📈 Market Snapshot
* **Daily RSI:** Strong bullish momentum
* **Multi-Timeframe Trend:** Positive
* **Call/Put Ratio:** 1.00 → Neutral flow
* **Volume:** Weak → Watch for institutional hesitation
* **VIX:** Low → Favorable for controlled swing trades
* **Resistance:** \$235.12 → Potential consolidation or pullback
---
## ⚖️ Consensus & Conflicts
**Agreement:**
* Technical indicators support bullish outlook
* Low VIX creates favorable conditions for swing trades
**Disagreement:**
* Volume metrics: some models prefer waiting for confirmation
* Psychological & fundamental resistance levels may stall momentum
---
## 🎯 Trade Setup – AAPL CALL
**Entry Condition:** Market open
**Strike:** \$242.50
**Expiration:** 2025-08-29
**Entry Price:** \$0.90
**Confidence:** 72%
**Profit Target:** \$2.65
**Stop Loss:** \$0.85
**Key Risks:**
* Weak volume may limit momentum sustainability
* Price near \$235.12 resistance → potential pullback
* Overbought RSI → watch for corrections
---
## 📝 TRADE DETAILS (JSON)
```json
{
"instrument": "AAPL",
"direction": "call",
"strike": 242.50,
"expiry": "2025-08-29",
"confidence": 0.72,
"profit_target": 2.65,
"stop_loss": 0.85,
"size": 1,
"entry_price": 0.90,
"entry_timing": "open",
"signal_publish_time": "2025-08-15 13:34:40 UTC-04:00"
}
```
---
## 📊 Quick Reference – TradingView Ready
🎯 **Instrument:** AAPL
🔀 **Direction:** CALL (Long)
💵 **Entry Price:** \$0.90
📈 **Profit Target:** \$2.65
🛑 **Stop Loss:** \$0.85
📅 **Expiry:** 2025-08-29
📏 **Size:** 1 contract
⏰ **Entry Timing:** Market Open
🕒 **Signal Time:** 2025-08-15 13:34 EDT
---
### Suggested Viral Title & Tags
**🔥 AAPL Swing Alert: Call Strike \$242.50 Ready 🚀**
\#AAPL #SwingTrade #OptionsTrading #Bullish #CallOption #Momentum #TradeSetup #TechnicalAnalysis #StockAlerts #Finance #TradingSignals #MarketWatch #LongTrade
Apple Is Climbing the Fibonacci Channel Ladder – Step 5 Ahead?On the monthly chart, Apple (AAPL) is steadily moving within a well-defined ascending Fibonacci channel, like climbing a ladder — step by step.
The price is currently testing Step 4 , a zone that has acted as a strong resistance barrier.
Despite the pressure here, the structure still appears bullish, and even a minor pullback might simply be a pause before the next move.
If momentum picks up, we could soon see a breakout toward the next step — targeting 234 at Step 5.
The trend remains technically intact unless the channel is broken, and the overall formation still leans toward continuation.

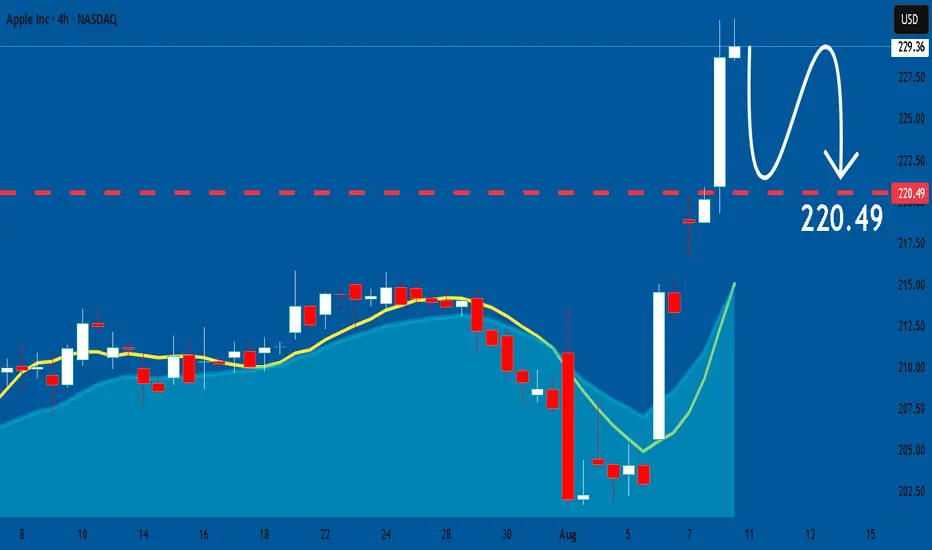
APPLE My Opinion! SELL!
My dear friends,
Please, find my technical outlook for APPLE below:
The price is coiling around a solid key level - 229.36
Bias - Bearish
Technical Indicators: Pivot Points Low anticipates a potential price reversal.
Super trend shows a clear sell, giving a perfect indicators' convergence.
Goal - 221.47
About Used Indicators:
The pivot point itself is simply the average of the high, low and closing prices from the previous trading day.
Disclosure: I am part of Trade Nation's Influencer program and receive a monthly fee for using their TradingView charts in my analysis.
———————————
WISH YOU ALL LUCK

APPLE: Forecast & Trading Plan
Remember that we can not, and should not impose our will on the market but rather listen to its whims and make profit by following it. And thus shall be done today on the APPLE pair which is likely to be pushed down by the bears so we will sell!
Disclosure: I am part of Trade Nation's Influencer program and receive a monthly fee for using their TradingView charts in my analysis.
❤️ Please, support our work with like & comment! ❤️
Stock Market Forecast | TSLA NVDA AAPL AMZN META MSFTStock Market Forecast | CME_MINI:NQ1! CME_MINI:ES1! QQQ SPY
MAG 7 Forecast NASDAQ:TSLA NASDAQ:NVDA AAPL AMZN META MSFT GOOGL

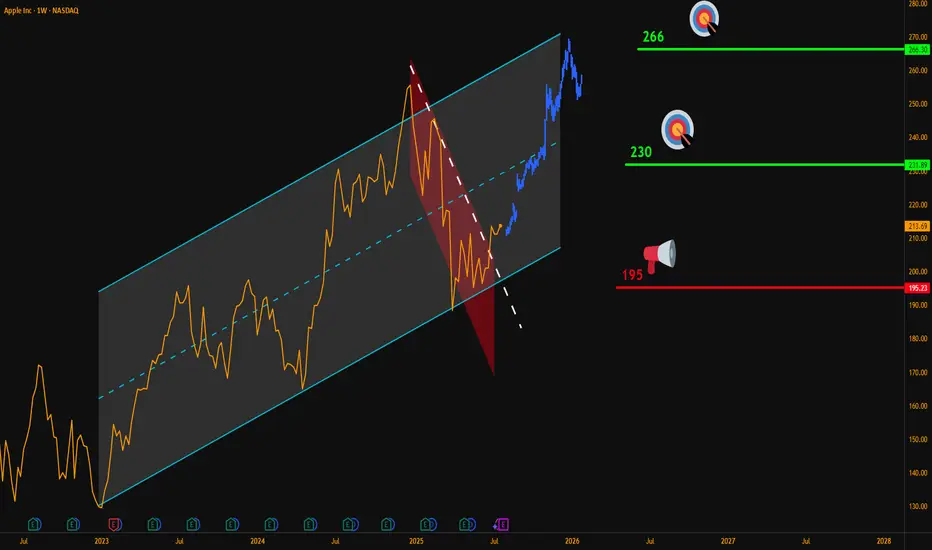
AAPL Weekly Breakout – Targeting $266Hello Traders,
Here’s my latest analysis on Apple (AAPL) based on the weekly chart.
🔍 Chart Breakdown:
Main Uptrend Channel (Blue): Price has respected this channel since 2023.
Red Downtrend Sub-Channel: Recent corrective phase is now broken.
Breakout Signal: Last week, AAPL closed above the sub-channel’s upper line, confirming bullish momentum.
📌 Updated Trade Setup Section:
Entry Zone: Around $215 (current price)
Stop-Loss: Weekly close below $195 (Risk = $20)
Targets:
✅ $230 (Reward = $15 → R:R = 0.75:1)
✅ $266 (Reward = $51 → R:R = 2.55:1)
Always confirm with your own strategy before entering a trade. Position sizing and risk control are key.
💬 Do you think AAPL can reach $266 before Q4 2025? Share your thoughts below!
NASDAQ:AAPL
Apple (AAPL) Shares Surge to Four-Month HighApple (AAPL) Shares Surge to Four-Month High
According to the AAPL price chart, the stock rose to the $220 level yesterday – marking its highest point since early April.
The rally was fuelled by several bullish factors:
→ Trade developments: President Trump announced an additional 25% tariff on goods from India, but notably excluded smartphones – a key point, as a significant portion of iPhones are manufactured there.
→ Seasonal momentum: Apple is approaching its historically strong period. A new iPhone model is traditionally unveiled in September, followed by the start of the holiday shopping season and strong retail demand.
Technical Analysis of Apple (AAPL) Shares
In our previous analysis, we identified an ascending channel (marked in blue) formed by price fluctuations following the April 2025 correction. A bullish reversal (highlighted with an arrow) has provided a basis to update the channel’s slope. In this configuration, the price is now in the upper half of the channel, moving towards its upper boundary.
From a price action standpoint, AAPL's rally is characterised by aggressive upward movement, accompanied by bullish gaps. This is a notable observation, suggesting that while sellers attempted to regain control during a consolidation phase in late July, they lacked conviction – with momentum now favouring the bulls.
This resembles a failed Rounding Top bearish pattern – bulls were able to push the price higher, signalling strong demand.
Potential resistance levels:
→ Near-term: The upper boundary of the channel, reinforced by the $225 level – a price point that has previously acted as a reversal zone.
→ Longer-term: A descending trendline (marked in red), drawn across key highs from recent months.
Bulls might find support at the channel median, which is further reinforced by the former resistance level of $214.
Having risen more than 8% since the start of the week, AAPL now appears overbought in the short term. However, given the strong fundamental backdrop, any potential pullbacks might prove to be shallow.
This article represents the opinion of the Companies operating under the FXOpen brand only. It is not to be construed as an offer, solicitation, or recommendation with respect to products and services provided by the Companies operating under the FXOpen brand, nor is it to be considered financial advice.
AAPL US production lines. Politics or honest long-term strategy?NASDAQ:AAPL is investing into the US. Is it a short-term political move, or an actual genuine intention to "make America great again"?
Let's take a look.
NASDAQ:AAPL
Let us know what you think in the comments below.
Thank you.
75.2% of retail investor accounts lose money when trading CFDs with this provider. You should consider whether you understand how CFDs work and whether you can afford to take the high risk of losing your money. Past performance is not necessarily indicative of future results. The value of investments may fall as well as rise and the investor may not get back the amount initially invested. This content is not intended for nor applicable to residents of the UK. Cryptocurrency CFDs and spread bets are restricted in the UK for all retail clients.

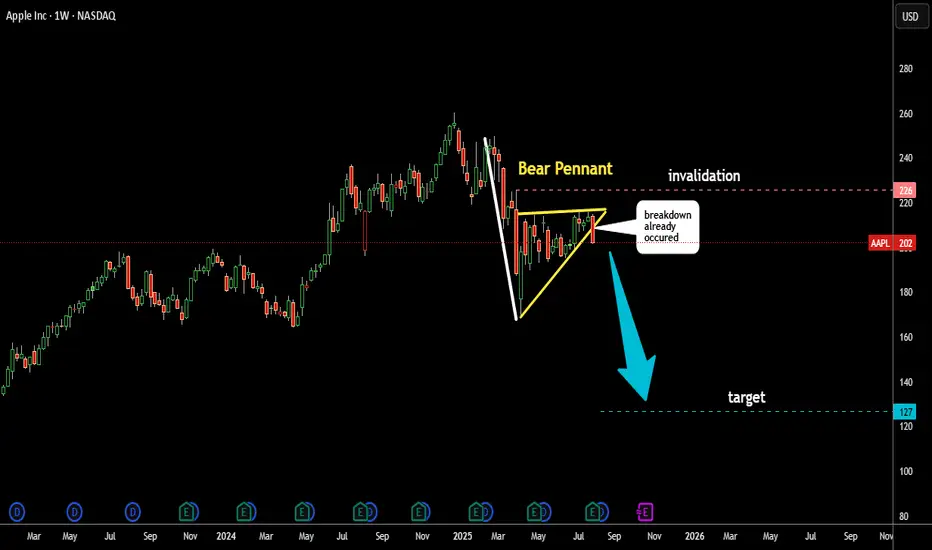
Apple (AAPL): Collapse Is Imminent? Bearish Pennant patternAAPL has already been affected by a Bearish Head & Shoulders reversal pattern earlier this year (see related).
Now, another bearish pattern has formed — a Pennant (highlighted in yellow).
The price has broken below the Pennant’s support, triggering a potential bearish move.
The target is calculated by subtracting the length of the Pole (in white) from the support level of the pattern.
This target is marked with a blue dashed line at $127.
Is Apple melting down again?
I’d love to read your thoughts.
APPLE: Bullish Forecast & Bullish Scenario
The charts are full of distraction, disturbance and are a graveyard of fear and greed which shall not cloud our judgement on the current state of affairs in the APPLE pair price action which suggests a high likelihood of a coming move up.
Disclosure: I am part of Trade Nation's Influencer program and receive a monthly fee for using their TradingView charts in my analysis.
❤️ Please, support our work with like & comment! ❤️
Stock Market Forecast | TSLA NVDA AAPL AMZN META MSFTStock Market Forecast | CME_MINI:NQ1! CME_MINI:ES1! SPY QQQ
Mag 7 Forecast | NASDAQ:TSLA NASDAQ:NVDA AAPL AMZN META MSFT GOOG

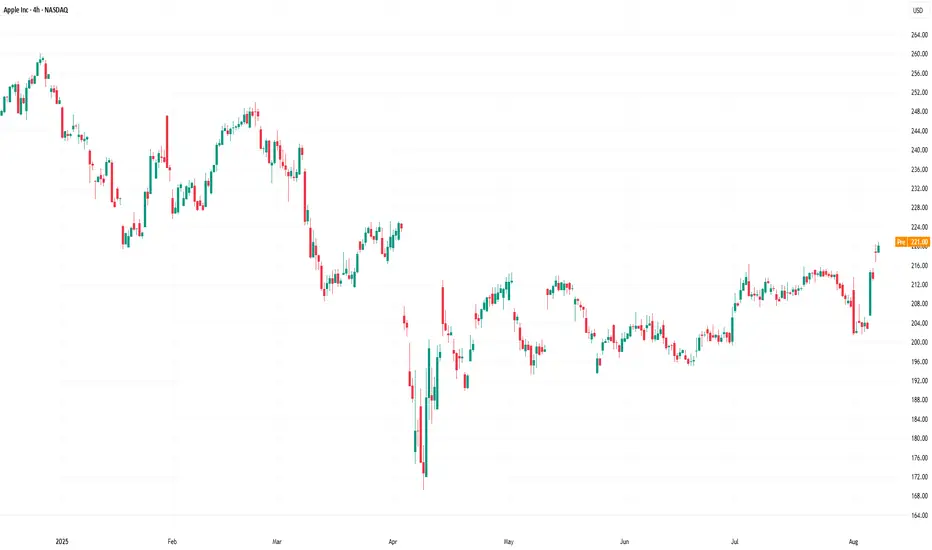
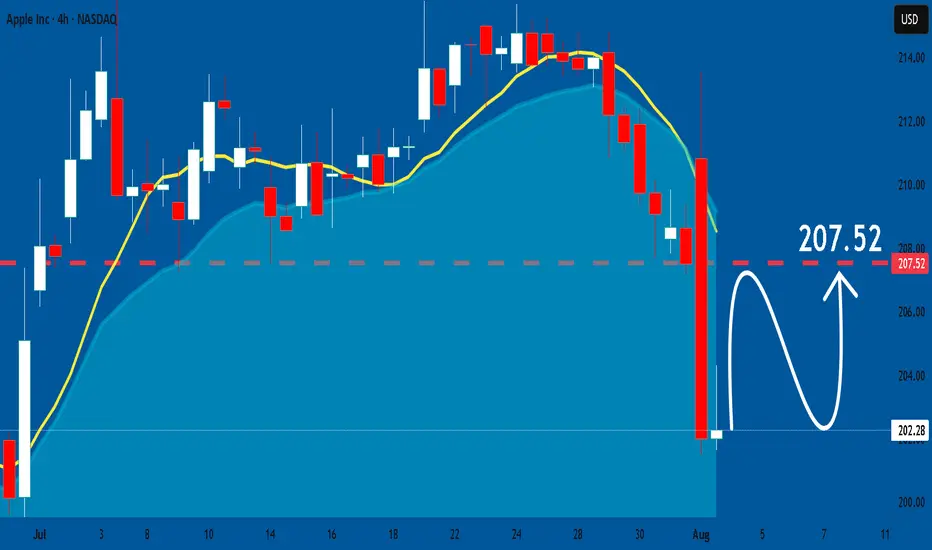
Apple Stock Falls Despite Strong EarningsApple stock is down more than 4% in the final session of the week, following the company’s earnings release yesterday. Apple reported earnings per share of $1.57, beating expectations of $1.43, while total revenue reached $94.04 billion, surpassing the $89.53 billion forecasted by the market.
However, despite the strong results, the stock is once again facing a notable short-term bearish bias as investor concerns grow. The primary issue is the perception that Apple is falling behind in the race for artificial intelligence, especially compared to its main competitors. In addition, shortly after the earnings announcement, it was noted that the company may face challenges in sustaining growth throughout the remainder of 2025, which has fueled additional downward pressure on the stock.
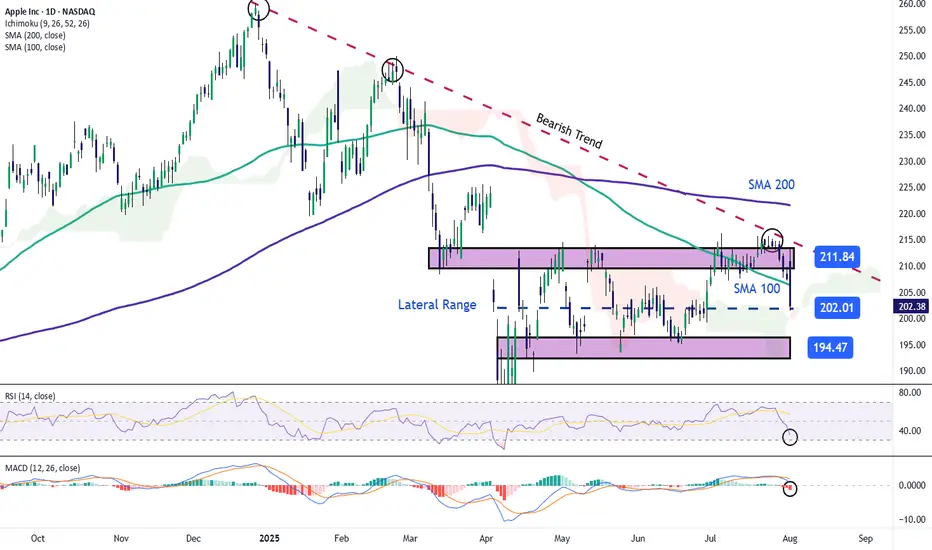
Sideways Range Emerges
In recent weeks, Apple’s price action has consolidated within a clear lateral range, with resistance around $211 and support near $194. So far, price fluctuations have not been strong enough to break this structure, and the latest bearish candlestick has reinforced the validity of the channel. For now, this sideways range remains the most relevant technical formation to watch in the upcoming sessions.
Technical Indicators
RSI:
The RSI line is falling rapidly and is now approaching the oversold zone at the 30 level. If the indicator reaches that threshold, it could suggest a technical imbalance, opening the door to a short-term bullish correction.
MACD:
The MACD histogram has moved into negative territory in recent sessions, suggesting a clear dominance of bearish momentum in the moving average structure. If this persists, selling pressure may continue to build in the near term.
Key Levels to Watch:
$211 – Main Resistance: Upper boundary of the current range. A breakout above this level could trigger a stronger bullish trend.
$200 – Psychological Support: Round number zone, a breakdown here could activate an immediate bearish bias for the next sessions.
$194 – Key Support: Corresponds to recent weekly lows. A move below this level would likely confirm a more extended bearish trend.
Written by Julian Pineda, CFA – Market Analyst
Apple (AAPL) Shares Jump Following Earnings ReportApple (AAPL) Shares Jump Following Earnings Report
Yesterday, after the close of the regular trading session, Apple released its earnings report, which surpassed analysts’ expectations:
→ Earnings per share: actual = $1.57, forecast = $1.43;
→ Revenue: actual = $94.04 billion, forecast = $89.35 billion.
As a result, AAPL shares surged in the post-market, rising from $207.57 to $212.51.
Media Commentary:
→ The company reported a 13% year-on-year increase in iPhone sales.
→ However, according to Tim Cook, tariffs have already cost the company $800 million and this figure could exceed $1 billion in the next quarter.
Technical Analysis of the Apple (AAPL) Stock Chart
Following the volatility in April 2025, price action has justified the construction of an ascending channel (marked in blue). The $216 level, which has acted as a key reference point since March, remains a significant resistance area, because:
→ It has consistently prevented AAPL from reaching the upper boundary of the channel;
→ Even in the wake of a strong earnings report, the price failed to break through this level in post-market trading.
If the $216 level continues to cap gains in the coming days – despite the positive report – the stock might pull back towards the median line of the blue channel (following the post-market rally). This zone often reflects a balance between supply and demand. While such a retracement would appear technically justified, it may raise concerns among shareholders, particularly when compared to the more aggressive price rallies seen in the shares of other tech giants, such as Microsoft (MSFT), as we discussed yesterday.
From a more pessimistic perspective, peak A may turn out to be yet another lower high within a broader bearish structure that has been forming on the AAPL chart since December 2024, when the stock reached its all-time high around the $260 level.
This article represents the opinion of the Companies operating under the FXOpen brand only. It is not to be construed as an offer, solicitation, or recommendation with respect to products and services provided by the Companies operating under the FXOpen brand, nor is it to be considered financial advice.
