Bitcoin Corrective Tsunami Underway? (Zoom Out II)This is the same chart as previously, except zoomed way out, so you can see the broader Elliott Waves in context, with the purple wave being the largest completed "genesis" wave which we are now correcting.
Targets are shown to be $3000-$3600 based on standard Elliott Wave Theory. However, this correction has the potential to go much deeper. For example, the $2500 level, and even the $2000 level if conditions are right.
Be cautious.
Target: $3000-$3600
Abccorrection

TenX Catching the Bitcoin Corrective TsunamiThere is a bearish pennant chart pattern across most cryptos that began on Sept. 8, and has now broken out. What’s remarkable is that it occurred across many cryptos at the same time. This suggests to me that there is a move underway, which will affect all cryptos. Specifically, I’ve already written about the Bitcoin tsunami, where I am expecting a correction down to the $3000-$3500 range, and possibly deeper if the conditions are right.
However, for TenX, the pattern is not quite as clear as for the other cryptos, as the penant appears to be drifting upwards slightly with each bounce. Nonetheless, the breakout has occured even for TenX. In addition, TenX appears to have some noise that manifests as a hyper-extended wave 5. I believe this is due to pump and dump groups, who artificially, albeit temporarily, manipulate the price of a low-cap market. The reason I think this, is because the overall price structure seems to be out-of-whack compared to the other markets. As such, I've compensated with a purple wave in an attempt to filter out some of the noise.
Bitcoin dictates the broad bearish or bullish trend of the entire crypto market. Within that broad structure, all other cryptos can have their own unique bearish or bullish trends or counter-trends. But they are comparatively much smaller movements within the broader picture. When there are large movements in Bitcoin, it brings everything with it.
Add to this the bearish pennant across all cryptos, the steep loss of momentum and volume, and we have a recipe for a deep market-wide correction. The targets I’m providing are for the various Fibonacci retracement and extension levels of corrective ABC Elliott Wave for TenX, or Wave II. The deeper the Bticoin correction, the deeper these levels get activated.
Target I: Wave II ≈ Fib. 0.618 x Wave I ($2.14)
Target II: Wave C ≈ Fib. 0.618 x Wave A ($1.95)*
Target III: Wave II ≈ Fib. 0.764 x Wave I ($1.51)
Target IV: Wave II ≈ Fib. 0.854 x Wave I ($1.13)
Target V: Wave C ≈ Fib. 1.0 x Wave A ($1.04)
Target Range: $1.51-$2.14

Omisego Catching the Bitcoin Corrective TsunamiThere is a bearish pennant chart pattern across all cryptos that began on Sept. 8, and has now broken out. What’s remarkable is that it’s occurring across all cryptos. This suggests to me that there is a move underway, which will affect all cryptos. Specifically, I’ve already written about the Bitcoin tsunami, where I am expecting a correction down to the $3000-$3500 range, and possibly deeper if the conditions are right.
Bitcoin dictates the broad bearish or bullish trend of the entire crypto market. Within that broad structure, all other cryptos can have their own unique bearish or bullish trends or counter-trends. But they are comparatively much smaller movements within the broader picture. When there are large movements in Bitcoin, it brings everything with it.
Add to this the bearish pennant across all cryptos, the steep loss of momentum and volume, and we have a recipe for a deep market-wide correction. The targets I’m providing are for the various Fibonacci retracement and extension levels of corrective ABC Elliott Wave for Omisego, or Wave ((ii)). The deeper the Bticoin correction, the deeper these levels get activated.
Target I: Wave C ≈ Fib. 1.0 x Wave A ($9.09)
Target II: Wave ((ii)) ≈ Fib. 0.764 x Wave ((i)) ($8.55)
Target III: Wave ((ii)) ≈ Fib. 0.854 x Wave ((i)) ($8.30)
Target IV: Wave C ≈ Fib. 1.236 x Wave A ($8.28)
Target V: Wave C ≈ Fib. 1.618 x Wave A ($7.03)
Target Range: $7.03-$9.09

EURNZDABC corrective pattern, expecting price to fall and retest trendline and if its a real ABC corrective pattern price will break below trendline.

Golem Breakout Momentum Elliott Impulse Wave 12345 formed in downtrend chart. Now we wait the breakout momentum to see if:
1) Goes up if break the blue line, than we will wait for the ABC correction final wave. (C) (and a possibilty of cup and handle further)
2) Goes down if break the green line, than we will wait for the ABC correction final wave (C) to see if breaks the suppport or not.

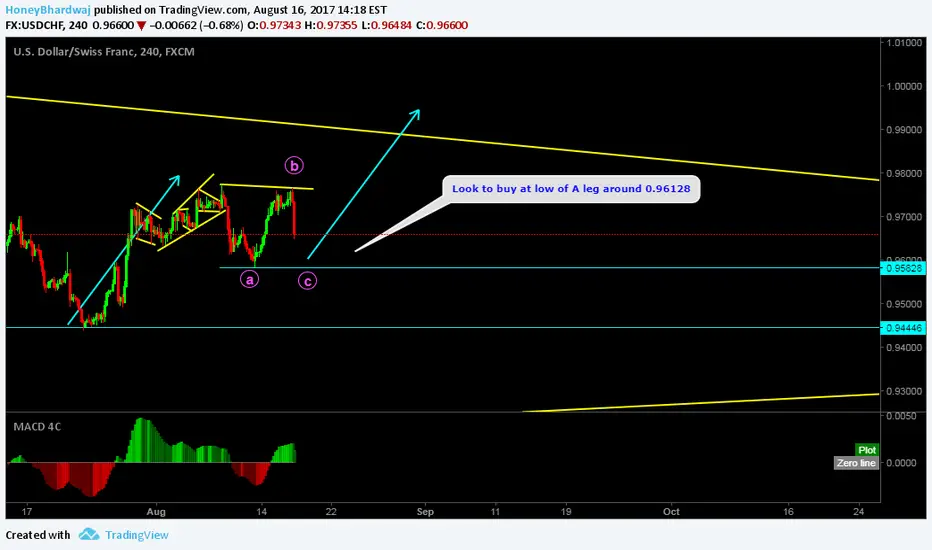
USDCHF Upcoming buy around low of A 0.96127 as it completes abc.Hi Guys, There is an upcoming buy setup at low of leg A corrective wave, it may not even touch that low so if it gives you up impulse on smaller time frame take this buy, USDJPY has also same kind of structure I'm in USDJPY buy from bottom, I'm not closing it. This thing will shoot so look for entry. I will get this one too it has huge potential. Good luck will post updates.


gbpjpy... Possible abc correction with a potential cypher Strong support with abc correction/ab=cd targeting cypher pattern.


Simple flat corrective structure, bullish flag! as with all GBP pairs I believe we will have more upside before the downside. Trade responsibly! :D

getting ready to buy !!!after a flag formation the gbpusd is offering an edge for buy ....
target around 1.2660


Follow the yellow brick road. 5-A Okay ...here is what i see... or hope that will happen here... This is the path to 'A'... Then... B.
A will be an minor e-wave and B, will be a dilapidated correction.


AU Zig-Zag.. gaining more evidence You'll see some comments on the chart. I have been missing out on some trades by sleeping! I can't say that that's a bad thing :D
Have a good week!

GU Long SetupPrice has revisited previous Brexit lows could not break below this area
Looking at a ABC flat correction to the upside
Higher Low established
Significant confirmation for bullish momentum if there is a break and retest of Daily descending tl
TP 1:1.3000
TP 2:1.3120
TP 3:1.3290

GU Flat corrective structure! Traders! What's up? Lookin' like a textbook flat forming here on GU. I'll be looking to go long next week! I will watch for a break to the downside for an expanded flat, but as of right now it appears to be respecting the lower structure! Setting up for impulse 5! :D
Thumbs up if you agree, and comment some feedback! I appreciate you ;)
Thanks for checking it out, and may the pips be with you!

ABC Correction EBAY after impulse wave maybe ABC correction.
after trigger in the point C possible Long position was entered.

USD/CAD - LONG - "Potential Cypher Pattern Completion?"Bias for bullish direction
- Possible ABC trend continuation
- Daily Bullish rising wedge pattern due to make new highs
- Completion of bullish cypher pattern
Risk
- Break below orange 0.382 Fib would show more correction to the 0.382 Larger timeframe fib

USD/CAD - ABC PATTERN / H&S / BAT PATTERN?Just an in depth updated view of my previous usd/cad post
Warning!
- just an idea, not a trade call
- this is counter trend, especially the nature of this pair can keep rocketing up!
