OM - this altcoin can 37x this year, here is whyOM looks very bullish. We can see that the previous downtrend ended with a descending parallel channel on the weekly chart. Now the price is finally breaking out! What is important is to always take a look at the volume indicator. Bullish volume is absolutely very high and at record levels, which confirms the breakout. Whales are buying it, and they cannot hide it. From the Elliott Wave perspective, the complex correction WXYXZ is complete, which is another sign of strength. Let me know what you think about my analysis, and please hit boost and follow for more ideas. Trading is not hard if you have a good coach! Thank you, and I wish you successful trades.
MANTRA (OM) is a first of its kind, vertically-integrated and regulatory compliant blockchain ecosystem. The MANTRA OMniverse encompasses the DAO; MANTRA Nodes: a blockchain infrastructure-as-a-service business that includes retail staking, institutional delegation, node management and white-label validator operations; MANTRA Chain: a protocol for regulated assets for the Cosmos ecosystem; and MANTRA Finance: a globally-regulated DeFi platform that brings the speed and transparency of DeFi to the world of traditional finance.
AB=CD

SUPER: 5800% profit in 2024/2025Technical analysis
SUPER is pumping hard; there is no doubt about it, and the trend should continue in the next few weeks and months! I recommend buying SUPER right now for a 50x profit in 2024/2025. We can see that the downtrend has ended with a descending parallel channel, and bullish volume is very high, which is always good to see! From the Elliott Wave perspective, we have completed a triple-three corrective pattern (WXYXZ), and we are in a new impulse wave.
Let me know what you think about my analysis, and please hit boost and follow for more ideas. Trading is not hard if you have a good coach! Thank you, and I wish you successful trades.
"What is the SuperVerse (SUPER)?
The SuperVerse is building and delivering Web3 products that empower crypto natives with next-generation NFT functionality, and onboard Web2 users through immersive blockchain gaming experiences.
The SuperVerse comprises two core verticals: NFT marketplace technology and video games. This wide array of Web3 tools and features is supported and governed by a single protocol and token: SUPER ERC20 (formerly known as SuperFarm).
The SuperVerse harbors two central products: GigaMart, a next-gen NFT marketplace with advanced analytics tools and unique social features, and Impostors, a social-gaming metaverse."
"What makes them unique?
By creating fun and inclusive games that appeal to modern gaming culture, the SuperVerse aims to overcome the current limitations of the Web3 space and take blockchain technology and NFTs mainstream. The SuperVerseDAO is dedicated to creating a user experience that bridges the gap between Web2 users and Web3 natives.
The SuperVerse is enabled by cutting-edge Web3 technology. By adopting and refining the latest Web3 functionality, the SuperVerse aims to be a pioneer in this industry and bring NFT marketplace technology and Web3 gaming to a new level. The use of the latest scaling technologies and ingenious in-house engineering make the SuperVerseDAO a leader in Web3 innovation."
Let me know what you think about my analysis, and please hit boost and follow for more ideas. Trading is not hard if you have a good coach! Thank you, and I wish you successful trades.

GOLD - New all-time-high soon! (Buy now)Gold looks extremely bullish in the short-term and also in the long-term. 5000 USD or 10000 USSD in the next few years is definitely very likely, but right now let's focus on the short-term price action.
We can see that GOLD is in a strong uptrend, and we can use a simple trendline tool to measure its strength. The price respects the blue trendline pretty accurately, and the uptrend is valid as long as this trendline holds. Of course, nothing lasts forever, and to be bearish, we need to wait for more confirmation.
It's always important to do an Elliott Wave technical analysis because markets always move in waves, not in a straight line. This helps us see the full picture of price action. As per my Elliott Wave count, we are in the final wave (5) of a major impulse wave of higher degree. This is something we need to take into consideration when establishing profit targets.
What is the profit target for this final wave (5)? Usually, what you want to do is take the Fibonacci extension tool and target the 0.382 or 0.618 Fibonacci extension. As you can see on my chart, I am expecting this wave to finish on the 0.382 fibo (at 2462), but I am also taking into consideration the next 0.618 fibo (at 2567). If you want to place your limit order as a profit target, place it slightly below these levels.
What will happen after we reach my profit target? I will show you in one of my next analyses, so make sure you follow my account! Let me know what you think about my analysis, and please hit boost and follow for more ideas about GOLD. Trading is not hard if you have a good coach! Thank you, and I wish you successful trades.

AUDUSD - Bearish AB=CD This chart depicts AUDUSD with Bearish AB=CD Harmonic Reversal Pattern indicating trend reversal at D.

Ethereum - Final crash soon! Then new all time high (buy here)Ethereum is preparing for the final crash! 2800 to 2700 is the most important zone you can watch because the price should bounce from it. This is exactly where you want to buy Ethereum for the long term or enter a high-leverage trade. I don't think the price will go lower, prices such as 2500 USD or 2000 USD is no longer realistic and possible. Why do I want to buy Ethereum in this zone?
First of all, we need to do an Elliott Wave technical analysis, which is the most important as it gives us a full map of previous price movements. From my perspective, the price is forming a triple-three corrective pattern (WXYXZ). This is a classic corrective pattern, and we are in the last wave Z. Usually, what you want to do is buy ETH slightly below the previous wave (Y) (liquidity sweep).
What's more, the price is inside this bullish flag / falling wedge pattern. This is another bullish sign for us to buy ETH below the previous wave (Y). Also, we have a long-term trendline from October 2023 with a total of 2 touches, so we also want to buy on the third touch of this upper sloping trendline.
This is a strong combo. We have a strong confluence to buy ETH between 2800 and 2700. Let me know what you think about my analysis in the comment section, and please hit boost and follow for more ideas. Trading is not hard if you have a good coach! Thank you, and I wish you successful trades.

Analyzing Bullish Patterns in EUR/NZD: An Experimental ForecastEUR/NZD appears to show a bullish pattern as the AB wave line exceeds the CD wave line. Based on this observation, I expect a bullish movement in this scenario. Please note that this concept is experimental, and if the market does turn bullish, the target is projected to be 1.82232. This setup also includes a stop loss, which I have set below 1.79884. Let's see what happens next.

GBPUSD - Bearish AB=CD Pattern This chart depicts GBPUSD with Bearish AB=CD chart pattern with entry at breakout of B and TP at PRZ after which price may reverse to Bearish Trend.

Tellor (TRB) completed a setup for upto 9.50% pumpHi dear members, hope you are well and welcome to the new trade setup of Tellor (TRB) token with US Dollar pair.
Previously we caught almost 113% pump of TRB as below:
Now on 1-hr time frame, TRB has formed a bullish AB=CD move for the next price reversal.
Note: Above idea is for educational purpose only. It is advised to diversify and strictly follow the stop loss, and don't get stuck with trade.

Bitcoin 2025 Target + Bull market mapBitcoin is in the middle of the bull market cycle, but where exactly? It's necessary to do an Elliott Wave technical analysis to see the full map, as the market always moves in waves. We are almost at the end of the major wave (3), and in summer 2024, we are ready to make a significant corrective ABC pattern. We probably all know that summers are usually boring months with a lot of sideways price action. On the chart, you can see my price projection for the next 1 year.
As per my calculations, the bull market should end in Summer/Fall 2025 with a price of around 130,000 to 170,000 USDT. The current price is 67,000 USDT, and the bull market started at around 15,000 USDT. Of course, the most money you will make is if you buy at the start of the bull market and sell at the end of the bull market, then wait for the bear market to end and repeat this cycle. I know it's easy to say, but the reality is different. But on the other side - trading Bitcoin offers much more profit than just holding Bitcoin as the price is very volatile on a macro scale.
In one of my next analyses, I will show you why the ultimate target is 130,000 to 170,000 USDT, so make sure you follow my account and do not miss my next posts! Let me know what you think about my analysis, and please hit boost and follow for more ideas. Trading is not hard if you have a good coach! Thank you, and I wish you successful trades.

Bitcoin - Crash to 57k, then 100k! (must see)The price of Bitcoin is preparing for a final drop to the downside, to 57k per my calculations! The price is still inside this bullish flag formation, and we still need to complete the ABC corrective pattern from the Elliott Wave perspective. At this point, I cannot be bullish at all, just be patient and wait for 57k to be hit before buying BTC!
It's also important to take a look at the long term trendline (October 2023 -> January 2024). We have 2 touches, and the 3rd touch is inevitable sooner rather than later! It will be good if you buy Bitcoin at this trendline. Trading is easy if you have the right information. After we hit the trendline, we can continue in the bull market (100k+). Do not forget that prices are usually very volatile around the halving event.
Let me know what you think about my analysis, and please hit boost and follow for more ideas. Trading is not hard if you have a good coach! Thank you, and I wish you successful trades.

Gartley 222 in FTSEWe have an opportunity in the form of a Gartley 222. At the moment all Indeces are under sessling pressure so overal market condition supports.

Waiting for a possible retest for a buy near todays lowWaiting for a possible entry. Looking at the recent movement , price has been making higher highs and higher lows on the daily time frame. Chart patterns like Harmonic Bat pattern and AB=CD pattern could be a likely confirmation for our bias. Waiting for price to retest our recent support at 167.078

BTCUSD: upcoming big sell, targeting $45,000| SetupsFX_ |Dear Traders,
Bitcoin retested selling zone, now we can target the first area 55k and then 45k. Our main reason is for selling swing is based on how price behaved and gaps within the market needs to be filled. Our entry is already activated and now we can target our areas. We expect price to hit our target by end of may.
Good Luck.

Update on Silver After AB=CD CompletionYou may recall the Research Team highlighted AB=CD bullish completion at $26.79 on the H4 timeframe for spot silver (XAG/USD) last week. Subsequent to this, price action recently came within reaching distance of the 38.2% Fibonacci retracement ratio at $27.84 before rotating southbound and pencilling in a potential higher low at $26.94 earlier today.
AB=CD Bearish Completion?
The 38.2% Fibonacci retracement ratio continues to call for attention for those long the AB=CD pattern as the initial upside objective. Should silver continue to be bid from current price, the 38.2% ratio actually converges closely with a 100% projection ratio at $27.99, which represents an AB=CD bearish formation. Were further upside to be seen beyond these levels, attention will likely be drawn to the 61.8% Fibonacci retracement ratio at $28.60, a level that shares chart space with a 1.618% Fibonacci projection ratio at $28.64, an ‘alternate’ AB=CD bearish formation.

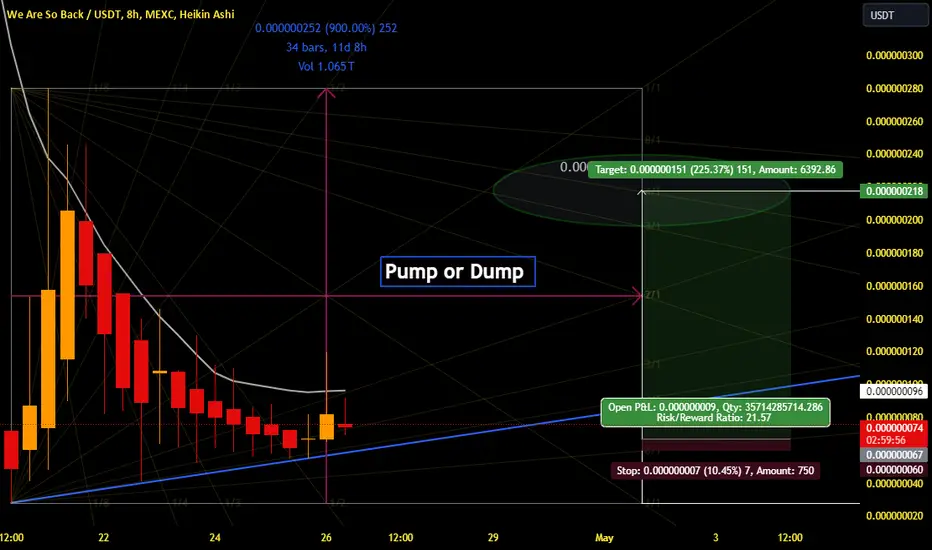
Are We Back or Naw?Technical Analysis Refresh: Review charts for bullish signs like candlestick patterns and oversold conditions.
Embrace the Bounce: Look for sudden volume spikes signaling potential reversals.
Risk Management Resurgence: Tighten stop-loss orders and scale into positions cautiously.
Buy the Dip, but Watch Your Step: Seek discounted assets with solid fundamentals.
Patience Pays Off: Stay patient; opportunities will emerge in time.
Community Comeback: Reconnect with the crypto community for insights and support.
Stay Informed, Stay Inspired: Keep abreast of market news and technological advancements.
Celebrate Small Wins: Acknowledge every step forward, no matter how modest.
Remember the Resilience: Draw inspiration from cryptos' history of bouncing back.
Keep the Faith: Maintain faith in the future of cryptocurrencies and blockchain technology."

XAU/USD: A Trend-Follower’s MarketSpot gold (XAU/USD) is +0.7% higher in US trading despite an earlier spike lower that was fuelled by the latest US GDP report (the first estimate).
Trend + AB=CD Support Suggest a Buyers’ Market
Technically, the price of gold could be poised to attack higher terrain. The trend, according to the higher timeframes, is unquestionably north after recently recoiling from all-time highs of $2,431. We have limited support on the weekly scale until as far south as $2,147, though the daily chart recently shook hands with a 1.618% Fibonacci projection ratio at $2,293, which, for many harmonic traders, will be viewed as an ‘alternate’ AB=CD support pattern. Of relevance, this structure is located a whisker north of daily support drawn from $2,280.
First Upside Objective Reached; Traders Eyeing Next Layer of Resistance?
Interestingly, recent price action already reached the first take-profit target from the AB=CD support at $2,345 (the 38.2% Fibonacci retracement ratio derived from legs A-D), which will prompt some ‘AB=CD longs’ to reduce risk to breakeven and liquidate a portion of their position. Ultimately, though, harmonic traders will perhaps target the 61.8% Fibonacci retracement ratio at $2,377, a level that potentially triggers some traders to liquidate the entire position; others may be encouraged to begin trailing their position in the hope the yellow metal refreshes all-time highs and continues its upward trajectory.

XAUUSD: Heading towards 2250$| Get Ready For Another Big SellDear Traders,
Yesterday was eventful day, Gold dropped till 2291 area and most of the retails liquidity started coming in the market, and as expected price took out most of the liquidity and took the price towards our first selling entry at 2331. However, we have witness strong bearish control at this point and it is likely to see some strong bearish momentum throughout the day. Our likely entry would be 2319$ targeting these areas first, 2290, 2270 and 2250.
Good Luck And Trade Safe.

#AUDCAD: 300+ PIPS A GREAT BUYING OPPORTUNITY. Dear Traders,
Tonight due to news price took out the sell side liquidity, price rebounded from key level and currently looking at our price going up towards our target. Use proper risk management.
Good Luck.

AVAX-USDT | 4H | TECHNICAL CHARTHello traders, AVAX has completed its first 5 waves, and now it's time for the completion of the ABC wave. Right after the completion of wave C, I combined harmonic patterns and made an analysis of both. I marked my target with yellow arrows on the chart after the completion of the harmonic pattern.
If you want me to keep my analysis up to date, please don't forget to like this post.
Thank you for considering my analysis and perspective.

EURUSD Analysis: Support & Resistance TradingKey Levels (1-hourly chart):
- Resistance: 1.0669
- Support: 1.0630
Additional Setup (4-hourly chart): Bullish Deep Crab & ABCD Patterns at 1.0522
Analysis:
- Approach: Identifies potential shorting and buying opportunities based on support & resistance levels
- Key Levels: Highlights resistance at 1.0669 and support at 1.0630 on the 1-hourly chart
- Alternative Setup: Considers a more favorable buying opportunity at the convergence of Bullish Deep Crab & ABCD patterns at 1.0522 on the 4-hourly chart
Trade Plan:
- Shorting Opportunity (1-hourly chart): Consider shorting at 1.0669 or buying at 1.0630
- Preferred Buying Opportunity (4-hourly chart): Look for a convergence of Bullish Deep Crab & ABCD patterns at 1.0522
- Risk Management: Implement effective risk management techniques to protect trades
Insights:
EURUSD presents trading opportunities at key support and resistance levels on the 1-hourly chart. Additionally, a more compelling buying opportunity may arise at the convergence of Bullish Deep Crab & ABCD patterns on the 4-hourly chart. Ensure prudent risk management practices are in place to manage potential market volatility.
📉📈 Exercise caution and prioritize risk management when trading EURUSD based on support & resistance levels!

ABCD pattern in NaukriNaukri is forming an ABCD pattern.
buy above 4320
stop loss 4050
Target by Mar'24 is 5890, 35 % upside potential

GOLD: Not Sure What Next? Gold has been in range, price have been trading at 2360 and 2396, however, we are still unsure of what next with Gold. Though fundamental and technical both sites showing that Gold may rebound to 2440 area however, recent volume and price behaviour says otherwise. Let's wait and see how price behave.
