#BTCUSDT: From $74,000 to $88,000 Moving Well! More Growth CominIt’s been on a steady climb from $74,000 to $88,000. We’re expecting even more growth in the coming weeks. The price has finally broken free from its consolidation phase and is now on the rise. We think it’ll reach $94,000, then $100,000, and maybe even go up to $120,000 by the end of the year.
What do you think? Let me know in the comments below!
Thanks!
Team Setupsfx_
AB=CD

XAUUSD 2-Hour Breakout Trading Strategy (Long Position) XAUUSD 2-Hour Breakout Trading Strategy (Long Position)
Go long on XAUUSD via breakout entry around the current price of 4051 USD once it breaks above 4051 USD. Set the stop-loss (SL) at 4023 USD.
- First target (TP1): Around 4130 USD – close half the position and trail the stop-loss (TSL).
- Second target (TP2): Around 4230 USD – close half the remaining position and trail the stop-loss.
- Third target (TP3): Around 4330 USD – close half the remaining position and trail the stop-loss.
- Let the residual position run with the trailing stop-loss in place.

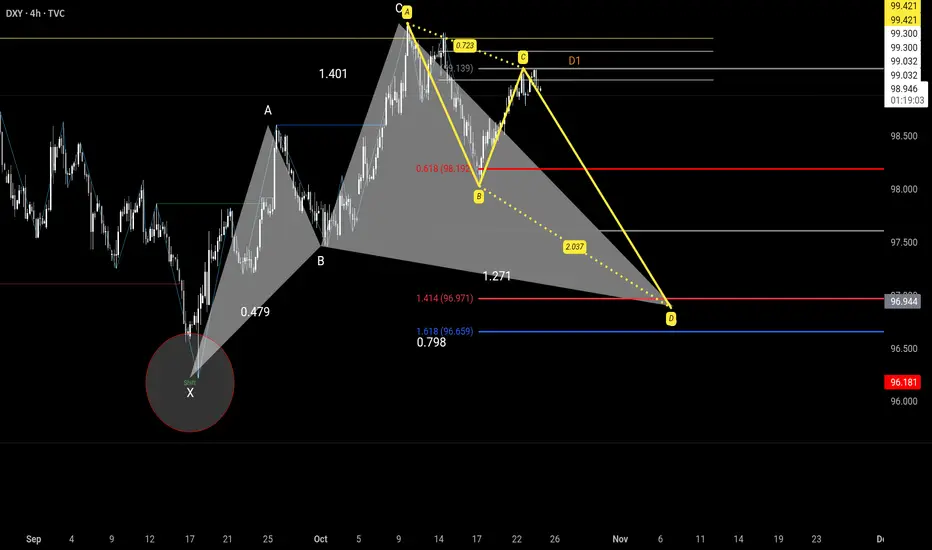
POTENTIAL BEARS To complement the entire analysis of the major pairs shared on our previous posts, is this dollar index exhibiting a bearish AB D Correction pattern. And therefore we remain dovish.

AUDUSDThe trend is bullish
No divergence and no reversal pattern
Continuation pattern bullish flag
Harmonic pattern ABCD

TSLA 3-Drive & ABCD Pattern – Path to $500 Before a PullbackThis chart highlights multiple harmonic and Elliott structures aligning for a potential bullish extension in Tesla (TSLA). A well-defined ABCD pattern and 3-Drive pattern suggest momentum building toward the $500 zone, supported by Fibonacci projections and channel resistance.
The current wave structure points to an imminent 5-wave advance, likely completing the “Drive 3” and pattern D confluence area near $500–505. Following that move, a corrective pullback (ABC) is anticipated, possibly retesting prior support near $440–400.
Key elements featured:
ABCD completion zone: around $500
3-Drive pattern: confirming exhaustion at upper trendline
Elliott 5-wave projection: short-term bullish continuation
Possible corrective phase: after the final wave up
📈 Watching for confirmation of Wave iii and potential exhaustion signals near $500 before considering downside setups.

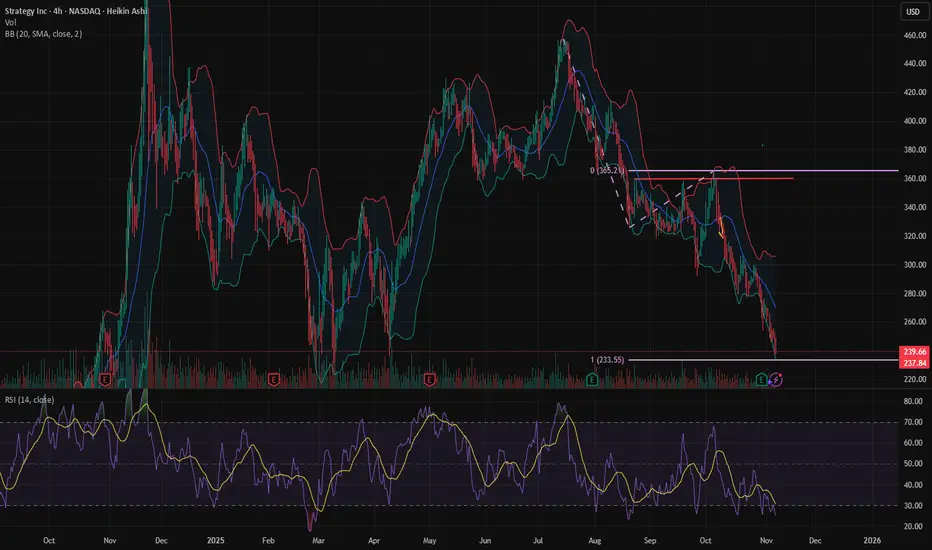
$MSTR: AB = CD target almost reachedNASDAQ:MSTR : the AB = CD targets $233 and today's low is $236.86. Very close. If NASDAQ:MSTR can bounce here, or fake breakdown to 233 or lower than bounce back, it would be good for Bitcoin. I don't own NASDAQ:MSTR shares and don't plan to trade this name. I'm looking at NASDAQ:MSTR as another data point to gauge bitcoin.
GBP/USD poised to rebound on demand and AB=CD support From the daily price of GBP/USD (British pound versus the US dollar), the pair has rebounded from demand at US$1.2871-US$1.3016, a move that is accompanied by the completion of an AB=CD bullish formation at US$1.3078 (100% projection ratio). From this point, traders tend to target the 38.2% and 61.8% Fibonacci retracement ratios derived from legs A-D at US$1.3307 and US$1.3491, respectively.
Written by FP Markets Chief Market Analyst Aaron Hill

BTC Bullish Continuation: The Significance of 50% RetracementsOver the past three years of bullish market cycles, the 50% retracement level has frequently acted as a reliable support zone following significant upward impulses.
In multiple instances, after establishing a new swing high, price has pulled back to a 50% level before successfully establishing a higher low and resuming the primary bullish trend with strong momentum. This demonstrates the level's importance in reloading the trend.
Following the most recent swing high, BITSTAMP:BTCUSD has executed a corrective move, which has now brought price precisely to the 50% retracement level of the overall bullish impulse.
This successful defense of the 50% retracement level strongly implies the formation of the next higher low (HL) in the overall bullish structure.
In summary, the market is currently at a high-probability reversal zone that has consistently preceded significant upward movements in Bitcoin's recent history. The risk/reward proposition favors a bullish continuation!

#BTCUSDT:Last Drop at 98K Before Hitting 140K?Bitcoin dropped significantly after reaching a record high of 125k. This comes after we announced a 100% tariff on China, creating fear in the global market, especially among crypto investors. We can now see a clear pattern forming, the AB=CD pattern, which is likely what others are also seeing.
Good luck and trade safely!
Team Setupsfx_

YM (Dow), Short idea (30-minute+3-minute TF)See the bottom two charts for the red bear zone I have for today. While it's entirely possible (due to TFs above 30 minutes) for the market travel up past this bear zone, it's a great risk/reward opportunity to take a shot short this morning.
Look for an interaction with the red zone, and momentum shift based on your rules for entry.
Happy trading!
-StoicTrader

Drop to $3333 with WXY in 2-5 monthsFirst, a decline to $3720-$3666 with W
Then, a rise to $4000 with Y
Then, a decline to $3400-$3333 with Z
I think it will happen in two months. If it's delayed, it could take five months.


GBPUSD - Key Support - D1Price just entering a suport cluster, which I think will be respected. I expect the price to go up to 1.33 or even 1.34, then return and continue decline down to 1.28.
Just my humble opinion

$BTCUSD: we're at this support/resistance band againBITSTAMP:BTCUSD : this support/resistance band needs to hold. If this support gives, AB = CD for the current wave and CD = 2 AB for the entire correction both project to $94K area.

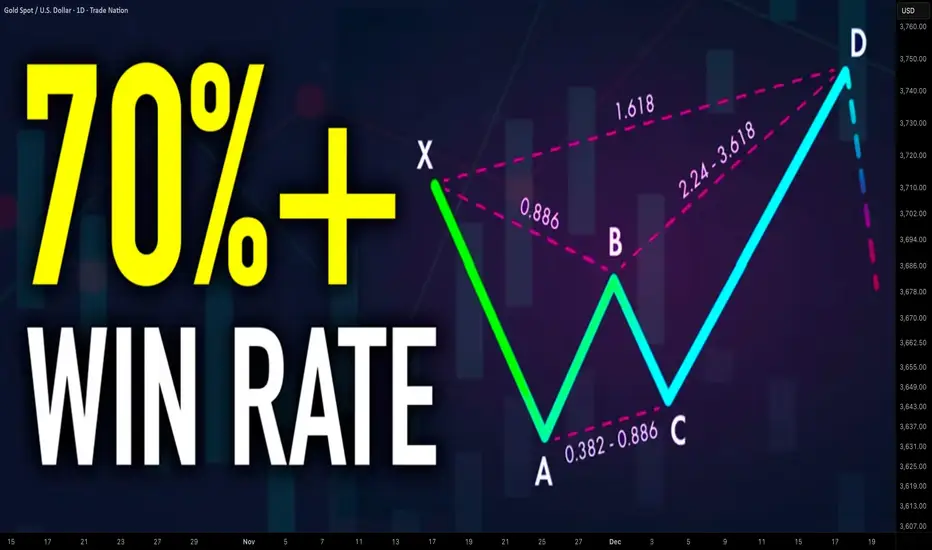
Best Harmonic Patterns For Beginners in Forex Gold Trading
In the today's article, I will share with you 4 best harmonic patterns for beginners. We will discuss the structure of each pattern and the rules.
Harmonic ABCD Pattern
That pattern is based on 3 legs of a price movement:
AB leg - impulse leg,
BC leg - retracement with the range of XA leg,
CD leg - impulse leg that has the same direction, the same time horizon and the same length as the XA leg
AB and BC legs should be equal or almost equal, that makes the pattern harmonic.
The completion point of the pattern - D point can be applied for predicting a pullback.
ABCD pattern can be bullish and bearish.
In a bullish ABCD pattern, AB leg is bearish.
D point of the pattern will be a safe point to buy from.
In a bearish ABCD pattern, AB leg is bullish.
D point will be a safe place to sell from.
The next 3 patterns will be based on 4 legs of a move:
XA, AB, BC, CD and will have XABCD structure with the initial point of the pattern being X point.
D point will be a completion point of the pattern from where a pullback will be anticipated.
The type of the harmonic pattern will be identified with Fibonacci numbers. The exact placement of each point of the pattern will define the name of the pattern.
Harmonic Gartley Pattern
In Harmonic Gartley,
B point of the pattern should strictly be between 618 and 786 retracement of the XA leg.
C point should lie between 618 and 786 retracement of AB leg.
D point will be 1.272 extension of AB leg.
Bullish Gartley Pattern will be based on a bullish XA leg.
Bearish Gartley will be based on a bearish XA leg.
Harmonic Bat Pattern
In Harmonic Bat,
B point of the pattern should strictly be between 50 and 618 retracement of the XA leg.
C point should lie between 618 and 1 retracement of AB leg.
D point will be 886 retracement of XA leg.
Bullish Bat Pattern will be based on a bullish XA leg.
Bearish Bat will be based on a bearish XA leg.
Harmonic Cypher Pattern
In Harmonic Cypher,
B point of the pattern should strictly be between 382 and 618 retracement of the XA leg.
C point should lie between 1.272 and 1.414 extension of XA leg.
D point will be 786 retracement of XC leg.
Bullish Cypher will be based on a bullish XA leg.
Bearish Cypher will be based on a bearish XA leg.
These patterns are phenomenally accurate and they are very simple to recognize.
❤️Please, support my work with like, thank you!❤️
I am part of Trade Nation's Influencer program and receive a monthly fee for using their TradingView charts in my analysis.
$GLD: CD = 0.618 ABAMEX:GLD had a craze run and got hit with a big wave of shorts and profit taking above $4400/oz. I don't think the bull market in gold is over, only that it's in a correction.
It looks like a zigzag correction is unfolding. CD has reached 0.618 AB this morning, which enticed a bounce. It can go to CD = AB however.
I'm holding some GLD shares and have a Limit Order to buy at CD = AB ($348).

XAU/USD – 4H ABCD Harmonic Pattern | Possible Bullish ReversalXAU/USD – 4H ABCD Harmonic Pattern | Possible Bullish Reversal Toward 4850 🟡📈
Hey traders 👋
Gold has been on an impressive run recently, but now we’re entering a key retracement phase, setting up for what could become a textbook ABCD pattern completion.
The structure suggests that once price finishes its C-leg correction into the highlighted demand zone, there’s room for a strong bullish continuation — potentially extending all the way toward 4850.
🧩 Pattern Structure:
A → B: Strong impulsive move upward, defining the current bullish leg.
B → C: Deep retracement in progress — targeting the golden zone (0.618–0.65 fib retrace).
C → D: Expected next impulse, projected by the AB = CD symmetry and extended fib target (around 1.618).
Once C confirms support and holds within the shaded demand zone, we could see the next leg (D) launch.
📊 Technical Confluence:
Fibonacci retracement: 0.617 aligning with structural support — a high-probability reaction area.
Volume Profile: Strong buying interest clustered in this range, visible on the left-hand histogram.
RSI Divergence Indicator: Showing multiple bullish signals at local lows — early momentum hinting at buyer re-entry.
Market Structure: Uptrend intact on higher timeframes; current move appears corrective, not reversal.
This alignment gives weight to a bullish continuation scenario once the correction completes.
🎯 Trade Outlook
Entry Zone: Around projected “C” completion within the demand box.
Stop-Loss: Below the structural low / invalidation zone.
Take-Profit:
TP1: Near mid-structure resistance.
TP2: Previous high area.
TP3 / Final Target: 4850, projected from the full harmonic leg extension (AB = CD).
This setup offers a massive risk/reward potential, provided confirmation triggers (bullish candles, divergence hold, or breakout of minor structure).
⚠️ Key Notes
If price breaks below the green demand box, the pattern invalidates.
A retest confirmation or divergence hold will increase probability before entering long.
Watching the DXY for additional confirmation — a weakening dollar could accelerate this bullish scenario.
📌 Gold (XAU/USD) – 4H ABCD Setup Building Toward 4850 | Awaiting C-Leg Completion for Long Entry
Are you buying the dip at the C-zone or waiting for bullish confirmation first? Drop your view 👇
#XAUUSD #Gold #HarmonicPatterns #ABCDPattern #TechnicalAnalysis #PriceAction #SmartMoney #SwingTrade #BullishSetup

Dxy follow upABCD extension with target PRZ. Pattern is projection alongside previous idea which will be linked below.
Btc Upside in the near term for bitcoin as dxy falls to bottom of range. Fib extension tools gives possible targets. Still not convinced btc goes vertical from here.

RIOT – Short-Term Bullish SetupNASDAQ:RIOT completed its wave 4 pullback after attracting buyers at the #BlueBox support zone of $18.34–$17.24, and has already reacted higher from that level.
Currently, the wave ((ii)) correction is unfolding in 3 swings, reaching another equal legs area at $20.49–$19.58, where price is expected to resume the rally if support holds.

$BTCUSD: $116K area incomingBITSTAMP:BTCUSD pulled back to 50% retracement and bounced. The next area of bull-bear battle is $116K area projected by AB=CD harmonic pattern.
Elliot wave: we've had 1-2 or a-b. Wave 3 or wave b should take us to $116K, where many longs will probably take profits.

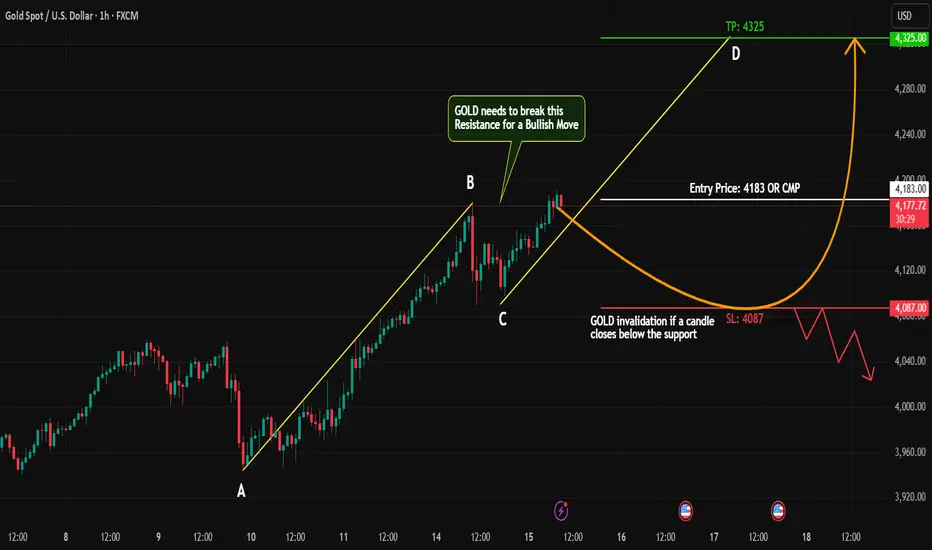
GOLD Forming Back-to-Back AB=CD Patterns | 1H Bullish Setup#GOLD is maintaining a strong bullish trend, showing impressive momentum across higher timeframes.
Recently, it completed one AB=CD pattern, and now it's forming another fresh AB=CD structure on the 1-hour chart — a clear sign of continuation!
Resistance level has been broken
No bearish divergence or reversal signal
Momentum remains in buyers’ favor
Trade Plan:
Entry: CMP
Direction: Long
Stop Loss: Below recent swing low
Targets: Based on Fibonacci extensions
Risk Management: Strict and disciplined
The setup looks clean and technically strong — let's see if #GOLD continues its bullish rhythm!
What do you think — will #GOLD maintain this momentum or face a quick pullback before the next leg up? Drop your thoughts below
#GOLD #XAUUSD #ABCDpattern #HarmonicTrading #PriceAction #TradingSetup #BullishTrend #TechnicalAnalysis #SwingTrade
ETHUSDT: Possible Minor to Major Corrections May HappenETHUSDT has a higher chance of experiencing a minor or major correction in the coming days, although we haven’t confirmed this yet. We need more confirmation before we can be certain about the future of ETH. However, if the price decides to undergo a major correction, it’s likely to drop to our second area, where it’s expected to fill the liquidity gap and then reverse, continuing towards our three targets.
Please use this analysis as secondary bias only or even only for educational purposes. Always conduct your own analysis and risk management before trading or investing in cryptocurrencies, as they carry significant financial risk. Good luck and trade safely.
If you want to support us, you can do so by liking the idea, commenting with your views, or sharing it.
Much love ❤️
Have a great weekend
Team Setupsfx_
