AB=CD Brent A 4H AB=CD on Brent crude oil.
Simple pattern with target at 67.5.
Divergence on multiple indicators 4H and below.
AB=CD

BTC last flight????BTC 4H divergence at volumes & RSI, didn't respect the AB=CD and retraced and touched fib lvl 0.382. At 5M broke its resistance lvl of 107951.29.
Wait for first HH at 1H for entry and SL at 102681.30.
5M at CMP with SL at 105860.

BNB 2HCRYPTOCAP:BNB on the 2H chart has completed a bearish harmonic pattern, reaching the D point right at the support zone around $1,020.
Currently, price is testing a critical support area a potential short-term relief bounce could occur if buyers defend this level.
However, a breakdown below support could trigger a continuation move toward the $900–$850 range.
Structure remains bearish unless the price reclaims the mid-range zone near $1,1k.
#BNB #Crypto #Trading #BNBChain #Binance

$BTCUSD: measured move CD = 1.618 AB gives $98K area. BITSTAMP:BTCUSD : measured move C = 1.618 A gives $98K area. 200 Week MA gives 101K area. Guess looking at $100K area very soon.
The whale with $128M BTC short replaced his $102K close and flip long order with $98K range close short and flip long. But who knows? He can't replace it again further down. Let's see how BTC reacts in another 5% drop. Still believe there is another way up though. But conviction is not high.

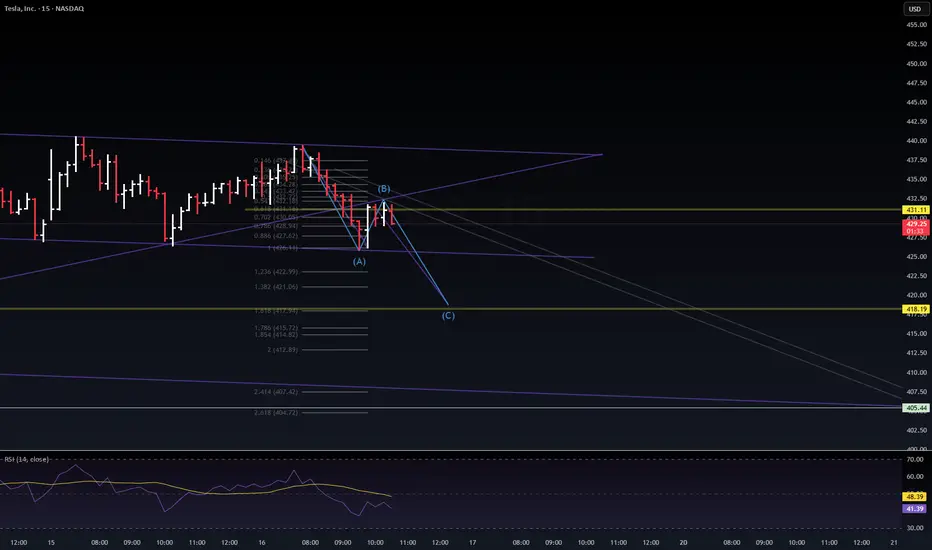
$TSLA Wave (B) rejection looks valid NASDAQ:TSLA
Wave (B) rejection looks valid — system preparing for Wave (C) extension. ⚠️
0.618 retrace rejection confirmed
RSI divergence remains bearish
Target → $418 → $405 liquidity zone
DSS short bias until structure breaks above $432
VolanX mode: “Drain before reversal.” 🧠
#VolanX #AITrading #TSLA #ElliottWave #SmartMoneyConcepts
BTC Symmetry <Danger Zone>Considering the low shadow in Bitcoin, this upper zone is my entry area, and if I get confirmation, I’ll enter a sell position.
Symmetry will definitely occur — it’s just a matter of time, sooner or later.
864

#EURAUD: Two Swing Bullish Entry Worth Thousands Pips! EURAUD is currently at a critical level, and the price isn’t yet decided for the next move. However, the current price behaviour suggests strong bullish volume presence in the market. There are two areas to buy from. The first is activated, and we think price could just be starting the next bull run from this point. The second entry is a safe point if price does decide to drop further and fill up the daily Fair Value Gap.
We wish you the best in trading.
If you want to support us, you can do the following:
- Like the idea
- Comment on the idea
- Share the idea
If you have any questions or concerns about the analysis or trading in general, please let us know in the comment box.
Team Setupsfx_
❤️🚀

#USDCAD: Two Major Buying Zones, Patience Pays! As previously analysed, USDCAD is expected to decline towards our predetermined entry point. We anticipate a bearish US Dollar for the remainder of the week, which will ultimately lead USDCAD to reach the entry zone. Three distinct target areas exist, collectively worth over 1100 pips. Each entry point, stop loss, and take profit is clearly defined.
We wish you the best of luck and safe trading.
Thank you for your support.
If you wish to assist us, we encourage you to consider the following actions:
- Like our ideas
- Provide comments on our ideas
- Share our ideas
Kind Regards,
Team Setupsfx_
Much Love ❤️🚀

EUROD Stablecoin Debuts as ODDO BHF Enters Crypto MarketIn the evolving crypto market of October 2025, the launch of EUROD marks a pivotal moment as a major European financial institution enters the space with a euro-backed stablecoin. EUROD, designed as a compliant, low-volatility digital euro, is backed 1:1 with fiat reserves and aims to bridge traditional finance with blockchain, offering accessibility for retail and institutional users. This debut reflects the growing demand for regulated stablecoins in Europe, where the market cap has surpassed $300 billion amid MiCA's rollout. EUROD will first list on a Madrid-based crypto platform, backed by telecom and banking giants, positioning it as an alternative to dollar-pegged tokens like USDT. This article analyzes EUROD's launch, its implications for the stablecoin ecosystem, and trading opportunities. Position for the euro-stablecoin shift.
EUROD's Launch: A Compliant Euro for Crypto
EUROD is structured to meet EU's Markets in Crypto-Assets (MiCA) regulations, ensuring transparency, liquidity, and redeemability for users across the European Economic Area (EEA). Backed by a 175-year-old banking institution managing over €150 billion in assets, the stablecoin prioritizes security and compliance, with audited reserves and seamless on-chain accessibility. It targets both retail investors seeking stable digital euros and institutions needing fiat-like stability in DeFi, voting, and payments.
The launch coincides with nine European banks, including ING and CaixaBank, forming alliances for MiCA-compliant euro-stablecoins, signaling a continental push toward tokenized money. EUROD's debut on a Spanish exchange, backed by Telefonica, Unicaja, and BBVA, bridges traditional banking with blockchain, offering frictionless on-ramps for euro liquidity in lending, borrowing, and settlement. This comes as the stablecoin market hits $300 billion, with euro-pegged tokens gaining traction amid dollar dominance concerns.
On-chain data underscores momentum: stablecoin transactions up 25%, with 20% market share for euro variants. Sentiment is 71% bullish, correlating 0.7 with ETH, as MiCA compliance reduces depeg risks by 30%. Risks include liquidity constraints in early trading (5–7% volatility) and regulatory audits, but EUROD's fiat backing mitigates these.
Market Implications: Euro Stablecoins and DeFi Bridge
EUROD's entry diversifies the stablecoin landscape, challenging USDT's dominance with a euro-pegged option for EEA users, potentially capturing 10% of the $300 billion market. It enables efficient cross-border payments, reducing costs by 80% compared to traditional wires, and integrates with DeFi protocols for on-chain lending and borrowing. Partnerships with nine banks, like Societe Generale's EURCV, signal a trend toward bank-issued stablecoins, transitioning from custody to DeFi accessibility.
This launch aligns with the euro's role in tokenized finance, where regulated stablecoins facilitate $10 billion in monthly DeFi volume. Analysts forecast euro-stablecoins reaching $50 billion by 2026, with EUROD paving the way for institutional adoption. However, U.S. dollar hegemony and regulatory scrutiny could cap growth, risking 2–3% depegs in volatility spikes.
Trading Signals: RSI and MACD
Based on recent trends:
ETH ($4,500): RSI at 58 (bullish). Bullish MACD (+0.12)—target $5,200 (15% upside). Support at $4,200, resistance at $4,760. On-chain: stablecoin volume +25%.
BTC ($116,000): RSI at 57. Bullish MACD (+0.15)—target $120,000 (3.5% upside). Support at $115,000, resistance at $117,400.
Overall: RSI 57–58 signals longs for 3.5–15% gains. Risks: liquidity constraints (5–7% dip); hedge with USDC.
Conclusion: EUROD's Crypto Entry
EUROD's debut as a MiCA-compliant euro-stablecoin signals Europe's tokenized future, bridging banking and blockchain with 1:1 fiat backing. RSI 57–58 and bullish MACD suggest 3.5–15% upside—buy the launch for DeFi liquidity gains.
What’s your stablecoin play? Comment below!
#EURODStablecoin #EuroStablecoin #CryptoMarket #ETH #TradingSignals

NZDUSD Trend Continuation Setup - Targets RevealedHey traders, Akil Stokes here — in today’s video, we’re diving deep into a trading opportunity that we first called out almost a month ago!
In this video I'll show you how I use structure analysis and a combination of Fibonacci retracements, extensions, and equal measured moves (AB=CD Patterns) to pinpoint high-probability zones — turning a 200-pip area into a precise trading target.
👉 Please leave any questions or comments below & I wish you the best in your trading week ahead.
Akil

GADT LongNot only GADT broke its all-time high but also gave a channel breakout in July 25'. However, that breakout couldn't last long and turned into fake-out.
Multiple reasons included a parabolic move, taking price action away from SMA-10, not so good result of Q4 and no dividend payout.
Now the price has re-tested its all-time high breakout level, SMA-10 is now very near and all-time high volumes in July signal entry of some player.
The next target will be channel top of 410, then recent high of 569, followed by all-time high breakout target of 600 and then ABCD pattern target of 750.
This is my own opinion and not a buy / sell call.

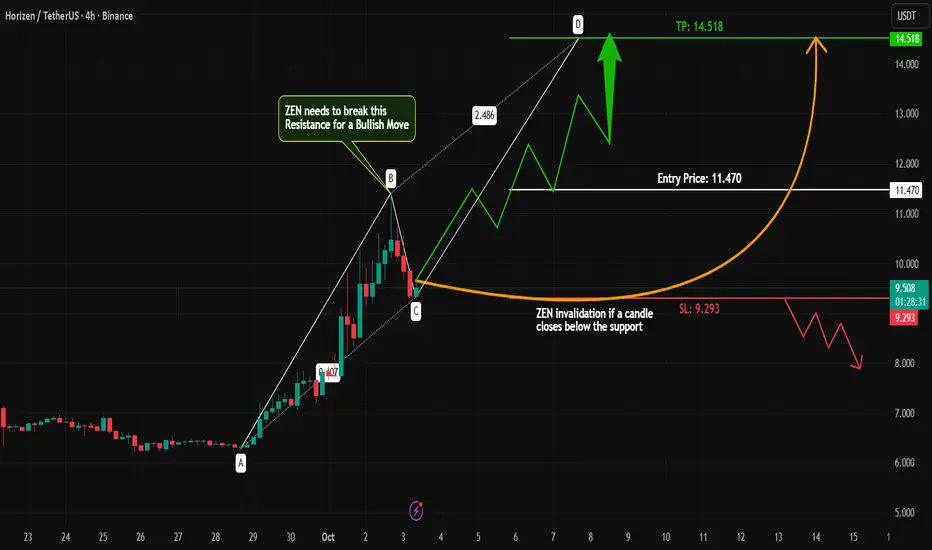
ZEN – Strong Uptrend + AB=CD Pattern | Next Bullish Move Ahead?Description:
#ZEN is showing solid bullish momentum with strong volume support. On the 4H chart, price action is forming a potential #AB=CD harmonic pattern — and importantly, we don’t see any clear bearish reversal signs yet.
Trading Plan:
Market is in a clear uptrend.
Waiting for a break above the previous Higher High (HH) to confirm continuation.
After the breakout, a retest entry will give us a high-probability long setup.
As always, trade with proper risk management.
Key takeaway: Patience pays. Let the market confirm direction before entering!
What do you think? Will #ZEN continue its bullish run or surprise us with a reversal? Drop your thoughts below
#ZEN #Crypto #PriceAction #ABCD #TrendTrading #TechnicalAnalysis
Symmetry <Danger Zones>BTC follow Symmetry
just wait for entry signal
Price symmetry refers to comparing the size of past and current price movements to identify balance or repeating patterns.
It assumes that the market tends to make similar upward and downward moves in terms of price distance (such as wave length or correction size).
Analysts measure previous price swings and compare them with the current move to identify potential reversal or continuation points.

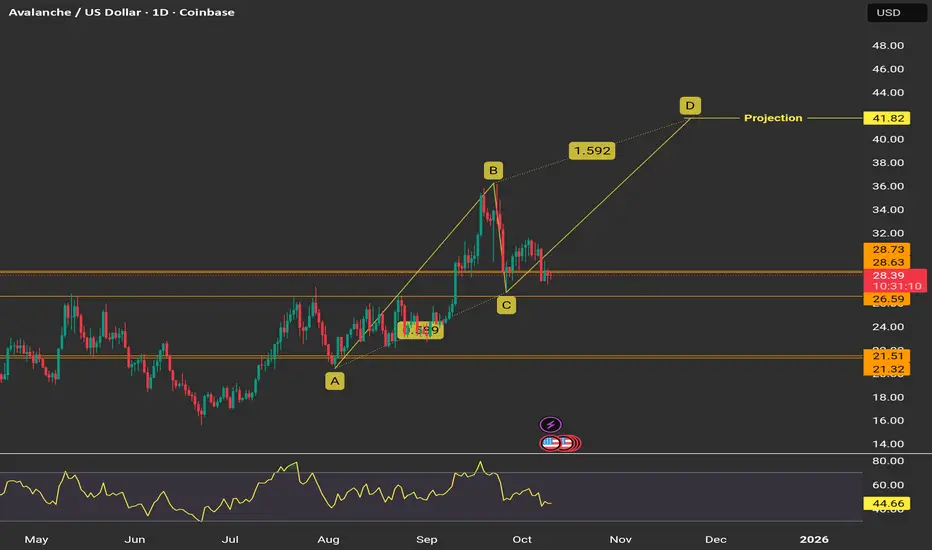
AVAX Set for AB=CD Rally?BYBIT:AVAXUSDT has been in a bullish trend and has broken it's major resistance levels, breaking out of consolidation areas.
Currently, price is finding support between 0.5 / 0.618. If price starts trending up from here, we can expect the pattern projected price to be achieved in the upcoming months!
GBPUSD Bearish Trade Setup @4h Decider (Mandatory)
Trend Bearish
Divergence None
Continuation Pattern Bearish Flag
Reversal Pattern
Harmonics AB=CD
Bias Bearish
Scenario Sell Stop at B point Breakout
Trade Plan
Stop Loss 1.35325
Entry Level 1.165
TP 1.3106

#EURNZD:Price accumulated now time for distribution! Price completed accumulated and now we expecting a strong bullish price distribution. Next week we can see price going and crossing our target with strong bullish volume kicking in the market. Price may go beyond 2.20 region; let's see how it goes.
Good luck and trade safe!
Team Setupsfx_

EURAUD Long Trade SetupTrend: Bearish
Divergence: Bullish
Continuation Pattern: None
Reversal Pattern: AB=CD
Harmonics : AB=CD
Bulls/Bears Score
Bias: Bullish
Scenario: Buy Stop at LH Breakout
Trade Plan
Stop Loss: 1.7612
Entry Level: 1.76765
TP: 1.7741

XAUUSD long harmonic pattern/fib extensionXAUUSD long harmonic pattern/fib extension
See chart analysis

EURAUD Bearish Trade SetupTrend: Bearish
Divergence: None
Continuation Pattern: Bearish Flag
Reversal Pattern: None
Harmonics : AB=CD
Bulls/Bears Score
Bias: Bearish
Scenario: Short Sell at B point Breakout
Trade Plan
Stop Loss: 1.77425
Entry Level: 1.7648
TP: 1.7553

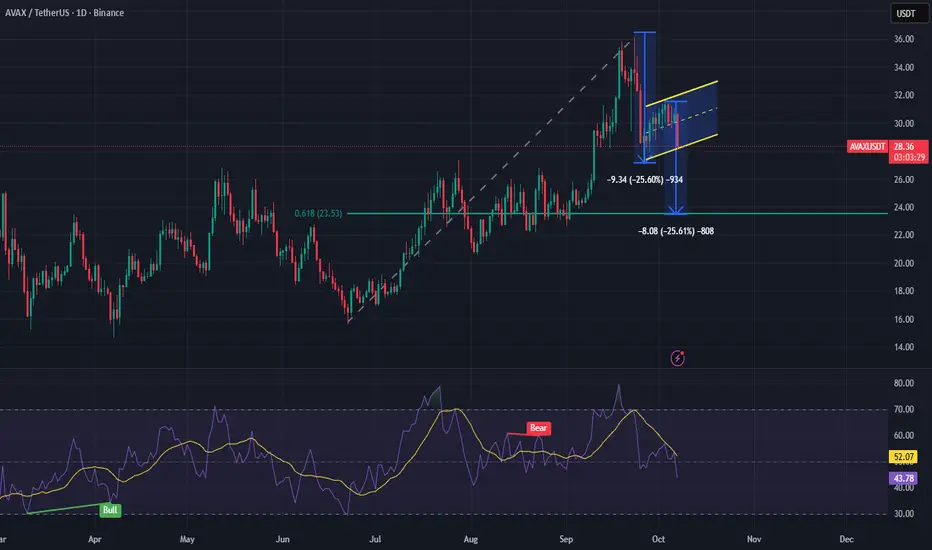
AVAX - Bear Flag/ABCD PatternFollowing the formation of a double top on 23 Sep 2025, AVAX has entered a downward trend, currently exhibiting characteristics of a bear flag consolidation. Within this structure, an ABCD harmonic pattern appears to be developing, suggesting potential continuation of bearish momentum.
Should both the bear flag and ABCD pattern play out, the projected price target lies in the range of $23.50–$23.60. This zone aligns with the 61.8% Fibonacci retracement level, derived from the swing low on 22 Jun 2025 to the swing high on 23 Sep 2025.

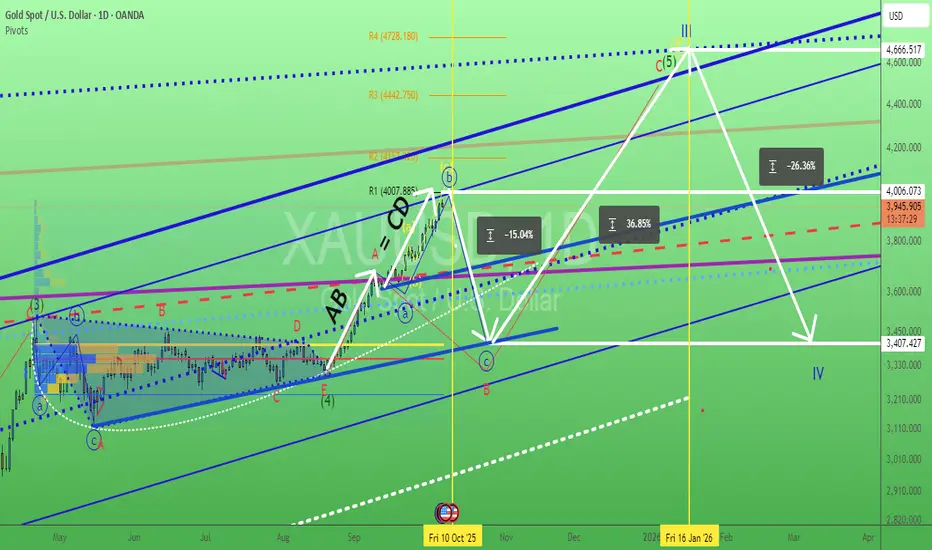
Gold. Waiting NFP trigger? 7/Oct/25XAUUSD nonstop surging need some profit taking? what event trigger the heavy sell off? Coming this Friday delayed NFP? "time / cycle - wise" Look like "some cash out" not just from Gold but also equities market?. 4007.885 are the confluence zone of 1) Monthly R1 2) Parallel Line Resistance 3) AB = CD price volume. and many...P/s all impulsive wave consist of abc subwaves not 1,2,3,4,5 waves
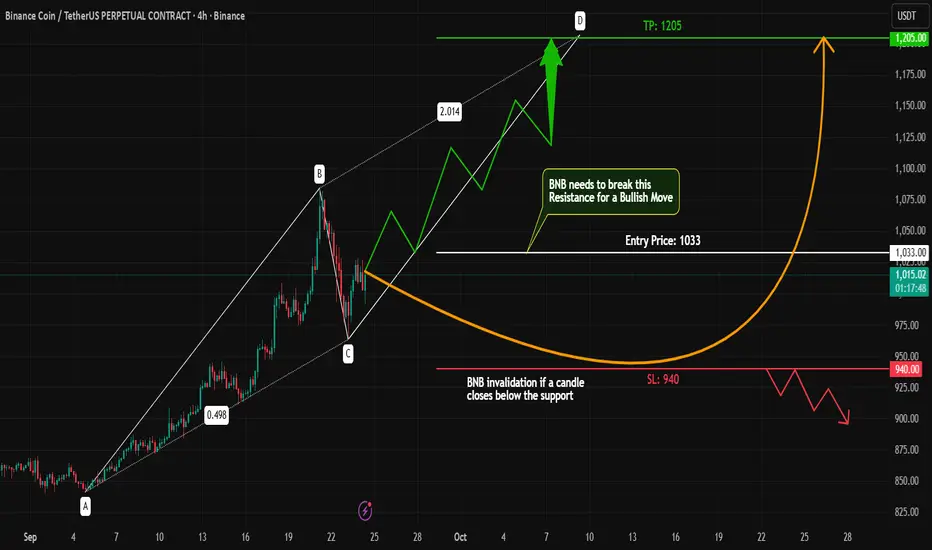
BNB in Strong Uptrend | AB=CD Pattern + Breakout SetupDescription:
#BNB is currently moving in a strong uptrend with high volume, showing no bearish signs on the chart. On the 4H timeframe, price action is forming a bullish AB=CD pattern, which strengthens the upside potential.
Trading Plan:
Waiting for a clear breakout above the resistance level
Entering long trade only after breakout confirmation
Applying strict risk management (SL below support)
High-volume breakout setups often lead to strong continuation moves.
Let’s see if #BNB can continue its bullish momentum and head towards new highs!
#BNB #Crypto #Altcoins #PriceAction #TechnicalAnalysis #Trading #ChartPatterns #CryptoTrading #Breakout #ABCDPattern #4HChart #RiskManagement