Analysis for the next weekHello traders.
The market is going to open tonight, are you ready for the next week??
The gold is falling like a crazy from the last week. Gold can fly from 3327 - 3301. Next week will be bullish. Gold can touch 3413 next week.
Kindly share your thoughts, where will be the next move for gold according to your analysis??
Accountmanagement

Analysis for the next weekHello Trader,
I hope you are doing well and you enjoyed your weekend.
As you know the market is running in uptrend, it’s creating break of structure (BOS) again and again. The market can fall a bit and then it will continue the uptrend.
It can make another All Time High (ATH) next week. Avoid to take much risk. Follow the trend.
The market is going to open tonight, Get ready your accounts for the next week. Best wishes for all of you guys.

The 50/50 Account Management Scam- How it WorksFrom Cold Calling to Telegram
I’ve been in the markets for so long I feel like a dinosaur, and I’ve probably seen every scam out there.
The truth is, none of them are really new — they’re just adapted to the new social paradigm.
What was done in the 2000s through cold calling is now done through Telegram, Instagram, X, and other social platforms.
I didn’t really want to write this article, in case it gave someone ideas.
But since anyone who wants to be a scammer already knows how it works, maybe this article can warn those who still have no idea how the so-called account management scam operates — especially its most common form: the coin flip scam (50/50 scam, Opposite trades scam, Split-direction scam, Two-group margin call trick, as is also known)
Step-by-Step: How the Coin Flip Scam Works
1. Gathering the victims
The scammer starts by fishing for victims through Telegram channels/groups, Instagram profiles, Facebook groups, or even X posts.
They present fabulous profits, post ads with guaranteed return offers, and flood the feed with so-called “proofs” — screenshots of winning trades, client testimonials, and account statements. Most of these are either fabricated or selectively chosen to show only the winning side.
Once someone shows interest, the scammer’s first move is to earn their trust.
They’ll tell you the broker doesn’t matter, that you can choose it, and that they have no access to your money — which is, technically, true.
Then comes the closer:
“You don’t have to pay me upfront. I only get paid if I make you money, so it’s in my best interest not to lose. You see? We’re on the same side.”
This combination of flashy results and “risk-free” terms makes you feel safe enough to hand them trading access.
________________________________________
2. Splitting into two groups
The accounts are divided into two equal batches:
• Group A → All-in BUY
• Group B → All-in SELL
With high leverage (e.g., 1:200), a 50-pip move means either doubling the account or wiping it out completely.
Note: I won’t go too deep into the details here, because the exact margin call level depends on the broker. But trust me, it’s easy for a scammer to plan the money split based on the different brokers’ rules. What we’re talking about here is just the general principle.
________________________________________
3. Guaranteed winners and losers
The market moves.
One group hits margin call and loses, while the other doubles or triples its capital (depending on broker's leverage, even more on 1:500).
The scammer now has perfect marketing material: “Look how I doubled my client’s account!”
________________________________________
4. Milking the winners
Clients who made a profit are celebrated and told something like:
“I only worked with low capital this time just to show you I can do it. I have big clients and serious strategies — now that you’ve seen the proof, deposit more so we can make real money.”
The scammer frames the initial gain as a “demo run” to gain the client’s confidence, pushing them to commit much larger sums next.
________________________________________
5. Recycling the losers
The wiped-out clients are told:
“It was an unusual market move. Deposit another $1,000 and we’ll recover it tomorrow.”
Some quit, but others fall for it again.
________________________________________
6. Repeat the process
The cycle continues. There’s always a “happy” group and real account statements to attract fresh victims, while the losers are quietly discarded or convinced to reinvest.
________________________________________
Why the scam works
• The proof are authentic – Screenshots and MT4/MT5 statements for the winners are real.
• Survivorship bias – Prospects only see the successes, never the failures.
• Hope psychology – Losers believe “next time” will be different (and it can be if they end up in the "winner group" next time
________________________________________
Final word
If someone promises to double your account quickly and safely — walk away.
Real trading is about risk management and long-term consistency, not betting your capital on a 50/50 gamble.
Don’t be the next screenshot in a scammer’s sales pitch. 🚀
P.S.
Stop believing they “made you money on purpose” at the beginning and then “lost it on purpose” after you deposited more.
If they truly had the skill to do that, they wouldn’t need to be scammers in the first place.
The reality is simple — once you put in more money, you just happened to land on the losing side of their scam.

Buy with 1% Risk ! Sure Shot This trade is Based on Advanced Smc and Ict Concepts !
RR 1:6
Used Money Management

Gold 30-minute chart, target achieved with news...This is a Gold (XAU/USD) 30-minute chart, showing a bullish setup.
Key Points:
1. Uptrend Continuation
Price is trending upwards inside a rising channel.
Blue trendline indicates recent bullish momentum.
2. Resistance Target
The price is approaching $3,055.64, which is a resistance zone.
If broken, gold may push higher.
3. Previous Rejection Zone
The orange circle highlights a past rejection around this level.
A breakout above would confirm further bullish strength.
Conclusion:
Gold is in a bullish trend, targeting resistance at $3,055.64. A breakout could lead to higher prices, but rejection may cause a pullback.

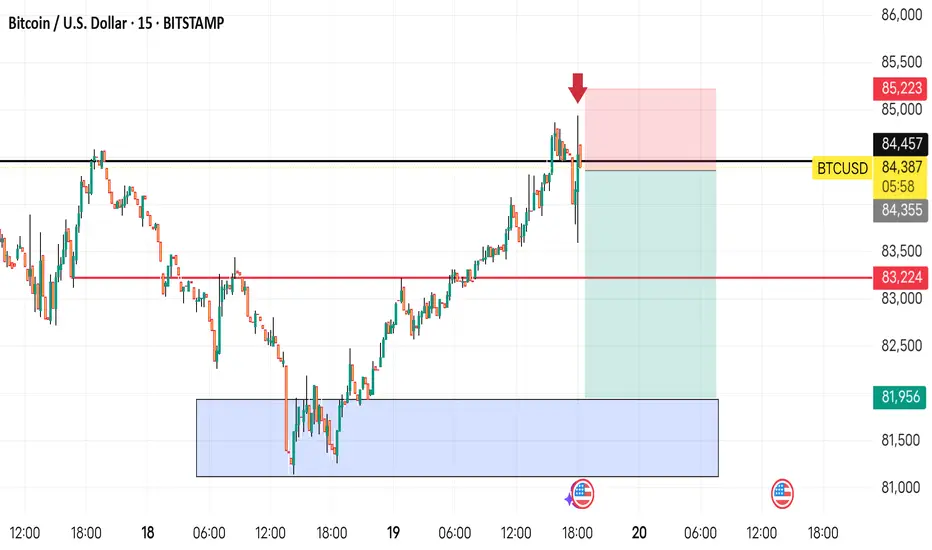
BTCUSD 15MINUTES. SHORT TRADE SETUP, CHECK CAPTAIN..This is a Bitcoin (BTC/USD) 15-minute chart from TradingView, showing a trade setup. Here’s what it means:
1. Resistance Level (Black Line at $84,355-$84,457): Price tested this zone but failed to break above it.
2. Short Trade Setup:
The red arrow indicates a sell entry at the resistance level.
The red box above represents the stop-loss area ($85,223), meaning if the price moves above this, the trade would be invalidated.
The green box below is the take-profit area, with a target around $81,956.
3. Price Rejection: BTC/USD attempted to break resistance but was rejected, suggesting a potential move lower.
4. Liquidity Zone (Blue Box): A previous demand zone where buyers stepped in, indicating a possible support level.
Overall, this chart suggests a bearish trade setup, where the trader expects Bitcoin to decline from the resistance zone.
BTCUSD 15MINTS CHART TECHNICAL ANALYSIS NEXT MOVE POSSIBLE..This chart shows a potential bullish move for Bitcoin (BTC/USD).
The price is currently in a support zone (blue area) around 81,800-82,000.
A breakout from this level is expected, leading to a rise toward 83,224 (resistance level).
If momentum continues, BTC could reach 84,457.
The blue arrows indicate the expected bullish movement.

GBPUSD 1HOUR CHART TECHNICAL ANALYSIS NEXT MOVE POSSIBLE This chart shows a technical analysis of GBP/USD on the 1-hour timeframe.
1. Resistance Rejection – Price reached 1.30056 and faced rejection, indicating a possible reversal.
2. Bearish Scenario – The chart suggests a potential drop toward 1.29514 as the first support.
3. Breakdown Possibility – If 1.29514 fails, price could continue falling toward 1.29136, the next key support.
4. Price Action Structure – The drawn arrows indicate a possible retest of 1.29514 before a further decline.
Overall, this chart signals a potential bearish move if price fails to hold above key levels.

XAUUSD READY TO BOOM 3000?Market Structure:
I N B O X- F O R -T R A D E -S I G N A L S
The price has been in an uptrend but recently experienced a pullback.
After making a higher high, the market retraced and is now showing a possible bullish reversal.
Trade Setup:
A long (buy) position is placed, with the entry point around 2,935.725.
Stop-Loss (SL): 2,927.165 (marked in red).
Take-Profit (TP): 2,955.208 (marked in blue).
Risk-Reward Ratio:
The trade is structured with a risk-reward ratio greater than 1:1, which indicates a balanced approach to risk management.
Key Levels to Watch:
Support: 2,930.000 (recent low).
Resistance: 2,955.000 (target level).
If price breaks above the 2,955 resistance, the next target could be 2,970+.
Possible Trading Strategy:
Bullish Confirmation: If price sustains above 2,941, it could indicate further upside momentum.
Bearish Risk: If price falls below 2,935, the trade setup might become invalid, leading to a stop-loss hit.
Conclusion:
📌 The market is currently at a key decision point. If the price maintains above 2,935, buyers may push towards the 2,955 level. However, if the price breaks below support, a deeper pullback may occur. Risk management is crucial in this setup.

Ethereum its going down soon Ethereum (ETH/USD) on a daily timeframe, illustrating a descending channel from November 2024. The price is currently around 2,634, within a key support zone. Several Fibonacci levels are highlighted, suggesting potential areas of interest, with the2,149.90 level being a critical support. The chart also includes an order block (OB) at higher levels around $3,400, which may act as resistance if the price retraces. A possible retest is expected before a move toward lower support levels.

PRE-NFP LONG EURUSD TRADING IDEAI'm positioning a long trade on EURUSD in anticipation of the upcoming NFP event, with the following setup:
Entry: 1.03840
Stop Loss (SL): 1.03660
Take Profit (TP): 1.04418
Trade Rationale:
With the NFP report on the horizon, volatility in the USD is expected to increase. This setup is based on the technical analysis that shows a bullish structure on EURUSD. By going long, the strategy aims to benefit from a potential shift in market sentiment where a weaker USD could push the pair higher. The entry is timed at a key level that has historically acted as a support, while the stop loss is positioned just below to mitigate risk.
Strategy Considerations:
Risk Management: A tight stop loss is placed to limit exposure if the market moves against the position.
Market Monitoring: Given the high impact of the NFP report, it's crucial to keep an eye on the news and adjust the trade if necessary.
Risk-to-Reward: The setup offers a favorable risk-to-reward ratio, with the take profit level providing a substantial target relative to the defined risk.
This trade is designed to capture the momentum shift expected from the NFP data, with a well-defined entry, stop loss, and take profit structure. Happy trading!

USDCAD Sell Short (Final)I have been analyzing USDCAD for a while now and I believe this is the time for a double top to be formed and that M formation shall be taking place like the previous W pattern USDCAD has built up. As seen in the chart, USDCAD touched for a double bottom at 1.34213 which I predict that we shall be lead to that level again. USDCAD has far too long rallied and we should all be shorting this very top to make all our profits again. Rinse, repeat, and learn from these lessons in trading. I also wanted point out that in our analysis we have highlighted where previous support and resistances have broke out and lead to new higher highs and now lower lows when we come back down from this entry at 1.38973 I hope you all enjoyed our analysis! We also have included TP and SL in the chart and please follow our page for more signals like these! If you have any questions about this trade please send me a direct message and I will respond swiftly.
Thanks for stopping by!

USDCAD SellUSDCAD looks like a sell on the H4 and has been moving steadily down from my last entry in UC. I believe that there will be a potential double top move looking to move towards the 1.37800s and since we are within that range it is clearly looking for prior price action to do a pullback or continue the reversal pattern of a downtrend. I am looking for this mainly to be a day trade, however, I will also be placing a swing trade for my other trading accounts to bare in mind to also use PROPER risk management.
RSI also indicates that we are long overdue a major short and will see it within the next few candles how far USDCAD can go. I also have spotted trend patterns go back to July 25th of this year and it extending all the way down for a month straight crashing USDCAD all the way down till the very bottom of the RSI.
ENTRY: 1.37951
TP 1 (Day Trade): 1.1.36230
TP 2 (Swing Trade): 1.35434
TP 3: (extended swing trade) 1.34396
SL: 30 Pips from entry
Please message me if you have any questions! Please enjoy your day and be sure to follow our page!

USDCAD Short (2)USDCAD sell short as from my previous post spiked a bit before today's US FOMC news we are expecting at 2:00 PM EST. I have placed another short for USDCAD since we are phasing a major bull trend that has been building up for weeks prior to this news. I suggest placing in a short sell NOW prior to any news events occurring.
ENTRY: 1.36880
TP 1: 1.35843
TP 2: 1.35345
TP 3: 1.34797
SL: 25-30 PIPS from your entry
Please message me if you have any questions about this trade! Please enjoy your day and be sure to boost this post, follow this page, and comment what you want the next trade analysis to be! Thanks again from Aventura Holdings!

USDCAD ShortUSDCAD looks like a sell on the H4 and has been moving steadily down from my last entry in UC. I believe that there will be a potential double top move looking to move towards the 1.35800s towards the 1.35371 prior to a pullback or further breakdown of the pair. I am looking for this mainly to be a day trade, however, I will also be placing a swing trade for my other trading accounts to bare in mind to also use PROPER risk management. RSI also indicates that we are long overdue a major short and will see it within the next few candles how far USDCAD can go.
ENTRY: 1.36595
TP 1 (Day Trade): 1.35371
TP 2 (Swing Trade): 1.34806
SL: 30 pips from entry
Please message me if you have any questions! Please enjoy your day and be sure to follow our page!

GBPJPY Short GBPJPY short signal is clearly showing a pattern of rejections on the main resistance line. Looking for an opportunity here, I believe that we will see a nice downfall for this pair moving rather than stagnate like some of the other pairs this last week it seems. I am also in favoring the RSI since the RSI shows a clear indication we are about to cross over the blue moving average and will most likely reach the 40s area of the RSI. Below, I have placed the entry, TP, and SL. Please also be sure to follow us for more signals and give this a boost to show you want more high quality PROFITABLE signals! I also apologize for not being here in the last few months as I was dealing a lot of matters with my business partners and as well went to Hawaii for some vacation time. Thanks again for the support and happy profitable trading sessions, everyone!
ENTRY: 194.416
TP 1 (Day Trade): 190.471
TP 2 (Swing Trade): 184.480
SL: 25 pips from entry
DAY/SWING TRADE! You DON'T have to hold the trade till it hits TP! You can simply hold and trade until you feel most comfortable taking your profits.
Please message me if you have any questions! Please enjoy your day and be sure to follow our page!

Looking for USDJPY Set UpsLooking for potential set ups for UJ buys/sells. I was bearish a few days ago with my analysis and profited over 150 on that amazing drop that all JPY pairs dropped into. However, we could be in for a mini reversal until when we see the support trend potentially break. Rising wedge is looking like we can take a possible bearish move in the future.
Please be sure to turn on notifications for our future updates!

AUDCAD Sell/ShortAUDCAD looks like a good signal from here that has bounced off resistance, came back a bit, and seems to not be a strong higher low for AUDCAD. Our analysts and myself am calling a sell short here due to the fact this pair has repeated multiple patterns in the same way in the last few months and as well it has the best risk/reward ratio I have seen so worth the bet to make. Please follow the entry, SL, and TP. Please make sure to follow our page for more daily signals!

EURUSD Long/BuyEURUSD looks like it can go long from here, last two supports have respected the trend and as well the fact being that EURUSD looks like its third wave back up for a retrace after a heavy drop. I have placed the entry, TP, and SL for the trade. Please message me or let me know any questions you may have in regard to this trade or in general about us and our page! Please make sure to follow our page for more daily signals!

GBPJPY Sell/ShortGBPJPY looks like it is in a phase of bearish return in a downtrend channel pattern. We are currently looking to short on the market due to the rejection at level of 200.700 and we will be looking to see a drop of at minimum 200-400 pips before touching the main support trend line. I have my profits set there, however, please feel free to take any profits you wish ahead of time. Thank you and please be sure to follow our page!

GBPAUD Sell/ShortLooking at a new rejection that seems to have been struggling to break past 1.93100 I can confirm to say this seems like a bearish downtrend that is occurring. I will take my entry now at 1.93072 with all inputs for TP and SL below. Please use proper risk management as always.
GBPAUD Sell/Short
ENTRY: 1.93072
TAKE PROFIT:
TP 1: 1.89317
TP 2: 1.86379
SL: 1.94623
Please use proper risk management upon entering this trade.

GBPJPY Sell/ShortNew sell short for GBPJPY sell short. I have a TP for 196.971 set in and a stop loss can be set for 25 pips. Please message me for any questions in regards of this trade.

GBPYJPY Sell/ShortGBPJPY looks like a sell on the daily and has moved strongly upwards from the last signal I called. This seems to be the top and for this updated signal I know for fact it can most likely drop from here. Resistance does not seem like it will break due to previous failures and as well we can be heading down potentially for months back to 194s area respectively. Please check below for TP, SL, and entry points!
ENTRY: 197.696
TP 1 (Day Trade): 196.950
TP 2 (Swing Trade): 194.120
SL: 25 pips from entry
Please message me if you have any questions! Please enjoy your day and be sure to follow our page!
