POL: ready for a rebound? key levels to watch in the coming daysPOL – tired of bleeding or just loading the spring for the next move? According to market sources, fresh headlines around the Polygon 2.0 migration and new incentives for builders lit up the ecosystem today, and intraday volume picked up right away. On the chart we’re sitting right on a chunky demand zone where buyers defended price several times already.
On the 4H, RSI bounced from oversold and is pushing above its signal line, while the visible range volume profile shows a fat node a bit higher, around the first red supply block. I’m leaning long from this green zone, aiming for a squeeze into the 0.103–0.11 area as late shorts get uncomfortable. I might be wrong, but this looks more like accumulation than a safe downtrend continuation. ✅
My base plan: hold longs while price stays above the lower edge of demand around 0.088 and watch for a clean 4H close above local resistance to confirm strength. If bulls fail and we lose that 0.088 support, I step aside and let it drift toward deeper liquidity below 0.085. Until then, I treat dips into the green zone as potential reload spots, scaling out near the first red supply blocks.
Accumulation

$BTC Capitulation ZoneOn the weekly timeframe, Bitcoin has clearly printed a new lower low, confirming the continuation of a broader bearish market structure. The trend remains decisively downward, with momentum favoring sellers.
However, the next major reaction zone appears to be forming between $54,000 and $44,000. This range aligns with a potential high-interest demand pocket where strong spot accumulation could begin. If price taps into this region within the next two weeks, we may see consolidation lasting 2–3 months, as the market stabilizes after extended downside pressure.
An important factor here is liquidity behavior. Selling-side liquidity is gradually thinning. As price approaches deeper levels, forced sellers reduce, and long-term buyers typically step in. This transition often marks the beginning of accumulation phases rather than immediate continuation breakdowns.
That said, if macro pressure intensifies and this demand zone fails to hold, the next deeper support band sits around $35,000–$30,000, which could act as a final yearly exhaustion level.
Base expectation:
Short-term continuation lower
Major reaction expected in the $54K–$44K range
High-probability long-term accumulation below $50K
Extended consolidation before any structural reversal
Patience will matter here. The best opportunities are usually formed during discomfort.

PRME 1W(Prime Medicine, Inc.) - Editing the futurePrime Medicine, Inc. is a biotechnology company focused on next-generation gene editing technologies, targeting rare genetic diseases and currently operating in an active R&D phase.
On the weekly chart, PRME has completed a breakout from a long-term downtrend and is now consolidating during a structural retest. Price is holding within the 3.59–4.00 support zone, where the broken trendline retest, the 0.618 Fibonacci level, and a high-interest volume area align. Price remains above the EMA, confirming that buyers continue to control the structure within the current range. Volume expanded during the breakout and has cooled during consolidation, which is typical behavior during accumulation phases. The current area represents a high-demand zone according to the volume profile, reinforcing its structural importance.
From a fundamental perspective, the company remains unprofitable, which is typical for early-stage biotech. Estimated EPS for Q4 2025 is −0.25 USD, with projected revenue of 2.08M USD. Cash flows remain negative, but liquidity levels are high and debt pressure is not critical, allowing continued R&D without immediate capital stress. Market valuation is driven by expectations around clinical progress rather than present financial performance.
This is a higher-timeframe structural transition story, where the market gradually reassesses the asset after a prolonged decline. Biotech is never about comfort, but this is how early reversals usually start.

ETH - V Reversal - Livermore Accumulation Cylinder to ATHLivermore accumulation cylinders are my bread and butter. ETH just posted it's final low into a 5+ year liquidation zone within a livermore accumulation cylinder
All of the on-chain liquidations are decimated, there are no more forced sellers.
Up only from 1739.

PONY AI - Accumulation is showing up againSomething quiet is happening here.
After a sharp selloff and failed attempts to regain momentum, price has drifted back into a zone where Accumulate is starting to light up again . This is not a breakout signal - it’s a context shift .
What matters:
• Price is trading close to a rising structural baseline
• Volatility has compressed compared to the prior leg down
• Accumulate has flagged repeated accumulation events, suggesting absorption rather than distribution
• Institutional volume remains low — this looks early, not crowded
This does not mean price has to reverse immediately. Accumulation often precedes long periods of frustration and range-building. But structurally, this is the type of zone where risk starts to compress , not expand.
Key takeaway:
Accumulate doesn’t tell you what will happen next.
It tells you where behavior is changing .
As long as price holds this region and accumulation continues, downside risk becomes more controlled - while upside remains optional.
Context ≠ signal.
Patience > prediction.
🟢 Tool used: TrendGo Accumulate (free)

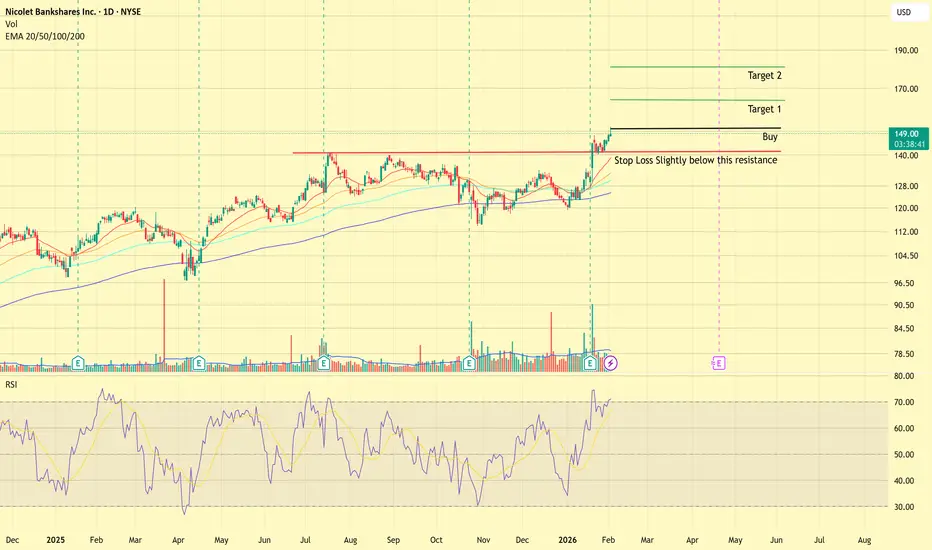
NIC | Momentum Stock to Buy: Nicolet Bankshares (NIC)Bullish Breakout - 1 Day Time frame
Reasons to Buy-
1. 3x Volume Breakout above strong Resistance zone
2. Prior Low volume consolidation zone
3. Price above 20/50/100/200 EMA's.
4. Positive EPS and revenue Qtr over Qtr growth.
What's your thoughts? NYSE:NIC
Target 1 - R:R- 2:1
Target 2 - R:R- 4:1
ROSE: Buyers’ Zone in PlayPrice is currently trading inside a historical buyers’ zone , where prior downside objectives have already been met and selling pressure has diminished.
After the expansion, distribution, and unwind phases, the market has transitioned into acceptance at lower prices , suggesting potential interest from buyers rather than continuation to the downside.
This zone does not guarantee a reversal — but it is where bullish participation typically begins , if the market intends to rotate higher.
As long as price holds above this base, the expectation is for buyers to step in and attempt a reaction . Failure to do so would invalidate the bullish premise and keep price in balance.
This is a directional expectation, not a signal. Not financial advice.

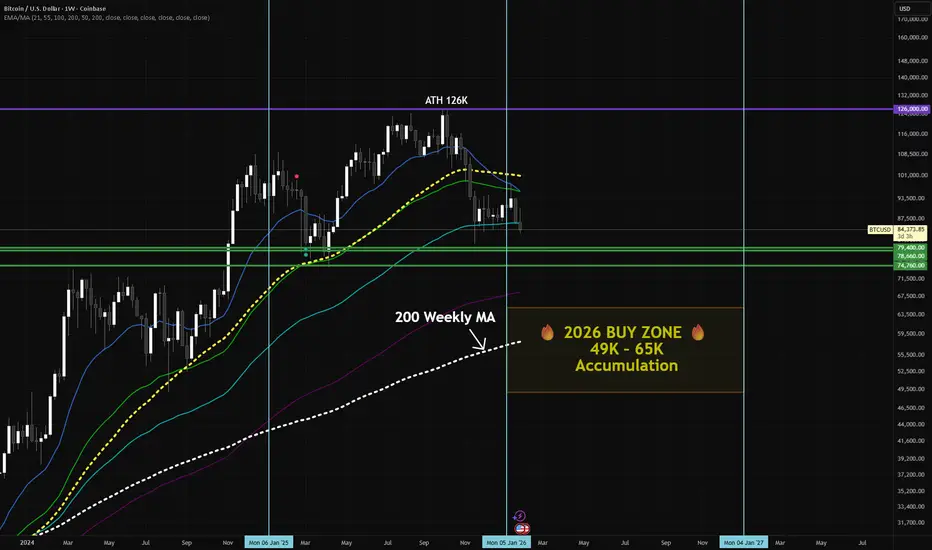
BTC Weekly Update – January 2026Current positions highlighted on the chart: 74K–79K , which are holding as near-term support.
I also have longer-term DCA positions not shown here.
Key 2026 accumulation zone: 49K–65K, near the weekly 200 MA, which has historically acted as long-term support.
BTC has recently pulled back from the 2025 peak (~126K) and is consolidating in the mid 80K range. Holding these support levels will be important before potential moves lower toward structural long-term support zones.
For educational purposes only – not financial advice.
TEMPUS AI (TEM) - Context Is Building AgainThis is not a signal. This is context rebuilding.
Accumulate perspective (1D)
Price is once again approaching the TrendGo Accumulate zone on the daily timeframe.
Historically, this level has been highly meaningful:
• Every previous pullback into the Accumulate zone resulted in strong upside expansions
• Accumulate acted as a structural base, not a simple price support
This is the same recurring behavior we’ve highlighted in prior TrendGo analyses:
Price tests structure → structure holds → expansion follows
What matters right now
• Price ≈ Accumulate → the market is testing whether the structural base is still valid
• No active “Accumulation Detected” yet → this is a context zone, not confirmation
• As long as Accumulate holds, the structural bias remains constructive
This is where professionals observe - not anticipate.
The Pelosi narrative (properly framed)
Recent disclosures show Nancy Pelosi increasing exposure again.
Within the TrendGo framework:
• Narrative alone is never a signal
• Narrative only matters when structure supports it
That’s what makes this setup interesting:
Recurring institutional narrative + price interacting with a proven structural zone
TrendGo takeaway
• This is not a FOMO moment
• This is a structure-awareness moment
•Real conviction only comes after system confirmation , not before
Structure → Confirmation → Timing
That’s how TrendGo removes guessing from market decisions.
Educational content only. Not financial advice.

The Crypto Accumulation PlanCrypto has had a lacklustre 2025, and we may have an even worse 2026. Despite reaching new all-time highs, BTC has not delivered as much as people hoped, while most Altcoins continue bleeding against it.
Assuming the four-year cycle is still intact (as we have had nothing to signal otherwise), 2026 should be a bear market for the asset class, where accumulation opportunities will present themselves. To build on this further, the chart highlights a similar area with regard to monetary policy, which is presenting itself again today. By taking a similar bar pattern and overlaying it, we can see a potential outcome for the year.
I believe the bleed will be relatively slow throughout the year and should reach its cycle lows approximately one year after the 2025 cycle highs, which happened in October. As social interest has been low for this cycle, I don’t believe this will cause any major sharp capitulations—more likely, we’ll see temporary moves to the upside along the way.
As a conservative target for the year, I believe BTC should go below $65,000. Good accumulation opportunities should form in the later part of the year as metals start to slow down and experience some pullbacks. I believe a realistic cycle low could form around $50,000, but I will spread my dynamic DCA over multiple months to capture price action below $65,000 and ensure I have enough cash available if BTC decides to head even lower.

SUI H4 AMD Distribution Phase, Expecting Sell-Off Toward H4 FVGs📝 Description
SUI on H4 has completed a clear AMD cycle. After a prolonged Accumulation, price expanded into Manipulation and is now trading inside the Distribution phase. Recent price behavior shows weak follow-through on the upside, signaling exhaustion rather than continuation.
________________________________________
📈 Analysis (Scenario-Based | Non-Signal)
With the market now firmly in Phase 3 (Distribution), downside probability increases.
• Failed upside continuation confirms distribution behavior
• Price rejection inside the range suggests smart money offloading
• Draw-on-price shifts toward unfilled H4 FVGs below
As long as price remains capped below the distribution high, any short-term bounce is viewed as corrective, favoring continuation lower.
________________________________________
🎯 ICT & SMC Notes
• Complete AMD structure confirmed
• Distribution phase active
• H4 FVGs below acting as downside magnets
________________________________________
🧩 Summary
SUI has transitioned into the Distribution phase of AMD, which historically precedes downside expansion. With no structural bullish confirmation, the higher-probability path favors a rotation lower toward H4 FVGs, aligning with smart-money distribution rather than accumulation.
________________________________________
🌍 Fundamental Notes / Sentiment
SUI remains risk-sensitive. With no fresh bullish catalyst and fading crypto liquidity, conditions favor the Distribution phase and a move toward lower H4 FVGs rather than continuation higher.
________________________________________
⚠️ Risk Disclosure
Trading involves substantial risk and may result in capital loss. This analysis is for educational purposes only and does not constitute financial advice. Always apply proper risk management, predefined stop-loss levels, and disciplined position sizing aligned with your trading plan.

Gold needs a correction after the ATH!Greetings!
If you see me at the charts, it means a fresh dose of solid analysis is coming.
Today my focus is on XAUUSD.
Yesterday we updated the ATH at 4642. Congrats to all holders and bullish traders. 🔥
This move happened amid global uncertainty. Greenland, Cuba, Iran, Trump is actively talking about all of this after what happened in Venezuela.
Because of that, investors are rushing into safe-haven assets to protect capital from a potential crisis.
And gold is the #1 safe-haven asset of all time.
Now to the chart:
The local uptrend started with Wyckoff accumulation. After that, at the top of the channel, price went sideways and formed a Wyckoff distribution.
For those who don’t know:
Accumulation → potential reversal up
Distribution → potential reversal down
At the highs, smart money distributes, so I’m expecting the start of a correction (for now, local).
There are 2 key zones where we could potentially see a reversal.
Profits to everyone! 💰
Follow for more 🚀

CHAINLINK (LINK) - Are you watching accumulation, or just price?Most traders focus on price swings .
Institutions focus on where price stops falling and time starts doing the work .
That’s exactly what we’re seeing on LINK right now.
⸻
🔍 What TrendGo Accumulate is showing
For 94 bars , LINK has been moving inside a clear Accumulation zone :
• Price is holding above the Accumulate baseline
• Volatility is compressed
• Institutional volume remains low but persistent
• Every deeper pullback gets absorbed, not rejected
This is not a breakout phase.
This is inventory building .
⸻
🧠 How to read this correctly
Accumulation phases are not about speed.
They are about patience and positioning .
Historically, when LINK entered similar Accumulate zones:
• Price stopped trending down
• Time replaced volatility
• Expansion came after most traders lost interest
Right now, price is still boring.
That’s usually when risk is lowest - not highest.
⸻
⚠️ What would invalidate the idea?
• Losing and closing below the Accumulate zone
• Accumulation turning into distribution (no longer absorption)
Until then, this is structure before direction .
⸻
📌 Final thought
You don’t need to predict the breakout.
You need to recognize when the market is preparing one .
This is what TrendGo Accumulate was built for.
What do you see here - accumulation or just another range? 👇

XRPUSDT M15 Liquidity Sweep and Corrective Bullish Setup📝 Description
XRP swept short-term sell-side liquidity on M15 and is now stabilizing above the local demand zone. The current move appears corrective after the sell-off, suggesting a potential bullish reaction toward nearby imbalance levels.
________________________________________
📈 Signal / Analysis
Primary Bias: Bullish while price holds above the M15 liquidity sweep low
Preferred Setup:
• Entry: 2.063
• Stop Loss: Below 2.057
• TP1: 2.074
• TP2: 2.082
• TP3: 2.088 (M30 FVG / descending trendline reaction)
________________________________________
🎯 ICT & SMC Notes
• Clear sell-side liquidity sweep on M15
• Price holding above local demand confirms reaction potential
• Upside targets aligned with unfilled FVG levels
________________________________________
🧩 Summary
As long as price remains above the swept liquidity low, XRP is positioned for a corrective bullish move toward higher PD arrays.
________________________________________
🌍 Fundamental Notes / Sentiment
No immediate negative catalyst affecting XRP sentiment. In a neutral crypto environment, short-term liquidity-driven rebounds remain technically supported.
________________________________________
⚠️ Risk Disclosure
Trading involves substantial risk and may result in capital loss. This analysis is for educational purposes only and does not constitute financial advice. Always apply proper risk management, predefined stop-loss levels, and disciplined position sizing aligned with your trading plan.

Bitcoin’s Structure Is Speaking — Are You Listening?Hello Traders,
If you zoom out and look at Bitcoin calmly, one thing becomes very clear, price is not breaking down, it is building structure. The current movement may look slow on the surface, but underneath, the market is still behaving in a controlled and bullish manner.
Big Picture:– Structure Matters More Than Noise
Bitcoin is currently trading inside a Rising Structure / Bullish Range.
This structure is defined by higher lows and a gradually rising price channel, which tells us that buyers are still in control despite short-term pullbacks.
The upper trendline is acting as dynamic resistance, where temporary profit booking appears.
The lower trendline continues to act as strong support, showing consistent demand on dips.
As long as this structure remains intact, the broader bias stays bullish.
High-Probability Accumulation Zone
This 90.2k – 89.5k zone marked on the chart is not random.
This area was previous resistance , which has now flipped into support.
Price is consolidating above this zone , not breaking below it, a strong sign of acceptance.
Sellers are failing to push price lower , indicating absorption of supply.
This is why this region qualifies as a high-probability accumulation zone, not a chasing zone.
Upside Targets – If Structure Holds
If Bitcoin continues to respect the demand zone and the rising structure, these levels come into play naturally:
Target 1 → 91,825
Target 2 → 93,790
Target 3 → 96,027
These are not predictions :— they are logical reaction levels based on structure and range expansion.
Risk Side:– Structure Invalidation
Every bullish structure has a clear line in the sand.
A clean breakdown below 87,600 would invalidate the current bullish structure.
If that happens, the market would need time to rebuild acceptance before any sustainable upside continuation.
Strong trends don’t start from excitement :—they usually start from patience.
Conclusion :- At the moment, Bitcoin is:
Holding above key demand
Respecting its rising structure
Consolidating instead of breaking down
The next major move will depend not on speed, but on how price reacts around this zone.
If this analysis helped you see the chart more clearly, share your view in the comments,
I’m always open to discussing structure with serious traders.
Analysis By @TraderRahulPal | More analysis & educational content on my profile.

APA Corporation (APA) – Weekly ChartThis is what accumulation looks like before the breakout - not after it.
APA is entering a classic accumulation + compression phase that most traders completely ignore.
Price is tightening inside a well-defined accumulation zone , sitting just below the local resistance at $27.15.
No distribution. No panic. Just time being exchanged for structure .
This is exactly the phase where markets prepare - quietly.
⸻
What the chart is telling us
• Price compression under resistance → pressure is building, not resolving.
• Repeated stabilization inside the accumulation zone → supply is being absorbed.
• No impulsive selling → this is not a topping structure.
When markets stop falling but also stop rising, someone is working orders .
⸻
Key levels
• $27.15 → first structural test. A break and hold changes the short-term narrative.
• ~$33.00 → major long-term resistance. Only above this level does a true trend expansion become possible.
Until then, this remains a pre-decision zone .
⸻
Two possible paths
✔️ Constructive scenario:
Price continues to hold the accumulation zone and eventually breaks above 27.15.
⚠️ Patience scenario:
Compression extends. No breakout yet. More time spent absorbing supply.
Both outcomes are healthy. What’s dangerous is forcing a trade before resolution .
⸻
Question for you
Do you prefer:
• Observing accumulation before the move starts?
or
• Reacting after price escapes the range?
Markets don’t announce accumulation.
They reveal it only to those who watch structure.
Let’s hear your thoughts 👇

MINISO Group Holding (MNSO) - Accumulation Phase After DowntrendMINISO is currently displaying a clear accumulation structure following a prolonged corrective phase. After the prior impulse move higher, price entered a controlled downtrend and has now stabilized back around the long-term mean, where TrendGo Accumulate has been consistently active .
This is an important shift in behavior: instead of acceleration to the downside, price is now moving sideways with reduced volatility , suggesting absorption of supply rather than distribution.
TrendGo System Read
• Accumulate: Multiple accumulation signals have appeared during the base-building phase, historically aligning with areas where downside pressure fades and positioning begins.
• Structure: Price is holding around the long-term reference line, forming a flat, compressed range rather than lower lows.
• Context: Institutional volume remains low, which often characterizes early-stage accumulation rather than late-cycle breakouts.
What matters next
This is not a breakout environment yet - it is a preparatory phase .
For a constructive continuation, we want to see:
• Sustained holding above the accumulation zone
• Gradual expansion in range and participation
• Follow-through rather than single-candle reactions
If price fails to hold the base, the accumulation thesis weakens and the structure resets.
TrendGo perspective
This is how trends are born quietly - compression first, expansion later.
No prediction, no urgency. Context before decisions.
The question is not “ will it go up tomorrow? ”
The real question is whether this base is being respected over time.

Dow Jones Industrial Average H1 HTF FVG Support and Continuation📝 Description
CAPITALCOM:US30 is holding above a higher-timeframe H4/H1 demand zone after a corrective pullback from recent highs. Price respected the BPR and FVG support area and is now stabilizing, suggesting the move is corrective rather than a trend reversal.
________________________________________
📈 Signal / Analysis
Primary Bias: Bullish while price holds above the H1 BPR.
Preferred Setup:
• Entry: 49,130
• Stop Loss: Below 49,050
• TP1: 49,240
• TP2: 49,380
• TP3: 49,520 (HTF draw / higher liquidity)
________________________________________
🎯 ICT & SMC Notes
• Reaction from H4/H1 BPR confirms valid demand
• No bearish HTF BOS observed
• Upside liquidity above recent highs remains the primary draw
________________________________________
🧩 Summary
Dow Jones Industrial is consolidating above key HTF support after a controlled retracement. As long as price remains above the identified demand zone, the expectation favors continuation toward higher liquidity levels in line with the prevailing bullish bias.
________________________________________
🌍 Fundamental Notes / Sentiment
Overall risk sentiment remains supportive for equities, with no immediate macro catalyst signaling aggressive risk-off behavior. In this environment, pullbacks into HTF demand are more likely to resolve as continuation moves rather than deeper trend reversals.
________________________________________
⚠️ Risk Disclosure
Trading involves substantial risk and may result in capital loss. This analysis is for educational purposes only and does not constitute financial advice. Always apply proper risk management, predefined stop-loss levels, and disciplined position sizing aligned with your trading plan.

ZETA – Breakout Confirmed | Primary Wave 3Thesis
NYSE:ZETA is transitioning from long-term accumulation into the early phase of Primary Wave 3 following a confirmed breakout.
Context
- Daily / weekly structure
- Primary Wave 2 completed near $10 (April 2025)
- Wave 1 advanced to ~$22
- Recent phase was a controlled Wave 2 consolidation
What I see
- Price has broken out of the accumulation structure
- Higher highs and higher lows now in place
- Price holding above rising moving-average support
- Former resistance has turned into support
What matters now
- Holding above the breakout level keeps the Wave 3 structure intact
- Pullbacks toward former resistance should be viewed as constructive
- Momentum confirms a shift from accumulation to expansion
Buy / Accumulation zone
- Initial accumulation was completed in the $14–$15 area
- Post-breakout pullbacks into support remain add zones
Targets
- $38 area (structural resistance)
- $65 area (1.618 Fib – Primary Wave 3)
- $100 area (Primary Wave 5 extension)
Risk / Invalidation
- Loss of post-breakout support would delay the Wave 3 scenario

VARONIS (VRNS) - Accumulation zone revisited | Higher-timeframe VARONIS (VRNS) - Accumulation zone revisited | Higher-timeframe context
Price has once again returned to the Accumulate zone , an area that historically marked institutional stabilization rather than distribution.
Looking at the broader structure, this is already the third occurrence where price interacts with this zone after an extended move. In the two previous cases, similar conditions led to strong impulsive advances , once downside pressure was absorbed and the market transitioned back into trend continuation.
From a structural perspective:
• Price is testing a higher-timeframe support area rather than breaking structure.
• Volatility expanded to the downside, followed by compression - a typical behavior during absorption phases.
• No signs of aggressive distribution are visible at this stage.
This setup is best viewed as a contextual accumulation phase , not a timing signal.
The key element here is where price is located in the broader trend, not when to act.
As always, sustainable moves tend to emerge from patience, structure, and momentum alignment , not from chasing short-term reactions.
Context first. Decisions second.

Context Before Decisions | Why This Accumulation MattersMost traders focus on entries.
Professionals focus on context.
⸻
On this chart, price is not doing anything spectacular on the surface.
No breakout. No momentum expansion. No trend acceleration.
And that’s exactly the point.
What is visible here is institutional accumulation behavior :
• Price holding near a long-term reference level
• Reduced downside continuation after selloffs
• Repeated absorption zones marked by Accumulate
This is not a buy signal.
This is information.
Accumulation doesn’t tell you what to do.
It tells you where attention should be focused.
Markets don’t move because of indicators.
They move because capital positions itself quietly before expansion.
If price eventually breaks structure and momentum aligns - this context becomes valuable.
If it doesn’t - the context simply expires.
No prediction.
No hype.
Just preparation.
⸻
Key takeaway:
👉 Context comes before decisions.
👉 Decisions come after confirmation.
⸻
🔒 DISCLAIMER
This analysis is for educational purposes only.
No financial advice. No trade recommendations.
Microsoft (MSFT) - Context after a pullback | 1DThis chart is not about predicting the next move.
It’s about understanding where the market currently is in its process .
After a strong multi-month uptrend, MSFT entered a corrective phase that brought price back toward its long-term mean. Instead of continuing lower, price began to stabilize and compress , forming a base rather than accelerating to the downside.
Notably, this same price area previously acted as a zone of accumulation , where downside pressure faded and longer-term positioning started to build before the next leg higher. The current behavior shows similar characteristics: reduced volatility, overlapping ranges, and diminishing downside follow-through.
This does not imply an immediate continuation or guarantee higher prices.
What it does suggest is a shift from directional movement into a context-building phase , where risk conditions differ from both trend expansion and panic-driven selloffs.
At this stage, the key question is not “how high can it go?”
It’s “is downside risk still expanding, or has it begun to compress?”
Recognizing that transition helps avoid emotional decisions and premature entries during consolidation.
Context first. Decisions later.

ETHUSD - Leverage Ratio Hits ALL-TIME HIGH
BITSTAMP:ETHUSD is trading at approximately 2976 USD after a sharp 28 percent correction from the December 14-15 highs near 3980 USD to the December 18-19 lows around 2850 USD. While the hawkish Federal Reserve meeting triggered this selloff, on-chain data is flashing unprecedented bullish signals. Binance's Estimated Leverage Ratio just hit an ALL-TIME HIGH of 0.611, and the Taker Buy/Sell Ratio spiked to 1.13 - levels not seen since September 2023. Traders are positioning aggressively for upside. The question now: is the capitulation complete, or does high leverage create liquidation risk?
Current Market Context - December 21, 2025
Ethereum experienced one of its sharpest weekly declines in recent months, dropping from nearly 4000 USD to below 2900 USD in just four days. The catalyst was the Federal Reserve December 18 meeting where the central bank delivered a more hawkish stance than markets anticipated, projecting only two rate cuts for 2026.
The selloff was exacerbated by:
Broad risk-off sentiment across all crypto assets
Bitcoin dropping from 108000 USD to below 92000 USD
Over 1 billion USD in crypto liquidations within 24 hours
Ethereum ETF outflows as institutional investors reduced exposure
Year-end profit taking and portfolio rebalancing
However, the bounce from 2850 USD and current stabilization around 2976 USD suggests the initial panic selling may be exhausted. More importantly, on-chain metrics are telling a different story than price action.
CRITICAL ON-CHAIN DATA - Record Bullish Positioning
Estimated Leverage Ratio - ALL-TIME HIGH
Data from CryptoQuant shows Ethereum's Estimated Leverage Ratio on Binance has climbed to 0.611 - the highest level EVER recorded for this metric. This ratio compares open interest to exchange reserves, revealing how much borrowed capital traders are deploying relative to available liquidity.
What this means:
Traders are committing record leveraged positions anticipating favorable price movement
Current reading surpasses ALL previous cycle peaks
This environment amplifies price moves - modest spot changes can trigger large liquidations
Risk appetite among traders is at unprecedented levels
Taker Buy/Sell Ratio - Highest Since September 2023
The Taker Buy/Sell Ratio recently spiked to 1.13 on Binance - a level last observed in September 2023. A reading above 1 indicates market participants are executing more buy orders than sell orders.
Strong taker demand combined with rising leverage reveals optimism dominating short-term sentiment
Historical data shows spikes in this ratio often coincide with increased volatility
Traders are positioning ahead of a potential attempt to reclaim 3000 USD
This buying pressure is notable given ETH is trading around 2900-3000 USD
WARNING: While these metrics are bullish, record leverage is a double-edged sword. If price moves against leveraged positions, liquidation cascades can accelerate downside moves dramatically.
Technical Structure Analysis
Price Action Overview - 45 Minute Timeframe
Analyzing the chart from December 14-21, 2025:
Phase 1 - Distribution and Initial Decline (Dec 14-16):
Price peaked near 3980 USD on December 14
Initial breakdown below 3900 USD signaled distribution
Steady decline through 3800, 3700, 3600 levels
Lower highs forming on each bounce attempt
Volume increasing on down moves - classic distribution signature
Phase 2 - Capitulation Event (Dec 17-19):
Sharp acceleration of selling on December 17-18
Price crashed through multiple support levels without pause
Breakdown from 3400 to 2850 USD in approximately 36 hours
This represented a 16 percent drop in less than two days
Capitulation volume spike visible on the December 18-19 lows
Long wicks on candles near 2850 USD showing buyer absorption
Phase 3 - Stabilization and Accumulation (Dec 19-21):
Strong bounce from 2850 USD low
Price recovered to 2976 USD representing 4.4 percent recovery from lows
Higher lows forming: 2850 to 2880 to 2920 to current levels
Consolidation range establishing between 2950-3000 USD
Decreasing volatility suggesting selling pressure exhaustion
On-chain data confirms accumulation phase is active
Key Support and Resistance Levels
Resistance Levels:
3000-3020 USD - Immediate psychological resistance and round number
3080-3100 USD - Previous support turned resistance from December 17
3200-3250 USD - Major horizontal resistance zone
3400-3450 USD - Secondary resistance from pre-crash consolidation
3600-3650 USD - Major resistance zone
3900-4000 USD - December highs and psychological barrier
Support Levels:
2950-2960 USD - Immediate support from current consolidation
2900-2920 USD - Recent higher low support
2850-2870 USD - Capitulation low and critical support
2700-2800 USD - MAJOR DEMAND ZONE (Analyst Confluence)
2600-2650 USD - Deep support from November 2025 levels
The 2700-2800 Demand Zone - Analyst Confluence
Crypto analyst Ted Pillows has outlined a clear technical roadmap identifying the 2700-2800 USD zone as a major demand area . According to his analysis, ETH recently tapped into this important demand zone and has started to rebound. This move occurred when Ethereum broke below 3000 USD to reach a low of 2781 USD on December 18.
Multiple analysts are highlighting this zone as critical support with strong buyer interest. The fact that price bounced sharply from this area and on-chain metrics show record bullish positioning suggests smart money is accumulating here.
Chart Pattern Analysis
The current structure shows characteristics of a potential falling wedge pattern:
Lower highs connecting from 3980 to 3400 to 3100 area
Lower lows from 3600 to 3000 to 2850
However, the most recent price action shows higher lows forming off 2850
This divergence between lower highs and higher lows creates compression
Breakout direction will determine next major move
Falling wedges typically resolve to the upside
Fibonacci Retracement Analysis
Measuring from the November 2025 low (approximately 2400 USD) to the December 2025 high (3980 USD):
0.236 retracement: 3607 USD - Already broken
0.382 retracement: 3376 USD - Already broken
0.5 retracement: 3190 USD - Already broken
0.618 retracement: 3004 USD - Currently testing this level
0.786 retracement: 2739 USD - Held as support (low was 2850)
The bounce from near the 0.786 Fibonacci level is significant. This deep retracement level often marks the end of corrections in strong trends. The current test of the 0.618 level (3004 USD) will be crucial - a reclaim would be bullish, rejection would suggest more downside.
Fundamental Analysis
Federal Reserve Impact
The December 18, 2025 FOMC meeting was the primary catalyst for the selloff:
Fed held rates steady but projected only two rate cuts for 2026
Markets had priced in three to four cuts, creating hawkish surprise
Fed Chair emphasized data dependency and willingness to maintain restrictive policy
Higher-for-longer rates increase opportunity cost of holding crypto assets
Risk assets across the board sold off following the announcement
Altcoin Season Approaching - January 2026
A growing number of market analysts believe the long-awaited altcoin season may finally arrive in January 2026, with new data suggesting a shift in liquidity conditions. Ethereum's market behavior has attracted analysts who are highlighting a shift in leadership, typically seen only after a strong Bitcoin rally.
This is significant because:
Bitcoin has already made its major move from 60K to 108K
Capital rotation into altcoins typically follows BTC dominance peaks
ETH historically leads altcoin rallies
January sees fresh institutional allocations entering the market
Ethereum-Specific Fundamentals
Despite the price decline, Ethereum fundamentals remain constructive:
Ethereum staking continues to grow with over 34 million ETH staked
Layer 2 adoption accelerating with Base, Arbitrum, and Optimism seeing record activity
Ethereum ETF infrastructure now established providing institutional access
Pectra upgrade scheduled for Q1 2026 bringing account abstraction improvements
DeFi Total Value Locked on Ethereum remains above 60 billion USD
Security Concerns - Risk Factor
The crypto space continues to face security challenges:
December 20: A trader lost nearly 50 million USD in USDT to an address poisoning attack
2025 has seen over 3.4 billion USD in crypto thefts - a record year
The February Bybit hack (1.4 billion USD) accounted for 44 percent of annual losses
These incidents create headline risk and can spook retail investors
However, institutional infrastructure and security practices continue improving
ETF Flow Analysis
Ethereum ETF flows have been mixed:
December saw net outflows as institutions reduced risk exposure ahead of year-end
The post-Fed selloff accelerated ETF redemptions
However, long-term institutional interest remains intact
January typically sees renewed institutional buying as new year allocations begin
ETF structure provides easier access for institutions to re-enter on dips
Ethereum vs Bitcoin Analysis
The ETH/BTC ratio provides important context:
ETH has underperformed BTC during this correction
ETH/BTC ratio declined from 0.037 to 0.032 area
This underperformance is typical during risk-off periods
However, ETH tends to outperform during recovery phases
Vitalik Buterin himself said years ago he would respect a technically competent rival - but none has emerged
A stabilization in ETH/BTC would be early signal of ETH strength returning
Directional Bias Assessment
Arguments for Bullish Reversal:
LEVERAGE RATIO AT ALL-TIME HIGH (0.611) - Record bullish positioning
TAKER BUY/SELL RATIO AT 1.13 - Highest since September 2023
Capitulation volume and price action suggest panic selling exhausted
Bounce from 0.786 Fibonacci level is technically significant
2700-2800 demand zone confirmed by multiple analysts
Higher lows forming off the 2850 USD bottom
Exchange outflows during dip suggest accumulation occurring
Altcoin season expected January 2026 per multiple analysts
Strong fundamental backdrop with staking growth and L2 adoption
Pectra upgrade catalyst approaching in Q1 2026
Arguments for Bearish Continuation:
Price remains below all major moving averages
No confirmed trend reversal pattern yet
Fed hawkishness could continue pressuring risk assets
RECORD LEVERAGE = LIQUIDATION RISK if price drops
ETH underperforming BTC suggests relative weakness
Holiday liquidity conditions could exacerbate any selling
3000 USD psychological resistance may cap rallies
Security concerns (50M hack, 3.4B stolen in 2025) create headline risk
ETF outflows may continue into year-end
My Assessment - Bullish with Leverage Caution:
The weight of evidence leans bullish. Record on-chain metrics showing unprecedented trader positioning for upside, combined with technical support holding and analyst confluence on the 2700-2800 demand zone, suggests the capitulation low should hold.
HOWEVER - the record leverage is a double-edged sword. If 2850 breaks, liquidation cascades could accelerate the move down significantly.
Bullish Confirmation: A daily close above 3050 USD with volume would confirm the bottom and open path to 3200-3400 USD.
Bearish Confirmation: A break below 2850 USD would trigger leveraged liquidations and open path to 2600-2750 USD.
Short-term (next 1-2 weeks): Bullish bias. On-chain data strongly supports upside. Expect attempt to reclaim 3000 USD and test 3200 USD.
Long-term (1-3 months): Bullish. Altcoin season catalyst in January, Pectra upgrade in Q1, and structural drivers intact. Targets of 3400-3600 USD valid for Q1 2026.
Trade Framework
Scenario 1: Bullish Breakout Trade
Entry Conditions:
45-minute candle closes decisively above 3020 USD
Volume on breakout candle exceeds recent average
RSI breaks above 55 confirming momentum shift
Trade Parameters:
Entry: 3025-3050 USD on confirmed breakout
Stop Loss: 2920 USD below recent higher low
Target 1: 3150-3200 USD previous support zone
Target 2: 3350-3400 USD major resistance
Target 3: 3550-3600 USD extended target
Risk-Reward: Approximately 1:2.5 to first target
Scenario 2: Buy the Dip at Demand Zone
Entry Conditions:
Price retests 2700-2800 USD demand zone
Bullish rejection candle with long lower wick
RSI showing oversold bounce
Volume spike on the bounce candle
Trade Parameters:
Entry: 2750-2800 USD on demand zone retest
Stop Loss: 2650 USD below demand zone
Target 1: 3000-3020 USD psychological resistance
Target 2: 3150-3200 USD major resistance
Target 3: 3350-3400 USD extended target
Risk-Reward: Approximately 1:3 to first target
Scenario 3: Bearish Breakdown Trade
Entry Conditions:
45-minute candle closes below 2850 USD
Volume confirmation on breakdown
Leverage liquidations begin cascading
Trade Parameters:
Entry: 2840-2850 USD on confirmed breakdown
Stop Loss: 2920 USD above recent consolidation
Target 1: 2750-2780 USD secondary support
Target 2: 2650-2700 USD major support
Target 3: 2500-2550 USD extended target
Risk-Reward: Approximately 1:2 to first target
Risk Management Guidelines
Position sizing should not exceed 2-3 percent risk per trade
CRITICAL: Record leverage means volatility will be amplified
Reduce size during holiday period due to lower liquidity
Use hard stop losses - liquidation cascades can move price fast
Scale into positions using multiple entries rather than single entry
Take partial profits at each target level (33 percent at each)
Move stop to breakeven after first target achieved
Monitor BTC price action as correlation remains high
Invalidation Levels
Bullish thesis invalidated if:
Price closes below 2700 USD on 4-hour or daily timeframe
Lower low forms below the December 18-19 capitulation low
ETH/BTC ratio breaks to new lows below 0.030
BTC breaks below 88000 USD triggering broader selloff
Bearish thesis invalidated if:
Price closes above 3200 USD with volume
Higher high forms above 3100 USD
RSI breaks above 60 with momentum
ETH/BTC ratio recovers above 0.036
Conclusion
BITSTAMP:ETHUSD has experienced a sharp 28 percent correction from the December highs near 3980 USD to the capitulation low around 2850 USD. While the Fed meeting triggered the selloff, on-chain data tells a powerfully bullish story.
The Numbers That Matter:
Leverage Ratio: 0.611 - ALL-TIME HIGH
Taker Buy/Sell Ratio: 1.13 - Highest since September 2023
Demand Zone: 2700-2800 USD - Multiple analyst confluence
Fibonacci Support: 0.786 level held (2739 USD)
Key Levels to Watch:
3000-3020 USD - Breakout confirmation level
2850 USD - Critical support / capitulation low
2700-2800 USD - Major demand zone
3200 USD - Major resistance for trend confirmation
Trading Approach:
The on-chain data strongly favors bulls, but record leverage means you must respect risk management. Wait for either:
Bullish breakout above 3020 USD with volume to confirm bottom
Retest of 2700-2800 USD demand zone for lower-risk long entry
Breakdown below 2850 USD to flip bearish (watch for liquidation cascade)
Altcoin season approaching in January 2026 provides a macro tailwind. The setup favors patient bulls who manage risk appropriately.
Drop your comments below on the next move for ETH!
