NAS100 (4H) — Wait for flow confirmationNAS100 is still in a heavy 4H selloff — so I’m not interested in forcing a long right now.
Framework:
• Price is approaching a lower reaction area (potential demand / liquidity zone).
• The plan is wait first, then read momentum.
What I want to see on ARVEX Flow Oscillator:
• Exhaustion: downside flow stops expanding and starts to flatten in the lower region.
• Shift: oscillator begins to curl up and the histogram fades (less downside pressure).
• Confirmation: a reclaim toward/above the midline would support a stabilization thesis.
If flow keeps accelerating lower: no long attempts — stay patient and reassess at the next zone.
Educational / analytical use only. Not financial advice.
Action

US500 Probability Corridor → Bearish Scenario Building | ARVEX SUS500 is currently trading inside a structured probability corridor following a lower-high formation, suggesting weakening bullish momentum on the 4H timeframe.
The ARVEX Scenario Engine has locked a bearish directional bias, projecting two downside target zones derived from recent swing behavior and volatility conditions.
Z1 represents the conservative path — the area where price is statistically more likely to react first.
Z2 reflects an extended volatility path if downside momentum accelerates.
As long as price remains inside the corridor and fails to reclaim higher structure, the current framework favors continued downside exploration.
A confirmed breakout beyond the corridor would invalidate this scenario and trigger a new structural analysis.
This publication is intended for market context and analytical purposes only — not financial advice.

Order Block Tapped – Monitoring for Rejection vs. BreakoutGold has officially arrived at the $5,090 – $5,115 Bearish Order Block, a critical zone that previously acted as a "trap" for buyers before the recent crash. The price is currently reacting to this level, and while we are seeing a "small rejection" in the form of upper wicks on the 1H and 4H charts, the overall structure remains in a precarious balance.
Technical Evidence at the Block:
The Tap: The price hit the lower boundary of the supply cluster near $5,081 earlier today.
Rejection Signs: We are seeing initial signs of selling pressure as the RSI nears the overbought territory (60+) on smaller timeframes, which often triggers a "mean reversion" back toward the psychological $5,000 handle.
Liquidity Context: This Order Block sits right at the 50% retracement of the massive January collapse. Historically, smart money uses this "Premium" zone to close out long positions or enter new shorts.
Wait-and-See: With the US monthly jobs report delayed to February 11, the market is currently lacking the high-volume catalyst needed to break through this wall Decisively
The Rejection Case (Short-Term Bearish):
If 4H candles continue to close with long wicks inside the $5,090 – $5,115 zone, expect a "small rejection" back toward $4,937 – $4,950 (The Discount Demand).
The Breakout Case (Long-Term Bullish):
A clean daily close above $5,115 would invalidate this Order Block, turning it into a "Breaker Block" and opening the doors for a parabolic move toward $5,269 – $5,400.
Current Key Levels:
Immediate Resistance: $5,090 – $5,115 (The Tapped OB)
Immediate Support: $5,000 (Psychological Floor)
The "Safety" Zone: $4,937 (200-period EMA)
Final Thought: The Order Block has been tapped. We aren't chasing the move here—we are waiting to see if the rejection holds. If the bears can't push it back below $5,000, then this "rejection" is just a pause before a massive breakout.

#202603 - priceactiontds - weekly update - dax futuresGood Evening and I hope you are well.
comment: Neutral. 1605 points up and we pulled back for 242 last week. Disgustingly overbought and overdone but that fact does not make you money in this profession. Opex is behind us and we could see a decent pullback before more upside. My target is still around 25000 for W4 before we will likely do another leg up if no news-bomb hits.
current market cycle: bull trend
key levels for next week: 24900 - 26000
bull case: 8th consecutive green. Bulls still not taking bigger profits and we barely move down. Can only expect more upside. Can the orange face tariff-scare round #24 scare the markets? Just stop. It would need a much more serious escalation before markets begin to care again. Too much TACO in 2025. 26000 is the obvious target but I doubt we will get there without touching 25000 again first.
Invalidation is below 24600
bear case: Bears are barely making money. We should pull-back to 25000 but the chart gives the bears absolutely nothing. Even if we get to 25000 I doubt many bears will hold and I expect bulls to heavily buy it for another strong leg up.
Invalidation is above 26200
short term: Slightly bearish for 25000ish but ultimately expecting 26000 to get hit before the trend line breaks.
medium-long term - update 2026-01-10: 26000 is likely. This is as overdone and overbought as a market can be.

#202603 - priceactiontds - weekly update - nasdaq e-miniGood Evening and I hope you are well.
#mnq1 - nasdaq e-mini futures
comment: Neutral as can be. 25650 is the equilibrium and we closed 25689. Don’t make more out of this than there is. Contracting trading range (triangles) and we will likely break out next 2 weeks. I do think bulls are favored but we can always get a bear trap first. It would be very strong by the bulls if we stay above 25500 and just go up. I do think a lower low trap is more likely though.
current market cycle: trading range since November / currently a ascending triangle which will likely break to the upside soon
key levels for next week: 25200 - 27000
bull case: Higher lows but mostly sideways. No side has a clear advantage but earnings are around the corner and what are the odds of Q4 disappointing? Low. Very very low. So are bulls heavily favored for another bullish breakout? Maybe not heavily but if I had to take a trade it would be long. We have many markets with obvious higher targets. I would be patient though and see how this Greenland excrementshow plays out on Monday/Tuesday and only join the bulls if we see big buying volume coming through.
Invalidation is below 25200
bear case: The chart is clear, higher lows and the pullbacks got increasingly smaller. Bears just have to give up above 26000 because we could go up to 26500 or even 27000. This has not changed. The best the bears can hope for is a sell spike and I think most will quickly cover if we stall or pull back. Only a huge trade-war escalation could turn the markets - at least on this topic. Q4 earnings could maybe disappoint but I highly doubt that.
Invalidation is above 26200
short term: Expecting a sell-spike and then higher highs and a re-test of the ATH and most likely a new one and even 27000.
medium-long term - Update from 2026-01-10: New ath most likely soon.

MNQ (15m) POI Map — Why These Levels Matter and how to use themMNQ (15m) POI Map — Why These Levels Matter (and how I’m using them)
I don’t like “winging it” once the market starts moving fast. So before the session (or during quieter pre-market hours), I mark **Points of Interest (POIs)** that I expect price to **react from**—either as support/resistance, liquidity targets, or “decision zones” where bias can flip.
These POIs are not magic lines. They’re **locations where order flow has already proven itself**, and where I want to be *ready* instead of *surprised*.
---
## How I chose these POIs (my filter)
Each POI on this chart was mapped using 3 things:
1. **Structure (15m swings / pivots)**
Where price previously *broke structure* or *rejected hard*.
2. **Liquidity (obvious targets)**
Equal highs/lows, clean swing points, and “everyone sees it” areas where stops sit.
3. **Reaction history (clean reactions)**
Levels that have already caused a noticeable bounce, stall, or reversal = worth respecting again.
---
## The Levels (Bull POIs)
### **BULL POI #1 — 25,810.50**
This is my **first decision level** in the current zone. It’s the closest “line in the sand” where:
* Holding above it keeps bullish continuation alive
* Losing it opens the door for a rotation back into the lower POIs
**How I use it:**
If we tag this area and **hold/accept above** (strong bodies, wicks getting bought, reclaim after a sweep), I’m looking for longs targeting the next POI up.
---
### **BULL POI #2 — 25,874.25**
This one is a **higher pivot / reaction zone**—the type of level where price often:
* pauses to consolidate
* rejects for a pullback
* or breaks through and turns into support
**How I use it:**
If price is trending up, this is a logical **first major target** and a spot to either scale profit or look for a clean break-and-retest to continue.
---
### **BULL POI #3 — 25,927.00**
This is a **liquidity + swing area**. It’s the kind of level that’s attractive for:
* stop runs above prior highs
* profit-taking
* reversal setups if momentum stalls
**How I use it:**
I treat this as a “reaction expected” level. If we arrive with weak momentum, I’m cautious chasing longs into it.
---
### **BULL POI #4 — 25,949.25**
This is my **upper extreme POI**—usually a bigger “decision area” where:
* late longs get trapped if momentum dies
* reversals can form (especially after a sweep)
* or we get continuation if the tape is strong
**How I use it:**
I’m more likely to **take profit into this** than initiate fresh longs unless the market is clearly in expansion.
---
## The Levels (Bear POIs)
### **BEAR POI #1 — ~25,754 zone (25,754.25 on my map)**
This is my **bearish trigger / pivot**. If price loses Bull POI #1 and continues lower, this becomes the next major “prove it” level.
**How I use it:**
If we break down into this area and **reject** (heavy wicks, failed reclaim), I’ll look for continuation shorts toward the next bear POIs.
---
### **BEAR POI #2 — 25,649.75**
This is a deeper **demand/reaction pocket**—a level I expect price to *respect* or at least *pause* at.
**How I use it:**
This is a common “bounce zone.” If shorts are in profit, I’m scaling here. If we sweep it and reclaim, I’m watching for reversal setups.
---
### **BEAR POI #3 — 25,622.25**
This is the **lower extreme / liquidity pool** level—where panic moves can exhaust and snap back.
**How I use it:**
I’m not trying to short *into* this level late. This is where I expect **either**:
* a final flush and reversal attempt
**or**
* a strong breakdown continuation (if the day is truly risk-off)
---
## The whole point of mapping POIs
These levels give me a simple plan:
* **Hold above Bull POI #1 → bullish bias stays active**
* **Lose Bull POI #1 → expect rotation to Bear POI #1**
* **Each POI is either a target, a reaction zone, or a bias flip zone**
I’m not predicting. I’m preparing.
---
## Execution Rules (what I wait for at a POI)
At any POI, I want confirmation like:
* **Sweep + reclaim** (liquidity grab then strong close back through)
* **Break + retest** (clean structure change)
* **Rejection candles** (wicks + follow-through away from the level)
* **Acceptance** (multiple closes above/below = level flips)
Then I manage risk using a simple concept:
**Invalidation goes just beyond the POI. Targets are the next POI.**
---
### If you’re using my tool stack:
These POIs pair well with:
* **ORB direction/bias**
* **VWAP/EMA context**
* **Reversal confirmations** (only when the POI + context agree)
---
**Not financial advice. Futures are high risk—size accordingly and protect your downside.**
If you want, I can turn this into a cleaner “TradingView publish-ready” format with a tighter intro + bullet layout, and add your usual TRADESWITHB call-to-action at the end.

Axis Bank | Gann Square of 9 Intraday Case Study (12 Nov 2024)This idea shares an intraday case study illustrating how price reacted to a Gann Square of 9 angle level.
On 12 November 2024, Axis Bank showed early strength from the first 15-minute candle.
The initial intraday low around 1166 was considered the 0-degree reference, following WD Gann’s price–angle methodology.
Using Square of 9 calculations, the following key level was identified:
45° level → 1183
Price reached the 45-degree level very early in the session (around 9:30 AM), much before the ideal time window typically observed for balanced moves.
This early completion of price capacity indicated a potential price–time imbalance.
After touching the 45° level, Axis Bank showed clear rejection and downside follow-through, resulting in a clean intraday decline from that zone.
🔍 Key Takeaways from This Study
Identify a clear 0-degree base from intraday structure
Calculate the 45° angle as normal price expansion
Early arrival at an angle can signal exhaustion
Price–time imbalance helps locate high-probability reversal areas
This case demonstrates how structured geometric analysis can be used to study intraday market behaviour logically instead of guessing.
Disclaimer:
This idea is shared for educational and chart-study purposes only.
It does not constitute trading advice or recommendations.

Axis Bank | Gann Square of 9 Intraday Case Study (07 Feb 2025)This idea documents a recent intraday example of applying WD Gann’s Square of 9 to estimate downside capacity and potential reaction zones using price–angle relationships.
On 07 February 2025, Axis Bank showed weakness from the very first intraday candle, indicating a potential one-directional move during the session.
In such situations, Gann methodology allows traders to evaluate how far price may travel based on its normal and exceptional intraday capacity.
Using the session’s reference price as the 0-degree base, the following projections were calculated:
• 45° level → normal intraday capacity
• 90° level → exceptional intraday capacity
As price declined, it reached the 45-degree projection around 10:30 AM, well before the late-session time window. Near this level, price showed stability and a visible pause, followed by a tradable intraday bounce.
🔍 Key Observations from This Case
• Early directional bias helps define intraday expectations
• Square of 9 allows pre-calculation of downside capacity
• Reaching 45° before the late session often signals normal exhaustion
• Reactions at geometric levels can provide structured study points
This case highlights how price geometry and time alignment can be used to study intraday behaviour in a disciplined and rule-based manner.
Disclaimer:
This content is shared strictly for educational and analytical purposes only.
It does not constitute trading advice or recommendations.

Axis Bank | Intraday Forecasting Using Gann Square of 9 (01 Apr This idea presents an intraday case study demonstrating how WD Gann’s Square of 9 can be applied to identify probable resistance zones using price–angle relationships.
On 01 April 2024, Axis Bank showed early intraday strength after the opening session.
The first 15-minute low was used as the 0-degree reference point, following classical Gann methodology.
Based on Square of 9 calculations, the following projected levels were derived:
• 45° level (normal intraday capacity) → 1064
• 90° level (expanded / rare capacity) → 1081
As price advanced during the session, it approached the 45-degree level before the late-session time window. Around this zone, price showed clear hesitation and rejection, followed by intraday weakness.
🔍 Key Observations from This Study
• Use the first intraday pivot to define the 0-degree base
• Calculate angle-based projections using Square of 9 logic
• Observe time alignment when price reaches projected levels
• Reactions near 45° often indicate normal resistance behaviour
This example highlights how rule-based price geometry helps traders study intraday behaviour in a structured and disciplined way, without relying on indicators.
Disclaimer:
This post is shared strictly for educational and chart-analysis purposes only.
It is not a trading recommendation or financial advice.

Axis Bank | Gann Square of 9 Case Study (21 Oct 2024)This idea presents a chart-based case study showing how price respected a key geometric level derived from the Gann Square of 9 during an intraday session.
On 21 October 2024, Axis Bank opened with volatility and began declining from its first major pivot.
Using Gann’s price–angle principle, the session high was treated as the 0° reference point.
From this reference, two important intraday levels were identified using Square of 9 calculations:
• 1214 → 0° reference
• 1197 → 45° angle level
As per classical Gann observations, when price approaches a 45° level within the active session, it often acts as a point of balance between time and price.
In this case, Axis Bank reached the 1197 level well before the late-session time window, where price showed a clear reaction and short-term upside movement from that zone.
🔍 Key Observations from This Study
• Establish a clear 0° reference from a significant intraday pivot
• Derive angle-based levels using Square of 9 logic
• Observe time alignment along with price levels
• Geometric levels can help anticipate logical reaction zones, rather than guessing
This example demonstrates how price, time, and geometry can be studied together to understand intraday behavior in a structured manner.
Note:
This post is shared purely for educational and analytical discussion of chart behavior.
It is not a trade recommendation or financial advice.

CAD/JPY: Bullish Continuation Setup - Buy Above 111.33The CAD/JPY pair has completed a bullish wave structure and is now showing a healthy pullback, creating a high-probability continuation setup.
WAVE STRUCTURE ANALYSIS:
✅ Completed bullish wave formation
✅ Pullback has traded below Structure 4
✅ Continuation remains valid above Structure 2 (110.96)
TRADE SETUP:
📍 Entry: Buy above 111.33 (signals uptrend resumption)
🛑 Stop Loss: 110.96 (Structure 2 invalidation point)
🎯 Target 1: 112.46 (Fibonacci key ratio projection)
🎯 Target 2: 112.97 (Extended Fibonacci target)
FIBONACCI ANALYSIS:
Using key ratio Fibonacci measurement from the complete wave structure low to high, we've identified clear target zones for profit-taking.
RISK MANAGEMENT:
Price must hold above 110.96 for bullish bias to remain valid
Entry above 111.33 confirms momentum resumption
KEY LEVELS TO WATCH:
📌 Critical Support: 110.96
📌 Entry Trigger: 111.33
📌 Resistance 1: 112.46
📌 Resistance 2: 112.97
METHODOLOGY: WavesOfSuccess Price Behaviour Analysis

BTC – Key Breakout or Major Breakdown? Critical Zone Decides BTC is currently trading within a complex decision zone formed after breaking out of the descending trendline and reacting around the 0.618–0.786 retracement levels. Price is consolidating beneath a major resistance cluster, where both liquidity and trapped buyers are positioned. This behaviour typically precedes a strong directional expansion.
The structure now presents two potential paths, with one showing higher probability based on market context. Despite the short-term bounce, the broader flow remains corrective, and the reaction from the rejection block continues to dominate. As long as BTC remains capped under this resistance region, downward continuation remains the favoured scenario.
Key Observations:
• Price broke the previous descending trendline but failed to establish a sustained higher-high.
• The 0.618–0.786 Fibonacci block is acting as a heavy supply zone.
• Liquidity remains untouched below, aligning with the measured move projections.
• Local consolidation is forming beneath resistance, often a bearish continuation signal.
• The 1.0 and 1.618 extensions project into the 77,360 and 70,817 regions respectively.
Primary Scenario:
BTC may attempt a minor push toward the higher retracement level but, unless it reclaims the supply block decisively, a larger breakdown into the lower support regions becomes increasingly likely. The liquidity zones below remain the most attractive targets for market makers.
Invalidation:
A clean breakout above the supply block with continuation and acceptance would invalidate the bearish scenario and shift the bias to bullish expansion.
In simple terms:
BTC is sitting at a decisive resistance. If it cannot break above this zone, the market is likely preparing for a deeper fall toward the lower targets. If it breaks above with strength, the downside idea is no longer valid.

Gold 🔵Entry
🔴SL
🟢TP
*`ANALYSIS`*
1. Strong support level respected several times
2. 30 min candle closed below support, meaning support is broken
3. Didn't sell cause the SL would have been big & the candle was breaking the previous candles low in first 2minutes without making a liquidity wick first.
*`Entry`*
When price broke the low of previous exhaustion candles wick with stops above the previous 15min candle high.
*`Set-up`* Impulse Entries
*`Session`* Pre-London
*`Trade Result`*
+0.8%💰
+24pips🎯

#202546 - priceactiontds - weekly update - dax futures Good Evening and I hope you are well.
comment: We are almost exactly where we were 1 week ago and unless we stay below 24000 on Monday, there is a decent chance we will see a very similar week with support around 23600 and resistance around 24560. Clear triangle with mid-point around 24000. As of now there is nothing happening that could lead us to think this can make lower lows and head for 23000. Something needs to happen. What would that take? I don’t care for the reason tbh but I would need to see a bear gap staying open and continuous selling below 23600 with a big down day, closing at the lows. Otherwise it will just trade back up like literally every sell-off since June.
current market cycle: trading range (contracting triangle)
key levels for next week: 23600 - 24600
bull case: No side is favored so I spare you long texts for both sides. Bulls want to hit 24400+ again and they need to keep the market above 23500 or risk more downside.
Invalidation is below 23600ish.
bear case: Bears want lower lows below 23515 and expand the range to the downside. As of now I doubt they are strong enough for that. Much more likely that most bears will wait for higher prices above 24300 before shorting again.
Invalidation is above 24570.
short term: Neutral. Fade the extremes until we expand the range again.
medium-long term - from 2025-11-16: Still expecting 23000 to get hit this year.

#202546 - priceactiontds - weekly update – nasdaq e-miniGood Evening and I hope you are well.
comment: Again, not much difference to dax. Also in a triangle and for now I highly doubt we will see a big range expansion out of 24600 - 25500. We had two weeks where the bears showed strength but what do they have to show for? We closed above 25000 in both weeks. That’s still as bullish as it gets. Only a bearish daily close below 24600 could change my outlook.
current market cycle: trading range 24000 - 26500 / 4h chart it’s a triangle 24700 - 25500
key levels for next week: 24500 - 25500
bull case: Bulls bought 24700 heavily again and closed the week above 25000. Bears can have no confidence in shorts when we rally for 667 points after a 1095 point drop. Problem for the bulls is that they also have to be very careful with buying high again since the downside can be huge. Which will likely mean that we won’t see much interest in buying above 25400ish. Even longing 25000 when we can drop down to 24600 or lower, is a tough trade.
Invalidation is below 24709.
bear case: Every dip is heavily bought. Has not changed. Can only become more bearish with a daily close below 24000 and that’s far. 25830 is likely the stop, most bears have to have for most shorts next week. That’s a big range and it any short below 25300 from being decent imo. We are making lower highs and lower lows but the lower lows just barely. Until that changes, we will most likely continue sideways in the given range.
Invalidation is above 25830.
short term: Neutral around 25000. Short closer to 25700 and longs closer to 25600.
medium-long term - Update from 2024-11-02: Market went further in the wrong direction so my targets become increasingly unrealistic. Right now the 50% retracement is 21750 and would mean a 18% drop. That’s a bit too much to ask for as of now. 24150 is the breakout-retest of the prior ath from 2024-12 and a more realistic target.

GBPUSD 1Month1️⃣ Yearly:
The IRL liquidity was taken last year. However, since the beginning of this year, the movement appears to be targeting the IRL level. (12.10.2025)
2️⃣ 2–3 Monthly:
In the first quarter, the price made a fake drop, collected liquidity, and closed the first two quarters with bullish candles.
In the third quarter, the price took the second-quarter high liquidity and closed bearish.
In the fourth quarter, I believe the decision for a bullish outlook will depend on the reactions the price gives in the 3M FVG zone.
3️⃣ Monthly:
When viewed on the monthly timeframe, our current DOL level aligns with the 3M FVG and the Relative Equal Lows formed on the monthly chart. We are currently observing how the price will react around this area.

BUY GBPUSDIf the price reaches our entry point, you can enter the trade, but please don't forget to take profit.

btcusdtppingpong bols for btc this friday to monday Bitcoin is currently trading around $123,839 USD.
On technicals, many moving averages and momentum indicators are generally giving “buy” or bullish signals (e.g. 5-day, 10-day, 20-day MAs) (per TipRanks)
TipRanks
Support zones are being watched around $109,061, $101,015, and $84,387
MarketScreener
Resistance zones (or supply zones) are around $117,126, $123,375, et

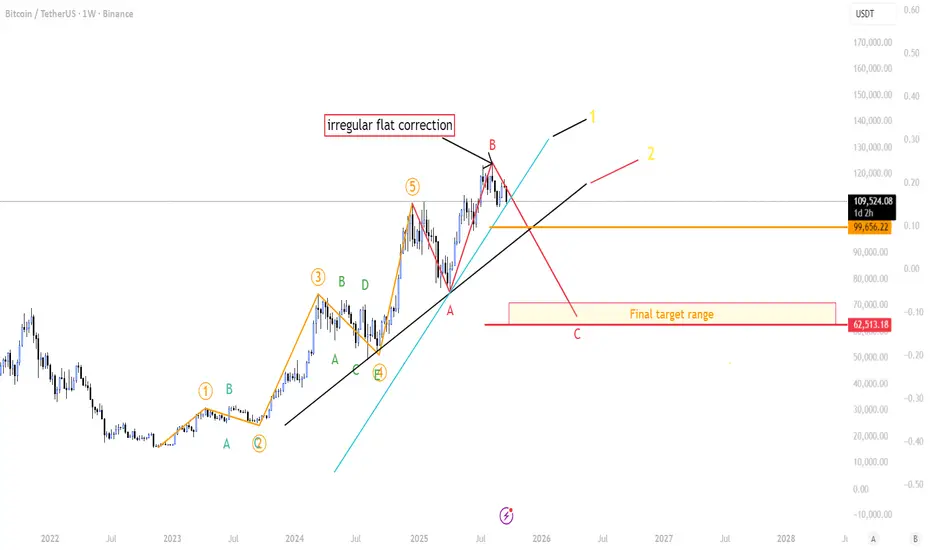
BTC at a Crossroad: Path to 62.5k Is Conditional-Pick Your PlayI’m sharing a possible irregular flat correction that could pull BTC toward ~62,513—only if two key trend supports break.
Note: This Elliott count differs from my main count. It’s my secondary scenario—lower conviction, but it deserves close attention because the structure is developing cleanly. This does not mean BTC is going down (it's just a watch out scenario)
The story so far
From the Nov 22, 2022 low, BTC ran a full 5-wave impulse.
Wave 3 was the extended one.
Wave 4 formed a triangle.
Wave 5 ran hotter than expected (roughly the size of Wave 3). That’s unusual, likely fueled by extreme Bollinger Band Width compression before the final push.
Why this matters: when Wave 3 extends, Wave 5 is usually shorter. It isn’t a hard rule—just a guideline—so this count stays on the board, but it’s not a high-conviction setup.
What I think is happening now
The drop and bounce look like an expanded (irregular) flat: (A) down, (B) up which was our All time high, C down.
If the pattern completes, C could target ~62,513.
Quick pattern note (irregular flat): It’s a 3–3–5 structure — A = 3 waves, B = 3 waves (often pokes above the prior high), and C = 5 waves. On this chart, A and B already printed as 3 + 3. The setup isn’t confirmed until we see C unfold as a clear 5-wave move (1-2-3-4-5). No five-wave C = no completed irregular flat.
What would confirm it (the “if/then”)
Lose the first rising trend support (≈ 109k).
Then lose the second, deeper trend support.
If both break, the path toward ~62.5k could be opening up.
Between those two lines: BTC can go sideways for a weeks—that “range box” is important.
Why the range box matters (Altseason meter)
Altcoins usually need steady BTC to fly:
BTC sideways (not spiking up or dumping).
TOTAL2 (alt mkt cap) breaks ATH.
BTC.D rolls over (dominance falls).
If these three line up, we’ve got a real altseason setup. If not, it’s noise.
Bottom line
This is a watchlist scenario, not gospel.
I’ll respect the levels: no break = no bear target.
If we range between supports, I’ll look for alt strength while BTC stays calm.
GBPJPY SELL SWEET SETUP SHOOOOOOOOOOOOORT HHHHHHHHHI think we should research selling opportunity
because we have uptrend line has broken and tested
and we have bearish channel and the price reflect from resistance on time frame 1W
SO SHORTLY i will sell Especially since we have a rebound from the imbalance as well.
Look at this picture as it makes it clearer to you

A slight pullback to around 112,000 is expected before a bullishThere is a double top on the daily timeframe. It could pull back to the previous support level that I mentioned in the chart. Moreover, there is a healthy trendline support that can help BTC price bounce.

XAUUSD , 1D , Short Pattern is breaking Down , it is looking very good
Risk According to your Capital .

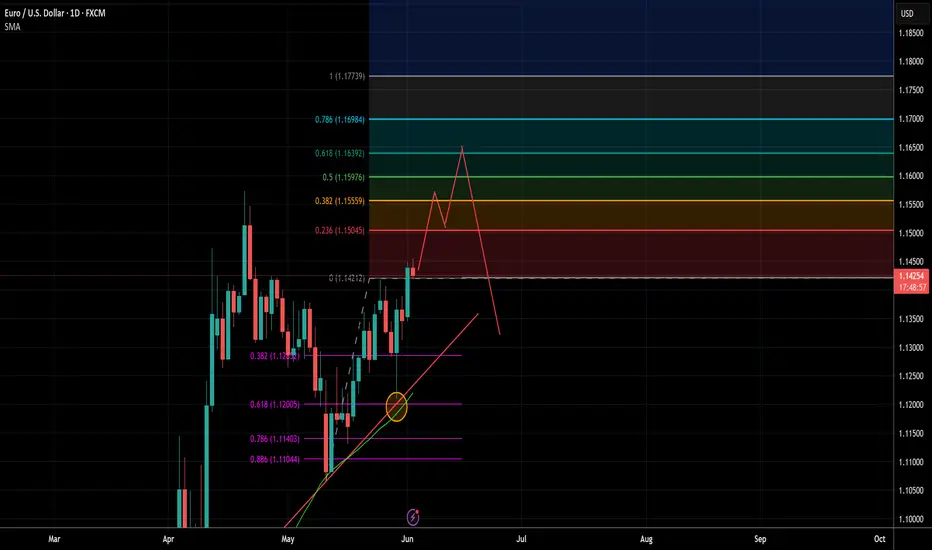
EURUSD - Swing Short Potential OpportunityEURUSD may potentially retest the previous high and trade between fib extension levels 38.2% and then range potentially in that level before pushing higher to the 61.8% extension level retesting and breaking out for a liquidity grab and stop hunt for retails before pushing back down trending back to the mean and retesting previous floor. The 1.1550 & 1.1650 are key historic levels where there has been lots of EURUSD previous action. Expect price to bounce around these areas and trap longs what I think has a high probability of happening per my prediction.