ADA's SituationAfter the drop, the price can slightly bounce back up if buyers support it and we have a price correction. If the red trendline is broken, the price can move to the ranges we have specified.
Best regards CobraVanguard.💚
ADAUSDT

ADA About to Explode? Smart Money Is Loading!!!Yello Paradisers! Are you paying close attention? Because if you're not watching #ADA right now, you might completely miss the next explosive move. The breakout has already started, and smart money is already positioning Because #ADA broke out the descending resistance and start taking support, and if you're not prepared, you might miss out on a huge opportunity. Additionally, we are seeing selling climax has been formed, a classic probability that institutional buyers are stepping in. This is where things start to get exciting.
💎#ADA has just formed a classic selling climax, followed by a climactic action candle with ultra-high volume a textbook sign of accumulation. This is the kind of behavior we’ve seen over and over again when smart money starts positioning quietly before the real move begins.
💎After the selling climax, #ADA successfully swept liquidity of the selling climax a strong possibility that weak hands are out and stronger ones are stepping in. The key trigger now lies just above the upper line of the climactic action bar. If #ADA breaks above that level with a strong momentum candle, the next potential target lies at 4780, a major structural and resistance zone.
💎#ADA has officially broken out of its descending resistance and is now starting to retest that same line as new support a textbook shift in market structure. Further overall structure is shifted to bullish side on higher time frames as well, #ADA holds momentum within the within the Order Block + FVG zone the setup remains high probability targeting an initial upside move toward 4265, a key moderate resistance and structural level.
💎If momentum fades and a candle closes below 3247, the current bullish setup becomes invalidated. That would open the door to further downside pressure, and we’ll adapt accordingly.
That is why Paradisers, we are playing it safe right now. If you want to be consistently profitable, you need to be extremely patient and always wait only for the best, highest probability trading opportunities only on confirmations.
MyCryptoParadise
iFeel the success🌴

ADAUSDT 1,938% profits potential with 6X leverage —LONG tradeCardano is in the same situation as Dogecoin which I shared with you just minutes ago. The action is happening at bottom prices for months, at the lowest since November 2024 based on candle close. Truly, bottom prices.
When the action was happening at this same level back in late 2024, a very strong advanced developed leading to the peak in December 2024. ADAUSDT closed five consecutive weeks green. The market then turned bearish until present day; lower lows and lower highs. Bearish volume has been declining since March 2025 when it peaked. This signal supports everything related to a reversal.
The main target for me based on past history and chart structure sits around $1.19 - $1.35. Strong resistance can be found at $1 also and some minor stops before these levels.
On a bullish move, +100% would be the bare minimum and worst case scenario.
Higher targets are also possible but this is hard to visualize. Since this is a leveraged trade-setup, we are more conservative with the targets. The most important part is to secure a good entry and thus a good position. As the market starts to run, we can update our targets if necessary based on marketwide action. But we start conservative to play it safe. If we confirm that a bull run will develop, then surely we adapt to market conditions to aim higher.
Thank you for reading...
Full trade-numbers below:
____
LONG ADAUSDT
Leverage: 6X
Potential: 1938%
Allocation: 5%
Entry zone: $0.3100 - $0.3600
Targets:
1) $0.4444
2) $0.5555
3) $0.6465
4) $0.7344
5) $0.8597
6) $1.0192
7) $1.1950
8) $1.3040
9) $1.4799
Stop: Close weekly below $0.3000
____
Namaste.

ADA/USDT | going for the Buyside Liquidity (READ THE CAPTION)As you can see in the 4H chart of ADAUSDT, after hitting the IFVG, Cardano has been dropping gradually, but after hitting the Bullish OB, it has started to rise in price, currently being traded at 0.3605. I expect Cardano to go for the Buyside Liquidity above 0.3740 level.
Next targets for Cardano: 0.3635, 0.3670 and 0.3710.

#ADA/USDT Spot LONG#ADA
The price is moving within a descending channel on the hourly timeframe. It has reached the lower boundary and is heading towards a breakout, with a retest of the upper boundary expected.
The Relative Strength Index (RSI) is showing a downward trend, approaching the lower boundary, and an upward bounce is anticipated.
There is a key support zone in green at 0.3350, and the price has bounced from this level several times and is expected to bounce again.
The indicator is showing a trend towards consolidation above the 100-period moving average, which we are approaching, supporting the upward move.
Entry Price: 0.3606
Target 1: 0.3676
Target 2: 0.3765
Target 3: 0.3873
Stop Loss: Below the green support zone.
Remember this simple thing: Money management.
For any questions, please leave a comment.
Thank you.

Shib gonna shake out some folkThe liquidity needed to go up IMO is not there yet!
We need to create an value in green box before dipping out of it.
I do think we are in a deep wave 4 correction currently.
Still a risky play fo sho.
NOT FINANCIAL ADVICE

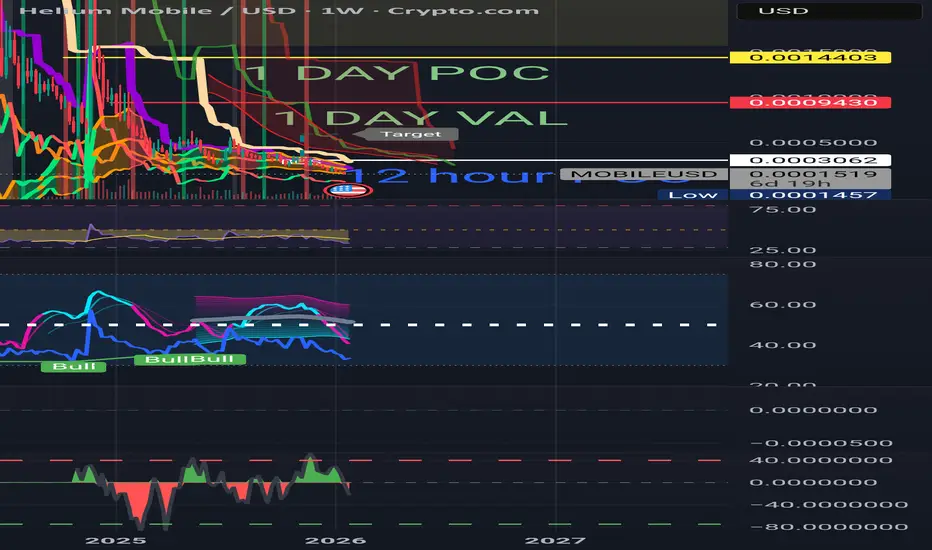
Mobile is ready againBad news & then no news for a while.....
Volume profiles on multiple time frames show some fire is coming IMO...
I lean towards the "revolution of crypto"... Look for 10 cents???
O yeah, they also did a delist and made many panic sell before & after that. Reminds me of buying a F ton of XRP below. I made money of the pump before the coinbase delisting also.
Something has me seeing massive potential beyond most our expectations or it's just another shit coin.
Good luck & REMEMBER NOTHIMGNG I SAY IS FINANCIAL ADVICE
#ADA/USD Buy Trade Scenario.Here’s an up-to-date ADA/USD Buy trade outlook (technical + fundamental) to help you assess whether positioning for a Upside makes sense right now.
Thank You......

Cardano Price Analysis: Can ADA Deliver a 2x Move From Here?* ADA is sitting right on a major support zone, and traders are starting to watch closely for any early signs that a reversal could be taking shape.
* The chart makes it clear what needs to happen before a 2x move even becomes realistic, not just hopeful.
* On-chain data and market structure aren’t fully aligned yet, which makes this a setup worth monitoring rather than chasing.
When you zoom out and look at what Cardano has been doing lately, it’s pretty clear the market isn’t panicking, even though the ADA price is still stuck inside a broader downtrend.
The ADA price didn’t slide lower in a slow and gentle way. It dropped back toward the bottom of its descending channel with speed, flushing out late longs and cooling off the optimism that had started building during earlier consolidation. That move forced a reset in expectations. But since then, the tone has started to change a bit.
Instead of continuing to sink without any pauses, ADA has begun to stabilize around the low-to-mid $0.30s. This is the first area where selling pressure has clearly slowed after that drop from the middle of the channel. The price isn’t falling apart anymore, and dips into this zone are getting absorbed faster than before.
After cutting through several support levels on the way down, this is the first place where the market looks willing to slow down instead of accelerating lower. It doesn’t mean the bottom is in, but it does indicate the market is starting to digest the move rather than reacting emotionally to it.
Market cap data backs that up. After peaking near $15.4 billion and sliding toward $13.6 billion, Cardano’s valuation has stopped dropping aggressively and has begun moving sideways. Money isn’t rushing out anymore, even if fresh inflows haven’t shown up yet.
So what comes next for Cardano?
The main challenge is still overhead resistance. The ADA price is repeatedly being held back below the level of $0.3966 on the 4-hour chart, where the 100-period SMA is placed. Each attempt at a rebound has so far not managed to get back above there.
Until ADA can break above that zone and hold it, upside moves are better seen as relief rallies, not real trend reversals. The bigger downtrend stays in control as long as price remains capped there and the descending channel keeps guiding price action.

ADA/USDT 12h🔍 Market structure
Medium-term trend: corrective / sideways after an upward impulse
Price is moving in a narrowing channel (descending wedge/triangle)
Lower highs + held support → pressure before breakout
📐 Key levels
🟢 Resistances
0.407–0.410 – local resistance + upper structure line
0.426 – very important level (previous high + price reactions)
0.451–0.452 – strong HTF resistance (if an impulse occurs)
🔴 Support
0.384–0.385 – key support (if it falls → weak)
0.371
0.352
📊 Price Action
The last upward impulse was rejected exactly at the resistance of 0.426
Currently, the price is consolidating just above 0.384
Every move lower is bought, but there is no strong volume for growth
👉 The market is in compression - the breakout is getting closer.
📉 Stochastic RSI
Oscillator close to the oversold zone
No clear bullish crossover yet
This favors a rebound, but is not a confirmation of the long
🧠 Scenarios
✅ Bullish scenario (more technically correct)
Conditions:
Defense 0.384
Breakout above 0.407–0.410 (preferably close 12h candle)
Goals:
0.426
0.451
➡️ This would be a breakout from the wedge + continuation of the impulse
❌ Bear scenario
Conditions:
Candle close below 0.384
Goals:
0.371
0.352
➡️ This means negating the structure and returning to the range

#ADA/USDT Spot LONG#ADA
The price is moving within a descending channel on the hourly timeframe. It has reached the lower boundary and is heading towards a breakout, with a retest of the upper boundary expected.
The Relative Strength Index (RSI) is showing a downward trend, approaching the lower boundary, and an upward bounce is anticipated.
There is a key support zone in green at 0.3950, and the price has bounced from this level several times. Another bounce is expected.
The RSI is showing a trend towards consolidation above the 100-period moving average, which we are approaching, supporting the upward move.
Entry Price: 0.4050
First Target: 0.4096
Second Target: 0.4194
Third Target: 0.4296
Stop Loss: Below the green support zone.
Remember this simple thing: Money management.
For any questions, please leave a comment.
Thank you.

ADA Bullish Move Incoming? (4H)Given that the ongoing correction has extended longer than expected, it appears that buyers have not yet fully entered the market. This current correction falls into the category of complex double corrections, which are often seen in mature or consolidating markets.
From a structural perspective, Cardano (ADA) seems to be forming a double correction, connected by an X-wave, linking the two corrective patterns together. The second correction, in particular, appears to take the form of a triangle, and we are currently observing Wave E of this triangle. Once Wave E completes, we can reasonably expect this double correction to conclude, setting the stage for a potential bullish move in Cardano.
For proper risk management, we have identified two entry zones, where positions should ideally be entered using a DCA (Dollar-Cost Averaging) strategy. This approach helps reduce risk and ensures better average entry prices during ongoing corrective moves.
⚠️ Trade management guidelines:
At Target 1, it is recommended to secure partial profits.
After that, move your stop loss to breakeven (entry level) to protect capital while letting the trade run.
❌ Invalidation rule:
A daily candle closing below the invalidation level will invalidate this analysis and should trigger a review of your position.
This setup is based on price structure, wave theory, and risk management principles, not speculation. Discipline, patience, and adherence to the outlined rules will be crucial for capitalizing on this potential move.
If you have a coin or altcoin you want analyzed, first hit the like button and then comment its name so I can review it for you.
This is not a trade setup, as it has no precise stop-loss, stop, or target. I do not publish my trade setups here.

#ADA/USDT Spot LONG#ADA
The price is moving within a descending channel on the hourly timeframe. It has reached the upper boundary and is heading towards breaking it. A retest of this boundary is expected.
The Relative Strength Index (RSI) is showing an upward trend, as it has approached the upper boundary. A bearish reversal is expected.
There is a key support zone in green at 0.3800. The price has bounced from this zone several times and is expected to bounce again.
A consolidation trend is observed above the 100-period moving average, which we are approaching. This trend supports a decline towards this level.
Entry Price: 0.3916
Target 1: 0.4018
Target 2: 0.4155
Target 3: 0.4296
Stop Loss: Above the green support zone.
Remember this simple thing: Money management.
For any questions, please leave a comment.
Thank you.

ADA - Liquidity sweep first, then straight to the basement?ADA – Liquidity sweep first, then straight to the basement?
Alright, déjà vu alert 🚨
This setup is giving strong WIF flashbacks.
Same movie, different actor:
• We’ve got liquidity sitting above price, just begging to be tapped
• Market loves doing one last “hope pump”
• And then… surprise, ADA remembers gravity exists
So yeah, the idea is simple:
👉 Quick move up to grab liquidity
👉 Immediate mood swing
👉 Downside continuation
Could this be a clean, fast trade?
Absolutely.
Could it also turn into a speedrun to your stop loss?
Also absolutely 😅
That’s why this one comes with a mandatory disclaimer:
⚠️ Risk Management Is Not Optional Here
• This can be fast money
• Or fast loss
• There is no emotional middle ground
Keep position size small, stops tight, and ego even tighter.
If liquidity gets swept and price rejects → beautiful.
If ADA decides to cosplay as a “long-term investment” → we step aside and live to trade another day.
Trade the plan, not the hope.
And remember: Cardano loves to give just enough confidence before doing the opposite. 😌📉

ADA – BTC-Driven Upside ScenarioContext:
ADA remains largely beta to BTC. Any impulsive move toward BTC 100k—especially on favorable macro—creates a window for sympathetic upside on ADA. This is a conditional trade, fully dependent on BTC follow-through.
⸻
Macro Backdrop
• Current macros look constructive, but not confirmed yet
• NFP (Friday) is the key volatility catalyst
• Outcome-dependent scenario:
• Better-than-expected NFP: Risk-on spike → BTC momentum continuation
• Hot / disappointing NFP: Risk-off → BTC upside invalidated quickly
➡️ This is a “wait-for-confirmation” macro environment, not front-run blindly.
⸻
BTC → ADA Transmission
• BTC pushing 100k = headline momentum + liquidity expansion
• ADA historically reacts with:
• Delayed impulse
• Higher % move than BTC once triggered
• No independent ADA catalyst → pure correlation trade
➡️ BTC moves first, ADA follows if liquidity spills.
⸻
ADA Price Action Thesis
• ADA currently in compression / reactive mode
• No breakout yet → setup, not signal
• Trigger conditions:
• BTC acceptance above local highs
• Volume expansion on BTC spot
Without BTC confirmation → no trade
⸻
Execution Framework
• 🟡 Pre-NFP: Observe only, no size
• 🟢 Post-NFP (Bullish):
• BTC impulsive move → look for ADA momentum entry
• Target = relative expansion vs BTC (beta play)
• 🔴 Post-NFP (Bearish / Mixed):
• Thesis cancelled
• Stand down, reassess next week
⸻
Risk Notes
• This is event-driven, not technical-only
• ADA underperforms if:
• BTC spikes and instantly fades
• Macro creates volatility without direction
• Avoid leverage before NFP
⸻
Verdict
ADA upside is real—but conditional.
If NFP supports risk-on and BTC accelerates toward 100k, ADA likely follows with a lagged expansion move.
Until then: patience > prediction.

ADA/USDT | Going higher? (READ THE CAPTION)As you can see in the 4h chart of #ADAUSDT, we can see that after Cardano hit the IFVG High, it dropped in price all the way from 0.4374 to 0.4211, just above the FVG high. Currently ADA is being traded at 0.4160.
The targets are: 0.4180, 0.4193, 0.4205 and 0.4218.

ADA's SituationWe can be hopeful that after breaking out of the wedge, we will see significant price growth.AB=CD
Best regards CobraVanguard.💚
Give me some energy !!
✨We spend hours finding potential opportunities and writing useful ideas, we would be happy if you support us.
Best regards CobraVanguard.💚

ADAUSDT | Higher targets ahead! (READ THE CAPTION)As you can clearly see, Cardano has been on bullish run for the past couple of days. After an initial reaction to the bearish breaker, it went up and reached 0.3992, just a bit short of the high of FVG at 0.4004. After reached the FVG, Cardano faced a little bit of correction, and is now being traded at 0.3865. I expect another try at the FVG.
Bullish Targets: 0.3900, 0.3950, 0.4000 and 0.4050.

#ADA//USDT Spot LONG #ADA
The price is moving in a descending channel on the 1-hour timeframe. It has reached the lower boundary and is heading towards breaking above it, with a retest of the upper boundary expected.
We have a downtrend on the RSI indicator, which has reached near the lower boundary, and an upward rebound is expected.
There is a key support zone in green at 0.3558. The price has bounced from this zone multiple times and is expected to bounce again.
We have a trend towards stability above the 100-period moving average, as we are moving close to it, which supports the upward movement.
Entry price: 0.3690
First target: 0.3741
Second target: 0.3842
Third target: 0.3976
Don't forget a simple principle: money management.
Place your stop-loss order below the green support zone.
For any questions, please leave a comment.
Thank you.

ADAUSDT Near Major Breakout Level — Trend Reversal or Bull Trap?On the 12-hour timeframe, ADAUSDT remains within a clear medium-term downtrend structure. Over the past few months, price has consistently formed lower highs and lower lows, capped by a dominant descending trendline.
However, recent price action shows an early bullish reaction from the lower support area, suggesting a potential transition phase or a short-term relief rally.
---
Pattern & Technical Structure
Primary Pattern:
Descending Trendline / Bearish Channel Breakdown Test
Price has been trading below the descending trendline (dynamic resistance) for an extended period.
The latest candles indicate a retest of the trendline, which now acts as a critical decision zone.
The marked horizontal levels (yellow dashed lines) represent key historical support and resistance zones.
Pattern Summary:
As long as price remains below the trendline, the broader structure stays bearish. A valid break and close above the trendline would be the first signal of a potential trend reversal or short-term bullish continuation.
---
Key Levels
Major Resistance:
0.413
0.468
0.520
High Resistance / Reversal Zone:
0.616 – 0.682
Key Support:
0.370
0.345
0.321 (structural low)
---
Bullish Scenario
Price successfully breaks and closes above the descending trendline (12H close).
Trendline flips into support after a successful retest.
Upside targets:
TP1: 0.413
TP2: 0.468
TP3: 0.520
If bullish momentum and volume expand, further upside toward 0.616 – 0.682 becomes possible.
Bullish Confirmation:
Higher low formation
Minor market structure shift
Strong candle close, not just a wick
---
Bearish Scenario
Price fails to break the trendline and forms a clear rejection (long upper wick / bearish engulfing).
Price revisits lower support zones:
First support: 0.370
Next support: 0.345
Worst-case scenario: 0.321 (new lower low)
A breakdown below 0.321 would confirm continuation of the major downtrend.
Bearish Confirmation:
Clear rejection at the trendline
Lower high formation
Increasing selling volume
---
Conclusion
ADAUSDT is currently at a critical decision zone.
The macro trend remains bearish, but the recent bullish reaction from lower support opens room for a short-term reversal or relief rally.
Traders are advised to wait for confirmation — either a breakout or rejection — at the trendline, as this area will define the next major move.
---
#ADA #ADAUSDT #Cardano #CryptoAnalysis #TechnicalAnalysis #Downtrend #Trendline #SupportResistance #Altcoins

ADAUSDT – Daily Chart. ADAUSDT – Daily Chart.
Macro downtrend intact (descending channel)
The price is sitting at a major HTF demand level after a prolonged sell-off.
Selling momentum is exhausting near channel support
Price is compressing → base formation possible
This zone often leads to sideways accumulation before expansion
Support: 0.35 – 0.32 (critical demand zone)
Invalidation: Below 0.30
First Resistance: 0.48 – 0.52
Major Supply: 0.70 – 0.82 (previous value area)
In Extreme Fear, strong coins usually move sideways at support to absorb sell pressure before trend reversal.
No blind longs. Wait for structure shift + volume confirmation.
DYOR | NFA

ADA/USDT | Is Cardano dead? (READ THE CAPTION)As you can see in the 4h chart of ADAUSDT, it has been consolidating in a zone between the Bearish Breaker and the Buliish Rejection Block and it is now being traded at 0.3510.
Currently, there's no clear indication as to where it is headed.
Next targets for ADA: 0.3620, 0.3730 and 0.3850.

adausdt Bullishin case of breaking light blue box it can move up . it all depends on market moving . but it can give you good profit in bull market . even more than other assets
