Cardano Finds Opportunity Zone—Buyers Step InCardano’s price stands at $0.641 at the time of writing, holding above the $0.623 support. The altcoin remains under the $0.661 resistance, where repeated rejections have hindered its upward progress over the past week.
If current conditions persist, ADA could breach $0.661 and aim for $0.696. However, for Cardano to mark a true recovery, it must reach and sustain levels above $0.754. Such a move would confirm renewed market strength and investor optimism.
Conversely, if ADA faces renewed selling, the price could drop below $0.623 and test $0.608. A failure to hold these supports would invalidate the bullish outlook and potentially trigger further downside pressure.
ADAUSDT

ADA/USDT — at a Make-or-Break Zone: Will Bulls Defend?Cardano (ADA) is now sitting at a critical decision point, testing the major demand zone between 0.55–0.625 USDT — a key level that has acted as the foundation for multiple rallies since early 2024. This zone represents the battlefield between long-term buyers and sellers, where price reactions have historically triggered large directional moves.
Recently, ADA experienced a deep liquidity sweep, leaving a long wick below the zone — a common sign of stop-loss hunting or institutional accumulation. Such moves often occur before a trend reversal, making this area one of the most strategic zones to watch in the coming weeks.
---
Pattern and Market Structure Analysis
The yellow block (0.55–0.625) is a macro demand/support zone, repeatedly tested and defended by buyers.
Main resistances are located at 0.9239, 1.2075, and 1.3264, forming the upper bounds of ADA’s broader trading range.
The overall structure shows a wide consolidation phase, potentially signaling re-accumulation if the current zone holds.
The long wick beneath support reflects a liquidity grab, often used by smart money to fill large buy orders before an upward move.
---
Bullish Scenario — Potential Start of a Major Rebound
1. Price holds and rebounds from 0.55–0.625 with a strong bullish reversal candle (bullish engulfing, hammer, or pin bar).
2. Increasing buying volume confirms accumulation interest at this level.
3. A clean breakout and daily close above 0.9239 would confirm bullish continuation toward 1.20 and 1.32.
4. Formation of a higher low above 0.625 will further validate a new uptrend structure.
🎯 Bullish Targets:
TP1: 0.92
TP2: 1.20
TP3: 1.32
📉 Suggested Stop Loss: Below 0.53 (outside the demand zone).
Narrative:
If this pattern confirms, ADA could begin a new major recovery wave, potentially marking the start of a strong uptrend cycle heading into 2026.
---
Bearish Scenario — Breakdown and Failed Retest
1. Price fails to hold above 0.55 and closes decisively below the yellow zone.
2. High selling volume confirms continuation pressure.
3. A failed retest of 0.55–0.625 as new resistance strengthens bearish momentum.
4. The next key downside targets are 0.40 and 0.27, both major liquidity levels.
🎯 Bearish Targets:
TP1: 0.40
TP2: 0.27
📈 Confirmation: Daily candle close below 0.55 with strong volume.
Narrative:
If this support collapses, ADA could enter a mid-term redistribution phase, potentially setting a new bottom before the next macro bull run.
---
Conclusion and Strategic Outlook
The 0.55–0.625 zone is ADA’s make-or-break region — a critical level that will likely define its direction for the months ahead.
Holding the zone could trigger a strong reversal rally toward 0.92–1.32.
Losing it would confirm a bearish continuation toward 0.27.
Traders should wait for confirmation through daily candle closes and volume surges before committing to major positions.
This zone offers both a high-risk accumulation opportunity for patient investors and a decisive pivot area for short-term traders.
---
#ADA #Cardano #ADAUSDT #CryptoAnalysis #TechnicalAnalysis #PriceAction #SupportZone #ReversalZone #Altcoin #CryptoMarket #DemandZone


#ADAUSDT: Is the crypto hype finally over? ADAUSDT is likely to drop first then it can reverse and continue the bullish move upwards of previous all time high. Before we can confirm any entry on this pair we need strong confirmation which will allow us to predict a correct and accurate swing move.
If you like the work then do consider liking and commenting on the idea.
Team Setupsfx_❤️

Cardano Inflows Jump To 3-Month High As Holders Rescue ADA PriceCardano’s price currently hovers above the $0.66 support level but risks slipping below it if bearish momentum continues. A drop under this line could push ADA down to $0.60 in the coming days.
Continued whale selling could exacerbate downward pressure even if inflows remain strong. Persistent profit-taking from large holders would make sustained recovery more difficult.
However, if ADA manages to hold $0.66 and attract renewed buying interest, the altcoin could rise above $0.69 and potentially reach $0.75. Such a move would invalidate the bearish outlook and mark the start of a short-term rebound.

Last Stand for CARDANOADA’s fate hinges on this PRZ.
If the price holds, we could see a breakout above $0.80.
But if this level fails… well, you already know the kind of drop that could follow.

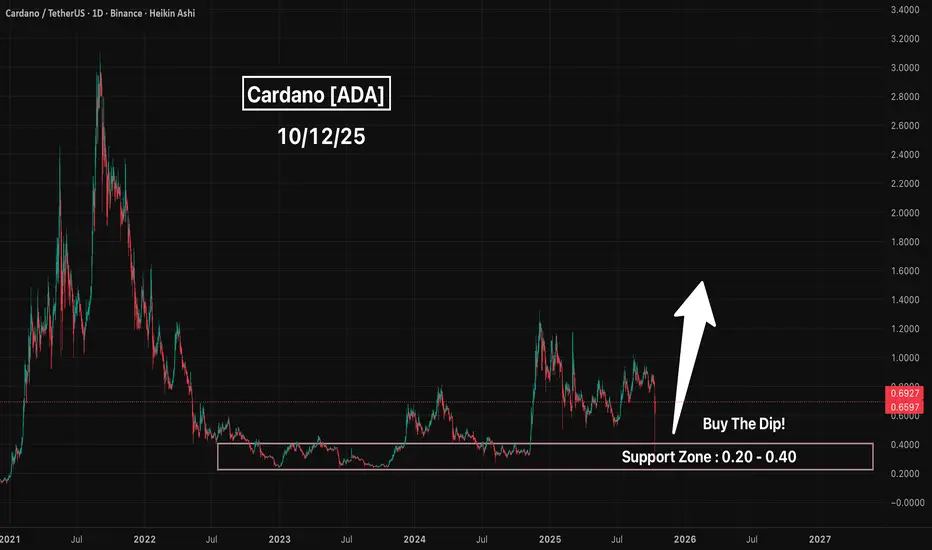
Cardano (ADA) - Price Action Looking Strong Bullish! Cardano (ADA) — Price Action Looking Strong 👀
Cardano just had a huge dip into the support zone. That’s exactly what you want to see from a healthy market setup.
This move likely cleared out weak hands and filled some serious buy orders in that $0.34–$0.36 range. The bounce that followed shows there’s still strong demand sitting underneath.
If ADA can hold above this zone, I wouldn’t be surprised to see it build momentum in the coming weeks as Bitcoin continues to push higher. Historically, ADA tends to lag a bit, but once it catches fire, it runs fast.
This might honestly be one of the last chances to grab ADA cheap before a bigger breakout move.
Key areas I’m watching:
🔹 Support: $0.20–$0.40 (liquidity sweep zone)
🔹 Next resistance: $1.33+ (psychological and structural breakout zone)
🔹 Bigger breakout target: $3.00-$5.00+ (breaking previous ATH if BTC keeps leading)
Not financial advice, but the setup looks clean. Structure’s shifting, liquidity’s cleared, and sentiment’s turning — this is where smart money usually starts paying attention.
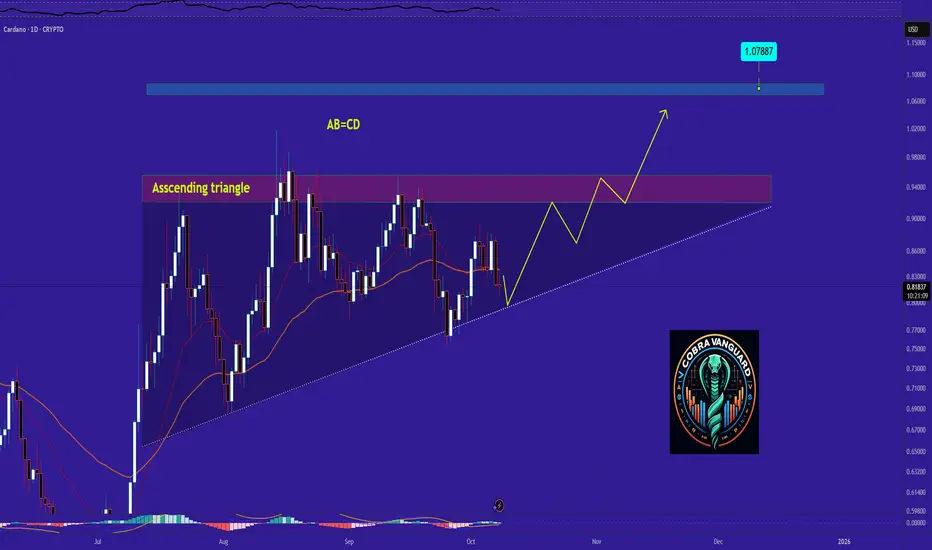
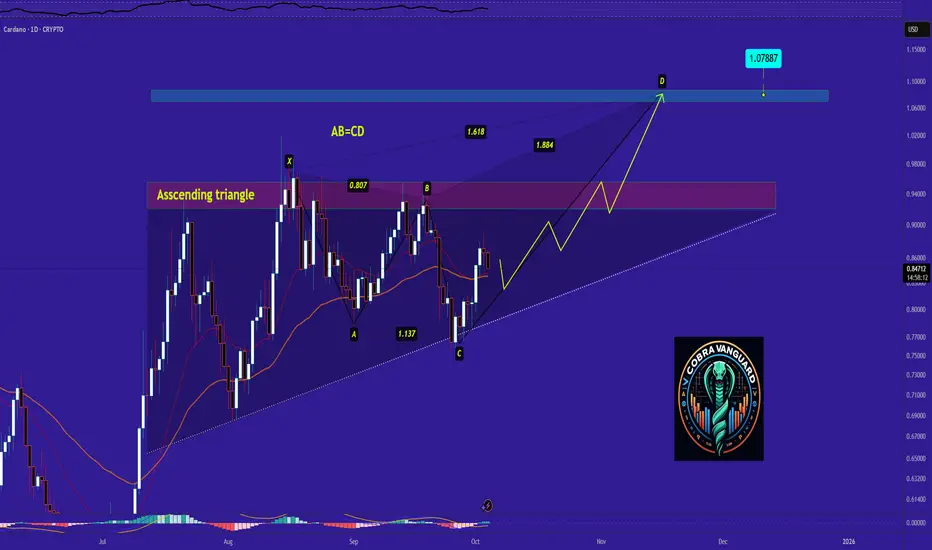
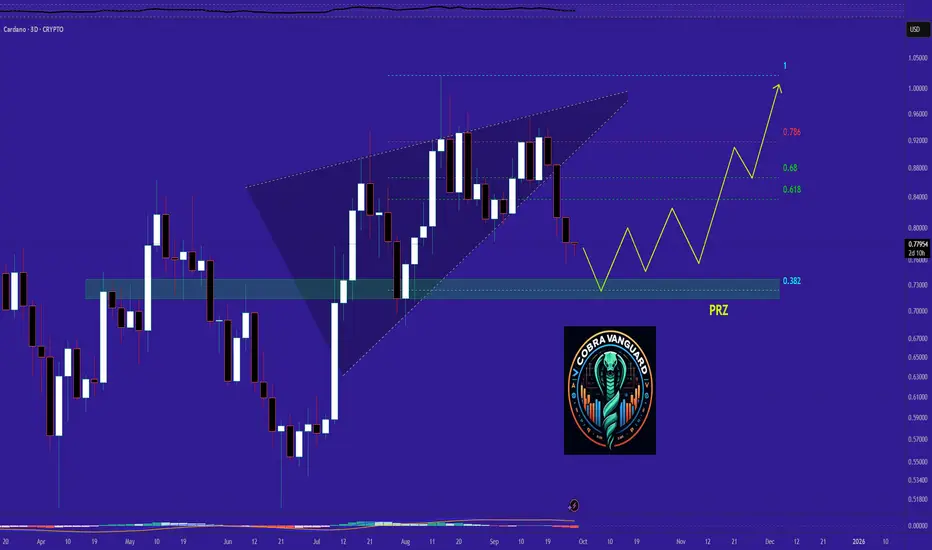
Cardano's situation+ Target PredictionCurrently, ADA is forming an ascending triangle, indicating a potential price increase. It is anticipated that the price could rise, aligning with the projected price movement (AB=CD).
However, it is crucial to wait for the triangle to break before taking any action.
Best regards CobraVanguard.💚
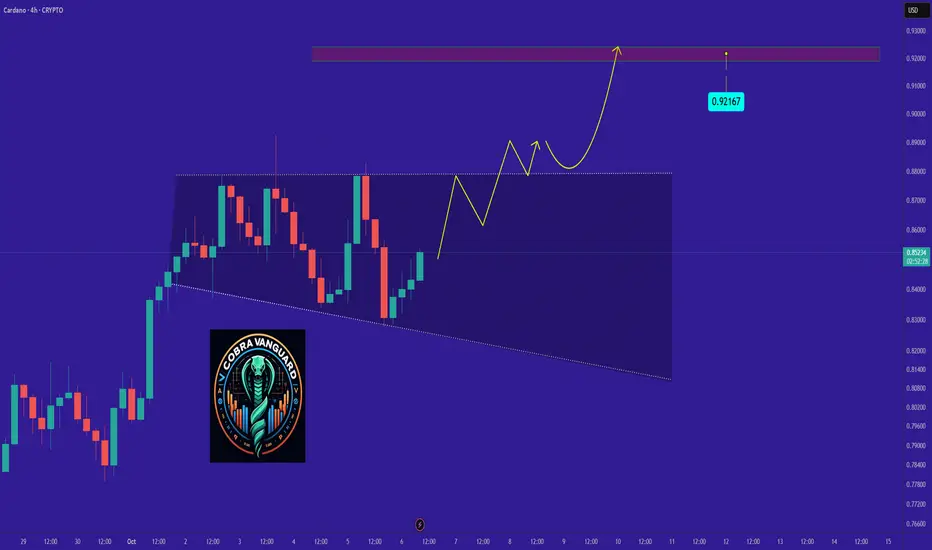
Cardano Price Gains Capped by Long-Term Holder PressureCardano’s price currently trades at $0.87, hovering just below its immediate resistance of $0.88. The token remains approximately 14% away from the psychologically important $1.00 level, a threshold that could reignite market enthusiasm if successfully breached.
Given the mixed outlook from investors and technical indicators, ADA is likely to continue its sideways movement. The cryptocurrency may remain rangebound between $0.83 and $0.88 until decisive buying volume emerges.
However, if long-term holders pause their selling and market sentiment improves, ADA could break past the $0.88 barrier and rise toward $0.93. Such a move would restore bullish confidence and potentially pave the way for a broader recovery phase in the weeks ahead

ADA Multi-Year Downtrend Nearing EndCardano CRYPTOCAP:ADA is forming higher lows and looks ready for a big breakout once it moves above the red resistance line. Price is currently in the accumulation zone, which means smart money might be loading up here.
Plan:
Buy Zone: Between 0.75 and 0.88
Stop Loss: Below 0.66 (if it drops there, the setup fails)
Targets:
TP1: 1.09
TP2: 1.35
TP3: 1.70
TP4: 2.18
TP5: 3.10
Strategy:
Start with a small position here. Add more only after a confirmed breakout above 0.90.
Once the first target hits, book some profits and move your stop loss to entry.
Note:
This is a long-term setup, could take several months to play out. Always do your own research (DYOR).

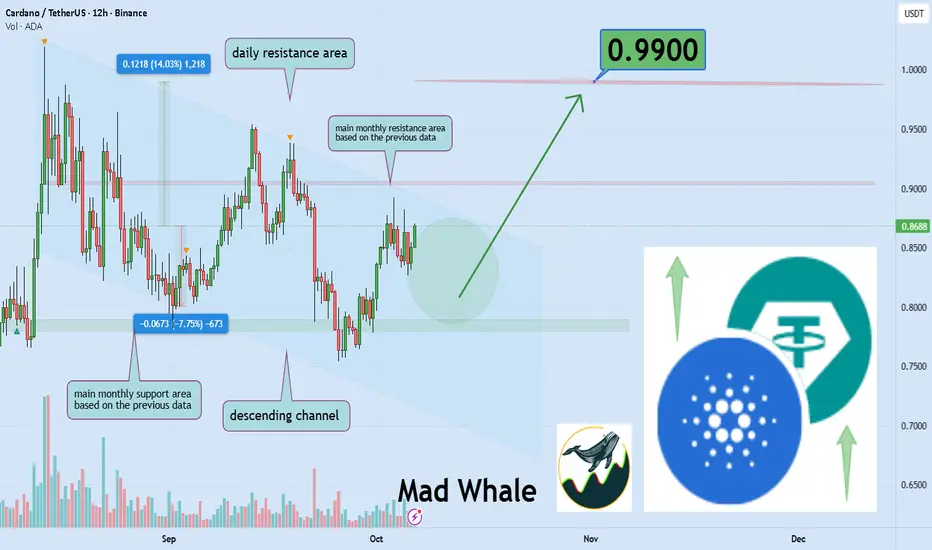
Cardano close to Critical Resistance, Targeting 14% Move to $099Hello✌️
Let’s analyze Cardano’s price action both technically and fundamentally 📈.
🔍Fundamental analysis:
Cardano (ADA) is moving forward with major upgrades focused on speed and scalability. If completed smoothly, it could strengthen ADA’s network use and ecosystem growth. 🔗
📊Technical analysis:
BINANCE:ADAUSDT is testing the top of its descending channel and a strong monthly resistance; a clean breakout could drive a 14% rally toward $0.99. 📈🔗
📈Using My Analysis to Open Your Position:
You can use my fundamental and technical insights along with the chart. The red and green arrows on the left help you set entry, take-profit, and stop-loss levels, serving as clear signals for your trades.⚡️ Also, please review the TradingView disclaimer carefully.🛡
✨We put love into every post!
Your support inspires us 💛 Drop a comment we’d love to hear from you! Thanks, Mad Whale
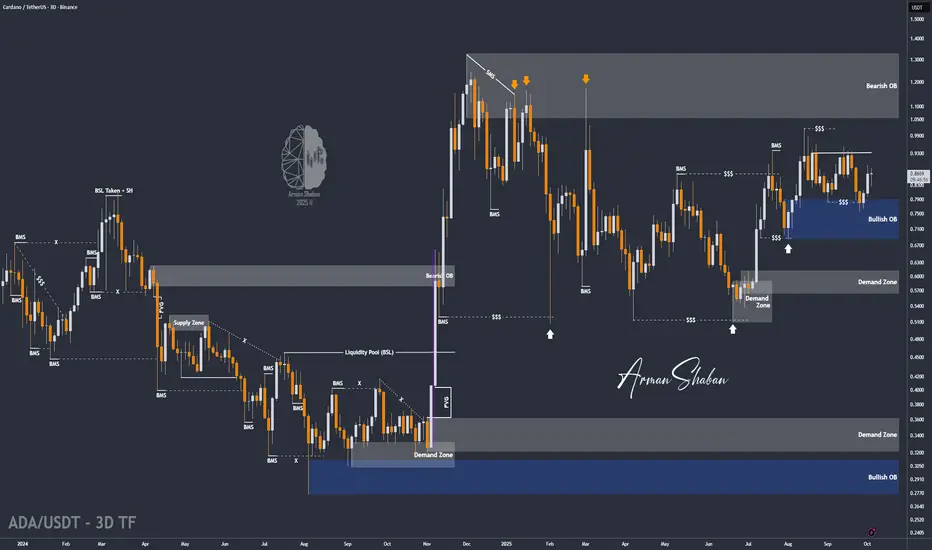
ADA/USDT | ADA Keeps Rising – Ready for the $1 Breakout?By analyzing the Cardano (ADA) chart on the 3-day timeframe, we can see that the price has continued its strong upward move as expected and is now trading around $0.87, just a step away from hitting the next target at $0.95.
The momentum remains strong, and I expect to see even more bullish movement soon.
Short-term upside targets are $1.00, $1.05, $1.17, and $1.33.
Please support me with your likes and comments to motivate me to share more analysis with you and share your opinion about the possible trend of this chart with me !
Best Regards , Arman Shaban
Why ADA Remains Bullish and Its Next Potential Move !The ETH will increase 3 CENTS and reach to the top of the wedge .
We can be hopeful that after breaking out of the wedge, we will see significant price growth.
Best regards CobraVanguard.💚
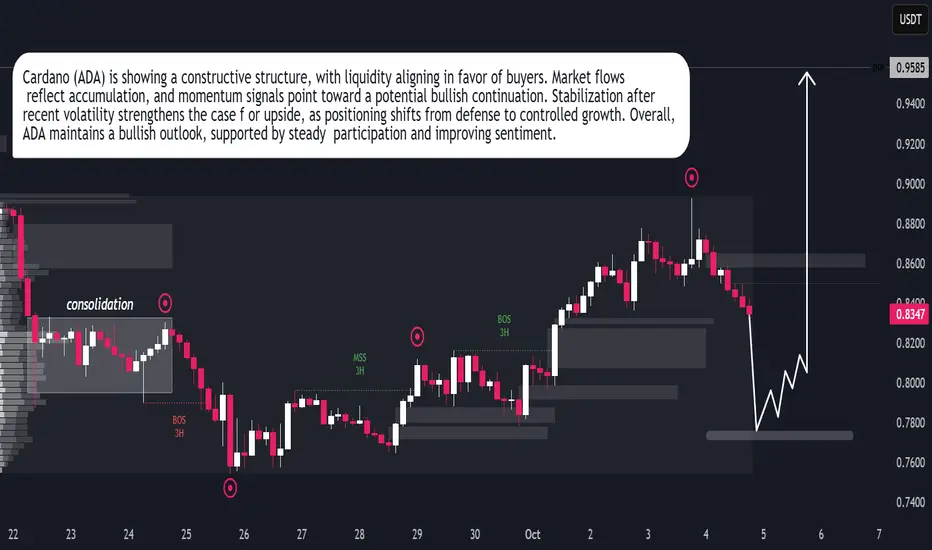
Cardano (ADA) Ready for Bullish ExpansionCardano (ADA) Ready for Bullish Expansion
Cardano (ADA) is building strength as market conditions favor accumulation over distribution. Liquidity behavior shows steady inflows, suggesting participants are positioning for upward continuation. The recent stability reflects confidence, with sentiment gradually tilting toward growth. Momentum indicators align with this view, reinforcing the prospect of a bullish expansion phase. ADA’s structure signals resilience, and the market tone supports the case for sustained upside in the near term.
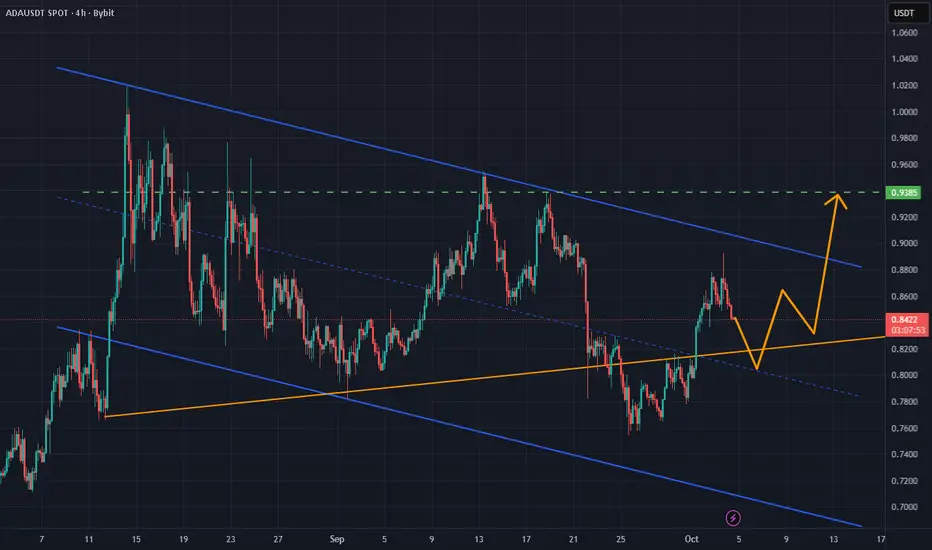
ADA/USDT: Holding Trendline Support with Breakout Setup FormingADA/USDT is holding above the 0.8135 upward trendline following a pullback from resistance, signaling early signs of stabilization. The current structure shows lower highs capped by a red descending trendline, while projection points suggest a potential breakout toward the 0.9385 level.
As long as the 0.8135 support remains intact, the bullish outlook stays in play, favoring continuation toward 0.9385, with momentum building for a possible challenge of the 1.0212 resistance zone. Buyers appear to be gradually regaining control.
Cardano's situation+ Target PredictionCurrently, ADA is forming an ascending triangle, indicating a potential price increase. It is anticipated that the price could rise, aligning with the projected price movement (AB=CD).
However, it is crucial to wait for the triangle to break before taking any action.
Best regards CobraVanguard.💚
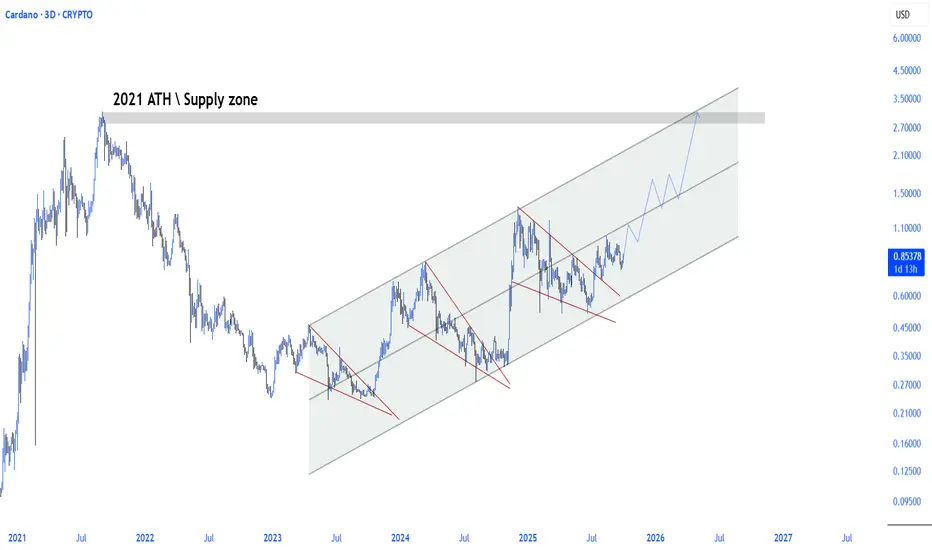
Cardano \ $ADA
Cardano touched the upper band of the rising channel following the breakout of the descending triangle within the rising channel.
After the breakout of the current descending triangle and the subsequent retest process, Cardano continues its upward trend, targeting the upper band of the rising channel.
This target also corresponds to the all-time high (ATH) level in 2021.
Cardano: Still Boring or Finally Ready to Move?🧐🔁 Cardano: Still Boring or Finally Ready to Move? 🚦📈
Welcome to the Altcoin Series, kicking off this weekend with none other than Cardano (ADA).
Later on I will explain why i will be 'Divorcing Alts' and just trade them, but that time will be at the cycle end, not now.
It’s Saturday, July 12th — a classic retail weekend after a solid macro pump. Salaries are hitting accounts, the charts are alive again, and it's time to look at structure over sentiment.
🔍 A Personal Note on ADA
I was fortunate to exit near the top during the Cardano Summit in Athens (2021) — not just due to chart structure, but after meeting with developers and understanding how deeply Haskell shapes this ecosystem. And what a challenge that seemed!
Haskell, while academically impressive, has proven difficult to scale, and in practice, it's slowed down development. Expectations were sky-high, but reality hit hard. And let’s be honest — Cardano has been boring for years.
But that boredom may be hiding something...
I’ve still been 'going Long' under key levels, because when you zoom out — Cardano is still U.S.-centric , regulation-aware, and deeply rooted . In a time when the U.S. might look to lead crypto adoption, especially with figures like Trump signaling support , Cardano could become part of that narrative.
⚙️ Technical Setup
The recent pump from Nov–Dec 2024 was rejected right at $1.193 — our second test of that critical resistance. But now, we’re staring down a potential third test, with Test #3 marked on the chart near $1.15, and this time, the context is shifting.
✅ TOTAL3 structure is bullish
✅ Retail energy is back
✅ Altcoin momentum is quietly building
🔑 Key Levels
Support Zone:
🟢 $0.70–$0.71 — the current base to hold
Target Zones:
🔹 $1.15–$1.19 — Third test of resistance
🔹 $1.47
🔹 $1.89
🔹 $3.02
🔹 Top Extension Target: $3.65
A break above that descending level could turn this "boring" coin into one of the cleanest long continuation setups of the cycle.
📌 We trade technicals, not hope:
✅ Buy over support
✅ Exit under resistance
✅ Control risk, always
So… will Cardano keep boring us? Or is it finally time for a show?
One Love,
The FXPROFESSOR 💙

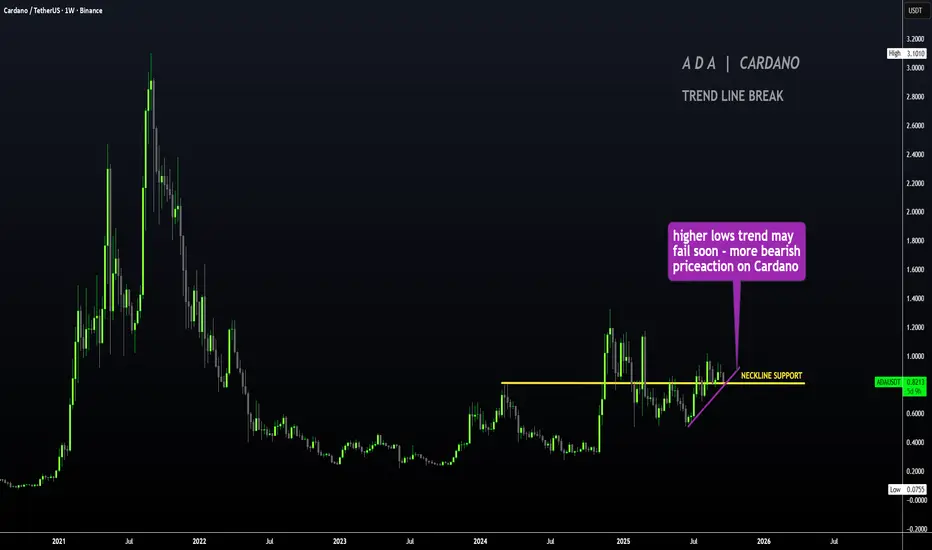
ADA - Failure to LAUNCH, BEARISH Short TermHello Traders
Cardano / ADAUSDT is not looking good for the short term after the higher lows trendline has been broken (trendline analysis / support analysis).
The 4h shows a bearish drop with a nasty red candle:
Also, if we consider a technical indicator - the moving averages - the price has fallen far under the 200d MA, for the first time in months. This is not a good sign, unless we can recover towards the upside within a week and stay right under it like a few days ago:
If there is no return to the upside, a coupe of bounce zones we can watch in the near to longer term include :
👋 Thanks for your support
BYBIT:ADAUSDT

ADA's Situation, A Comprehensive Analysis !!!The price has broken the descending wedge and could now drop to 0.70. It seems the PRZ (Potential Reversal Zone) is a stable range for Bitcoin.
#ADAUSDT (4H Chart)#ADAUSDT
(4H Chart)
🔹️ Cardano Short-Term Analysis 🔹️
🟡 The current price is holding above the yellow support box, and from this area, we expect growth.
🔴 Target is the red box in the 0.88 – 0.90 USD range.
🟢 After touching the red box, a correction toward the green box is expected.
🔰 The green box is the best support for Cardano and a strong level for spot buying.
🚀 After touching the green box, the final target for Cardano will be a new high around 4 USD.
📌 Summary: Bullish Scenario ✅
Move towards the red box, correction to the green box, and then a rally toward a new all-time high.
🆔 @Rasoolahmadi

BUY AND HOLDHello friends
You see that after the good rise we had, the price is correcting, which is a natural thing and there is no need to worry, and in these corrections, you can buy in steps with capital and risk management and move with it to the specified goals.
Note that the holding period is at least 3 months, so be patient and observe capital management.
*Trade safely with us*
