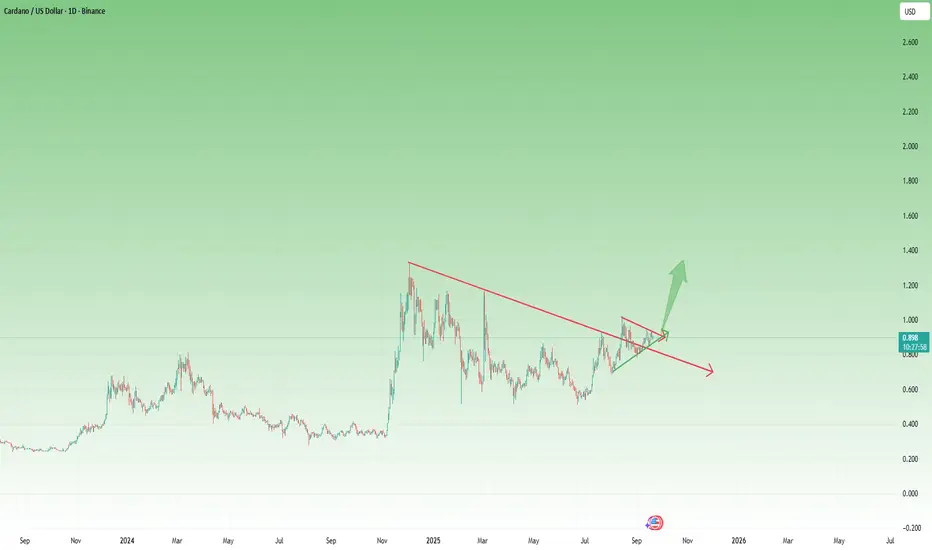
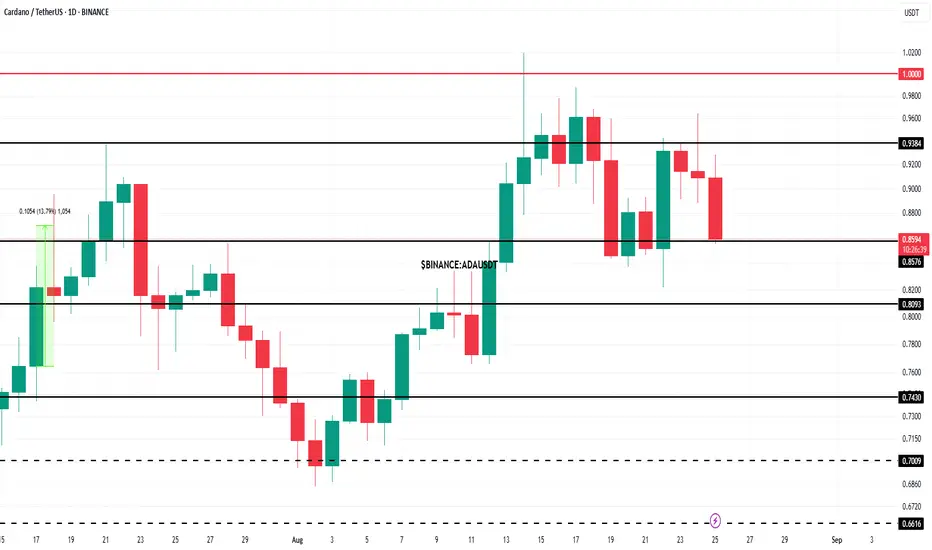
ADAUSD – Symmetrical Triangle Points to Upside BreakoutAs highlighted in my previous ADA analysis, I’ve maintained a bullish bias, recommending buys below 0.80 USD. Since then, price has indeed revisited the 0.80 support zone and rebounded strongly.
More importantly, since mid-August, ADA has been consolidating within a symmetrical triangle. Technically, this is a continuation pattern, and given that the broader trend from 0.50 (mid-June) has been constructive to the upside, probabilities favor an eventual bullish breakout.
Key Levels & Plan:
✅ Bullish bias remains intact above 0.80 USD
⚡ Breakout confirmation above 0.95 USD (recent resistance)
🎯 Upside target: 1.30 USD – a reasonable and achievable objective if momentum extends
Conclusion: Until proven otherwise, ADA’s structure suggests an upside continuation once resistance gives way. A breakout above 0.95 would serve as the clear green light for further gains. 🚀
ADAUSDT
Hidden Altcoin Opportunities Every Trader Should Notice TodayDo you know some altcoins are offering golden opportunities right now?
The market is full of sudden moves that only sharp eyes can catch.
In this analysis, you will learn how to discover and use these opportunities.
Hello✌️
Spend 2 minutes ⏰ reading this educational material.
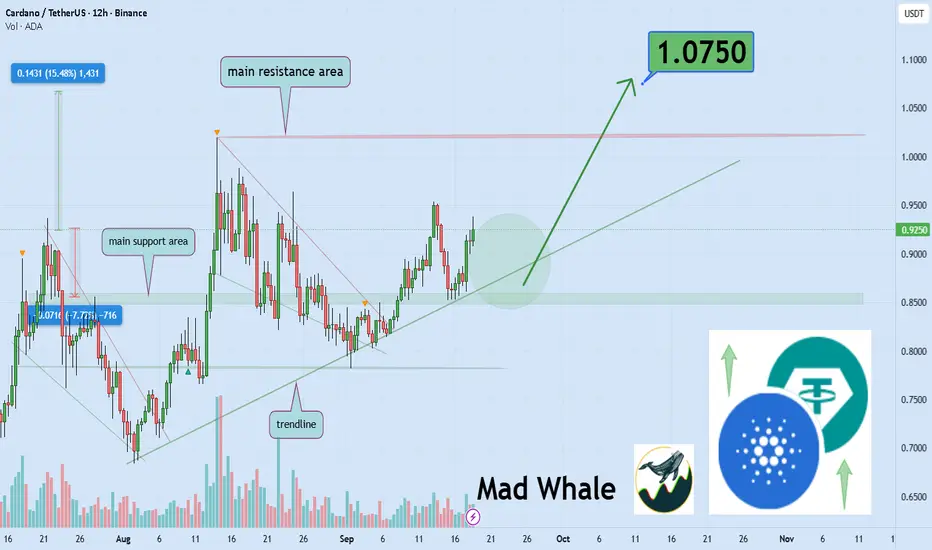
🎯 Analytical Insight on Cardano:
ADA is holding near a strong trendline and daily support, signaling a potential 15% upside toward 1.075. 🔥
Now , let's dive into the educational section,
💹 Recent Altcoin Trends
The altcoin market is experiencing significant volatility.
Some altcoins show sudden movements with low trading volume.
Professional traders spot opportunities within these moves.
Several altcoins remain largely unnoticed by the general market.
Analyzing trends helps you anticipate the next directional move.
Short-term fluctuations often accompany larger market moves.
Understanding these trends increases your chances of successful entry.
Small movements can provide clues to bigger opportunities ahead.
🧠 Market Psychology and Trader Behavior
The market is influenced by fear and greed among traders.
Smaller altcoins often react strongly to market emotions.
Understanding collective behavior helps you make rational decisions.
Successful traders wait for clear signals and reliable indicators.
Identifying the right timing for entry is possible with market psychology.
Careful observation allows you to avoid impulsive reactions.
🔍 Hidden Opportunities
Some altcoins are still under the radar.
Analyzing trading volume and trends reveals these opportunities.
Short-term trends can indicate potential major moves.
Combining data analysis with market observation is key to spotting these opportunities.
Quick yet logical decision-making increases profitability.
Tools and indicators provide clarity for entries and exits.
Spotting opportunities before others gives a significant competitive advantage.
Focusing on lesser-known altcoins multiplies your chance of success.
📊 TradingView Tools and Indicators
RSI
Shows overbought or oversold conditions, helping to predict short-term moves.
MACD
Indicates trend changes and bullish or bearish crossovers for entry and exit points.
Volume Profile
Identifies key support and resistance levels based on trading volume.
Moving Averages
Highlights long-term and short-term trends, clarifying market direction.
Combination
Using multiple tools together reduces errors and increases analysis accuracy.
Practical Use
By checking several indicators at once, you can identify low-risk entry points.
📝 Summary
The altcoin market is full of opportunities.
By analyzing trends, market psychology, and indicators, make smarter decisions.
Focus and proper use of tools are the keys to success.
🌟 Three Essential Recommendations for Traders
Focus on lesser-known opportunities
Instead of following the market hype, focus on overlooked altcoins.
Combine psychology and indicators
Always strengthen your decisions with both collective behavior analysis and technical tools.
Manage greed and emotions
Base your entries and exits on data, and don’t let emotions or greed dictate your decisions.
✨ Need a little love!
We pour love into every post your support keeps us inspired! 💛 Don’t be shy, we’d love to hear from you on comments. Big thanks, Mad Whale 🐋
📜Please make sure to do your own research before investing, and review the disclaimer provided at the end of each post.
ADA/USDT: Consolidation Above Support Signals Bullish ContinuatiADA/USDT is currently consolidating above the 0.85 support zone after rebounding from the upward trendline, indicating a potential continuation of the uptrend. The recent breakout from a descending triangle pattern points to a shift in momentum, with higher lows supporting the bullish structure.
If the price continues to hold above 0.85, the next upside targets lie near 0.965, followed by resistance at 1.05. As long as the support base remains intact, buyers retain control, and momentum favors further gains.

ADA/USDT: Bullish Rise to 0.96?BINANCE:ADAUSDT is gearing up for a bullish move on the 4-hour chart , with an entry zone between 0.87-0.85 near a key support and trendline.
The target at 0.96 aligns with the next resistance, signaling strong upside potential. Set a stop loss on a close below 0.8450 to manage risk effectively.
🌟Entry is suitable even right now with proper risk management.
📝 Trade Plan:
✅ Entry Zone: 0.85 – 0.87 (support + trendline area)
❌ Stop Loss: Daily close below 0.8450 to manage risk
🎯 Target: 0.96 (next resistance)
Ready for this lift-off? Drop your take below! 👇

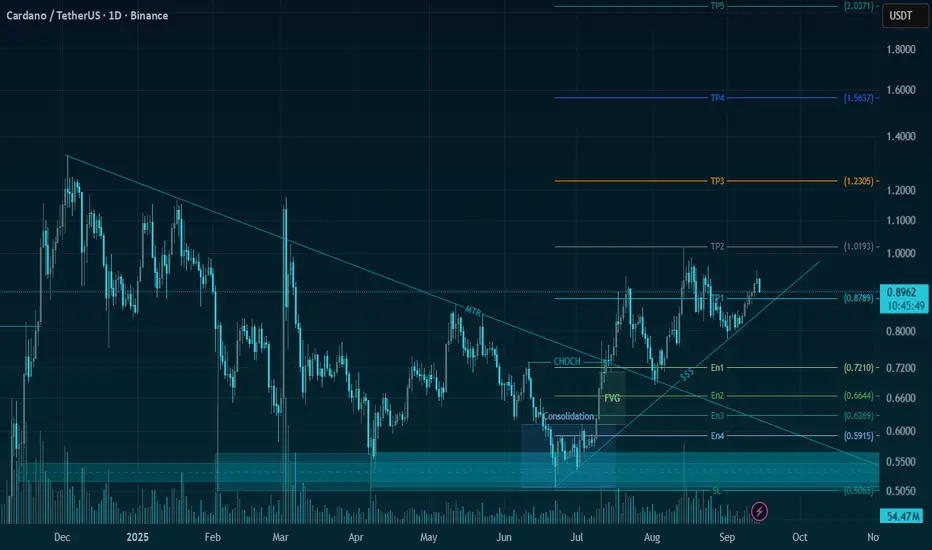
ADA/USDT | Low-Risk Swing Setup with 215%+ Upside Potential🚀 Trade Setup Details:
🕯 #ADA/USDT 🔼 Buy | Long 🔼
⌛️ TimeFrame: 1D
--------------------
🛡 Risk Management (Example):
🛡 Based on $10,000 Balance
🛡 Loss-Limit: 1% (Conservative)
🛡 The Signal Margin: $463.61
--------------------
☄️ En1: 0.721 (Amount: $46.36)
☄️ En2: 0.6644 (Amount: $162.26)
☄️ En3: 0.6269 (Amount: $208.62)
☄️ En4: 0.5915 (Amount: $46.36)
--------------------
☄️ If All Entries Are Activated, Then:
☄️ Average.En: 0.6458 ($463.61)
--------------------
☑️ TP1: 0.8789 (+36.09%) (RR:1.67)
☑️ TP2: 1.0193 (+57.84%) (RR:2.68)
☑️ TP3: 1.2306 (+90.55%) (RR:4.2)
☑️ TP4: 1.5637 (+142.13%) (RR:6.59)
☑️ TP5: 2.0372 (+215.45%) (RR:9.99)
☑️ TP6: Open 🔝
--------------------
❌ SL: 0.5065 (-21.57%) (-$100)
--------------------
💯 Maximum.Lev: 3X
⌛️ Trading Type: Swing Trading
‼️ Signal Risk: 🙂 Low-Risk! 🙂
--------------------
🔗 www.tradingview.com
❤️ Your Like & Comments are valuable to us ❤️
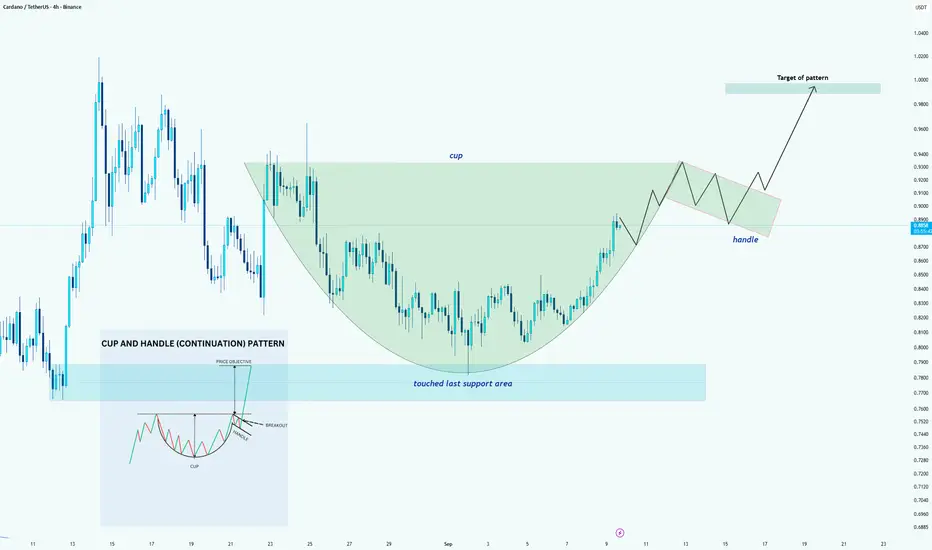
ADA/USDT – Cup & Handle PerspectiveHello guys!
Currently, the chart is showing the formation of a potential cup and handle pattern. The rounded bottom of the cup has already developed, suggesting that market participants are gradually regaining buying interest after the recent decline.
However, it’s important to note that:
The handle has not yet formed, and
A breakout confirmation is still missing.
This means the pattern is not yet validated —> it’s only a perspective and assumption at this stage. For the setup to confirm, we would need:
A consolidation forming the handle, and
A clean breakout above the neckline area.
If the breakout occurs with solid volume, the measured target of the pattern could push the price toward the $1.00 level, which also aligns with psychological resistance.
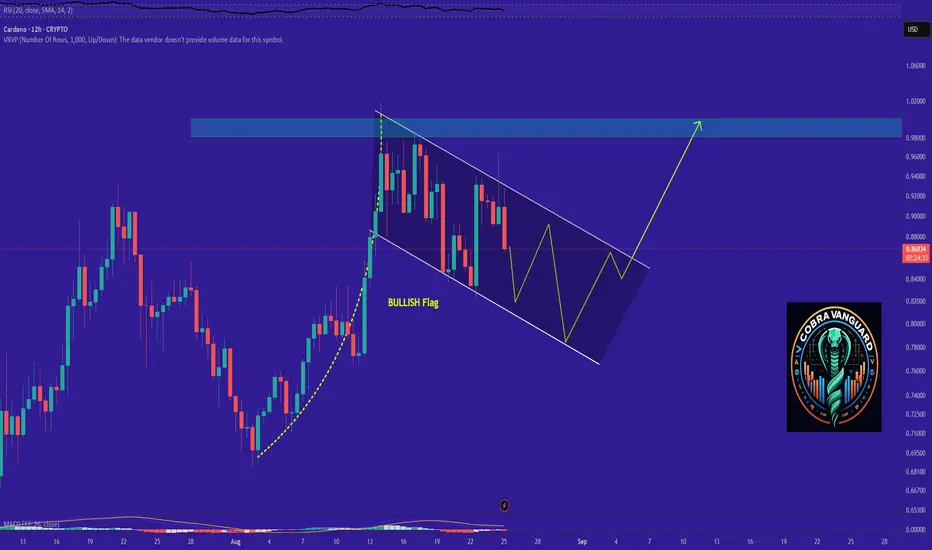
ADA analysis.Give me some energy !!!The price on the daily timeframe is within an ascending triangle, which can be promising. If the price breaks this pattern with bullish candles, it could easily rise by the distance of AB=CD .
Best regards CobraVanguard.💚

ADA/USDT – 5th Wave Breakout or Extended 4th Wave?KUCOIN:ADAUSDT might have completed its 4th wave of the larger 5 wave structure, but confirmation depends on breaking out of the current channel.
The daily RSI is nearing overbought, so there’s still a chance for a minor dip before continuation. Current upside target sits between 1.085 -1.20 USDT , aligning with the larger channel and forming a higher high. If this plays out, it likely completes a first wave of a bigger five-wave structure, followed by a cooldown.

$ADA - bullish area above 0.800$ support. CRYPTOCAP:ADA - bullish area above 0.800$ support.
Back to 1.00$ soon? 📈

ADA Battles $0.82 – Can Bulls Break $0.87 Resistance?Cardano (ADA) is trading around $0.82–$0.83 on the 4H chart, holding above its key support but still capped under resistance. In today’s video, I focus only on the short-term price structure: support at $0.8157–$0.8014, deeper levels at $0.7724 and $0.7620, and resistance at $0.8484, $0.8710, and $0.9347. A breakout above $0.8710 would be a key step for ADA to confirm recovery momentum.
The mid-term bias remains for more upside, but ADA must prove strength step by step. With Bitcoin showing bullish signals this morning and today’s NFP release increasing volatility, ADA’s reaction at these levels will define whether bulls can take control or if we see another retest of support.

ADA Buy/Long Setup (1D)Cardano, in our view, is currently within a major bullish structure, with wave D having just completed.
It now appears that the price is inside bullish wave E.
We have identified two specific entry levels for re-entering Cardano. At each entry level, you can take one step into a buy position.
The target is around \$1.20.
Please note that this analysis is based on the daily timeframe, so it may take some time to play out.
The invalidation level is the same as our stop loss. If this level is reached, the setup will be invalidated.
For risk management, please don't forget stop loss and capital management
Comment if you have any questions
Thank You

From First Trade To Endless Cycle Of Loss (Trading Addiction)Most traders step into the market with a simple thought: “ Just one trade. ”
But when that first small position turns green, the brain celebrates with a rush of dopamine. That sweet moment tricks you into believing you have figured the market out. What feels like confidence is often the first step into a dangerous spiral : the trading addiction cycle.
Hello✌️
Spend 2 minutes ⏰ reading this educational material.
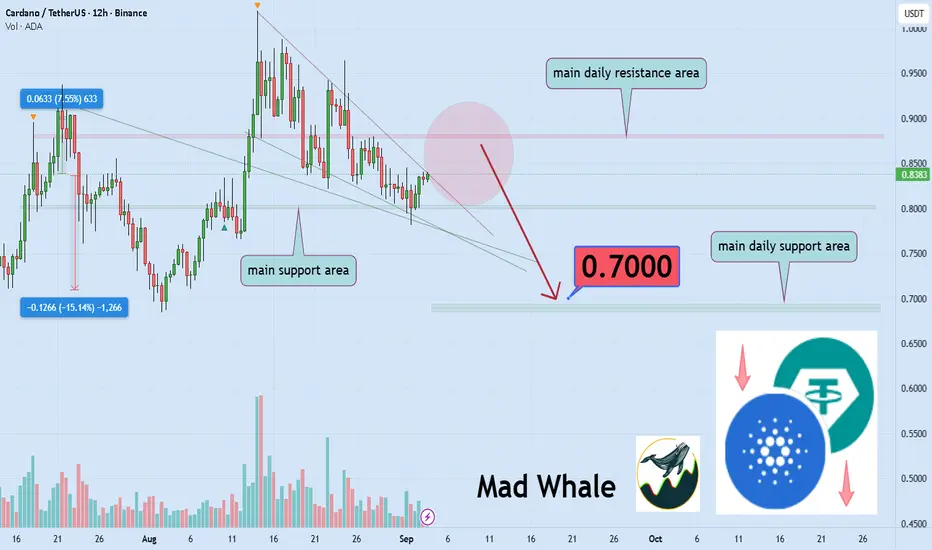
🎯 Analytical Insight on Cardano:
BINANCE:ADAUSDT has lost all key Fibonacci support levels 📉 and is approaching a major daily resistance. If the primary support, clearly marked on the chart, breaks, a drop of at least 15% could follow, targeting around $0.70 ⚠️.
Now , let's dive into the educational section,
🎯 Where It All Begins
It usually starts with harmless intentions like learning, experimenting, or just testing luck. The first quick win feels powerful. The brain records this victory as proof of skill, when in reality it’s often pure randomness. Instead of analyzing why the trade worked, traders rush to repeat the sensation of winning. That’s the invisible first hook.
💡 The Illusion of Small Success
Cognitive bias magnifies those early wins. Traders convince themselves they’ve cracked the code while the truth is they’ve only tasted noise. They stop focusing on analysis and instead chase the feeling. This is how harmless wins plant the seed of reckless entries, random positions, and overconfidence.
🌀 From Wins to Losses
After a few quick wins, overconfidence expands. Position sizes grow. That’s when the market turns. A simple correction wipes out days of profits, triggering the revenge-trading loop. The trader is no longer trading the chart; they’re trading their emotions.
⚠️ The Danger Zone
At this point, discipline disappears. The trader acts like a gambler chasing losses. Risk management is ignored, leverage climbs, and desperation sets in. The spiral accelerates until the account balance is drained.
🧩 The Role of Greed
Greed fuels this engine. After every gain, the brain whispers “more.” After every loss, it screams “get it back now.” That voice is why traders hold too long, re-enter too quickly, and burn capital faster than they ever expect.
🛡 The Real Meaning of Security
Many assume capital security is about wallets or exchanges. In reality, the biggest threat to your money is your own undisciplined mind. Safe investing means protecting yourself from yourself first. Without risk control, even the safest assets vanish.
🔄 The Endless Loop
Every loss tempts another entry. Every failed entry creates the belief “the next one will fix it.” This cycle is how most beginners and even many experienced traders lose their accounts long before they learn discipline.
🧭 The Way Out
Breaking free isn’t about finding a magic indicator or signal. The only way is a structured system, hard rules, and loyalty to them. Discipline is the seatbelt that keeps you alive when the market crashes. Without it, no strategy can save you.
🕹 TradingView Tools Against the Addiction Cycle
This is where TradingView tools can step in like a safeguard.
Alerts: Instead of staring at charts and forcing trades, let alerts call you only when your setups trigger.
Position Size Calculators and custom scripts: They prevent oversized entries that come from emotional overconfidence.
Volume Profile: Reveals zones where serious money moves, giving logic to your trades instead of raw impulse.
Trading Journal on charts: Annotating your own trades makes behavioral mistakes visible, showing you how emotions repeat.
These tools don’t just provide technical data. They create practical boundaries that break emotional patterns before they become addiction.
📌 Three Pieces of Advice to Escape the Trading Addiction Cycle
No profit is worth an undisciplined entry: If your only reason is “it feels right,” that trade is already lost.
Capital is sacred: Protect your principal above all. Profits come and go, but once the core is gone, the game ends.
Discipline beats strategy: The strongest traders are not the smartest, but the most consistent.
✨ Need a little love!
We pour love into every post your support keeps us inspired! 💛 Don’t be shy, we’d love to hear from you on comments. Big thanks , Mad Whale 🐋
📜Please make sure to do your own research before investing, and review the disclaimer provided at the end of each post.
ADAUSDT TRADE SETUP.ADAUSDT | 30m | Bearish Bias
Structure: Price is approaching a Bearish Order Block (OB) aligned with an FVG (Fair Value Gap).
Liquidity: A Buy-Side Liquidity (BSL) sweep is visible before potential reversal.
Expectation: Possible short-term push into OB + FVG zone before rejection.
POI: Red OB + Grey FVG zone is key for reaction.

ADAUSD energy builup supported at 7920The ADAUSD remains in a bullish trend, with recent price action showing signs of a corrective pullback within the broader uptrend.
Support Zone: 7920 – a key level from previous consolidation. Price is currently testing or approaching this level.
A bullish rebound from 7920 would confirm ongoing upside momentum, with potential targets at:
9345 – initial resistance
9617 – psychological and structural level
9900 – extended resistance on the longer-term chart
Bearish Scenario:
A confirmed break and daily close below 7920 would weaken the bullish outlook and suggest deeper downside risk toward:
7611 – minor support
7290 – stronger support and potential demand zone
Outlook:
Bullish bias remains intact while the ADAUSD holds above 7920. A sustained break below this level could shift momentum to the downside in the short term.
This communication is for informational purposes only and should not be viewed as any form of recommendation as to a particular course of action or as investment advice. It is not intended as an offer or solicitation for the purchase or sale of any financial instrument or as an official confirmation of any transaction. Opinions, estimates and assumptions expressed herein are made as of the date of this communication and are subject to change without notice. This communication has been prepared based upon information, including market prices, data and other information, believed to be reliable; however, Trade Nation does not warrant its completeness or accuracy. All market prices and market data contained in or attached to this communication are indicative and subject to change without notice.

ADA/USDT — Breakout & Retest at a Critical Fibonacci Zone!
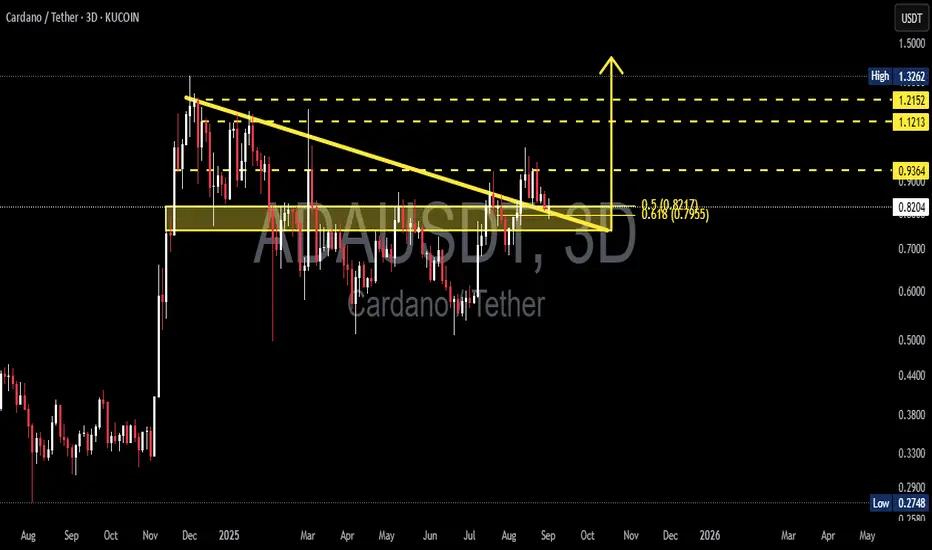
Currently, Cardano (ADA/USDT) is at a decisive point on the 3D timeframe, where price has just broken out of a mid-term downtrend line and is now retesting a very strong support area.
---
🔎 Technical Structure & Pattern
Downtrend line has been broken to the upside → sign of trend reversal.
Price is retesting a confluence support zone (0.78 – 0.83) consisting of:
Historical support/resistance (yellow box).
Fibonacci retracement 0.5 (0.8217) and 0.618 (0.7955).
This setup forms a classic “breakout & retest” pattern — where old resistance potentially flips into new support. If it holds, ADA could confirm a mid-term bullish continuation.
---
🟢 Bullish Scenario
If the price holds and closes above 0.795–0.821, bullish momentum remains valid.
Potential upside targets:
R1 = 0.9364 (short-term swing target).
R2 = 1.1213 (strong confirmation of trend shift).
R3 = 1.2152 (key resistance before major highs).
R4 = 1.3262 (major high & psychological zone).
In this scenario, ADA could stage a significant rally if market sentiment supports it.
---
🔴 Bearish Scenario
If the price breaks down below 0.7955 (Fib 0.618), the bullish setup may turn into a false breakout.
Downside targets to watch:
Previous consolidation range around 0.60–0.70.
Deeper support near 0.44.
Worst-case scenario: retesting the major low at 0.27.
---
📌 Conclusion
ADA is currently at a make-or-break level.
As long as price holds above 0.795–0.821, the bias remains bullish with targets at 0.94 – 1.12 in the mid-term.
A failure to hold this zone would shift bias to bearish, opening the way for deeper corrections.
Traders should closely monitor price action & volume around this retest, as it will determine ADA’s next big move.
---
📝 Notes
Always apply risk management (stop-loss & position sizing).
Wait for 3D/weekly candle close confirmation.
This is technical analysis, not financial advice.
#Cardano #ADA #ADAUSDT #CryptoBreakout #CryptoTrading #TechnicalAnalysis #PriceAction #Altcoins #CryptoSetup
Cardano Above Support, Safe · Bullish Action Will ContinueHere we have Cardano with a bullish chart and market conditions.
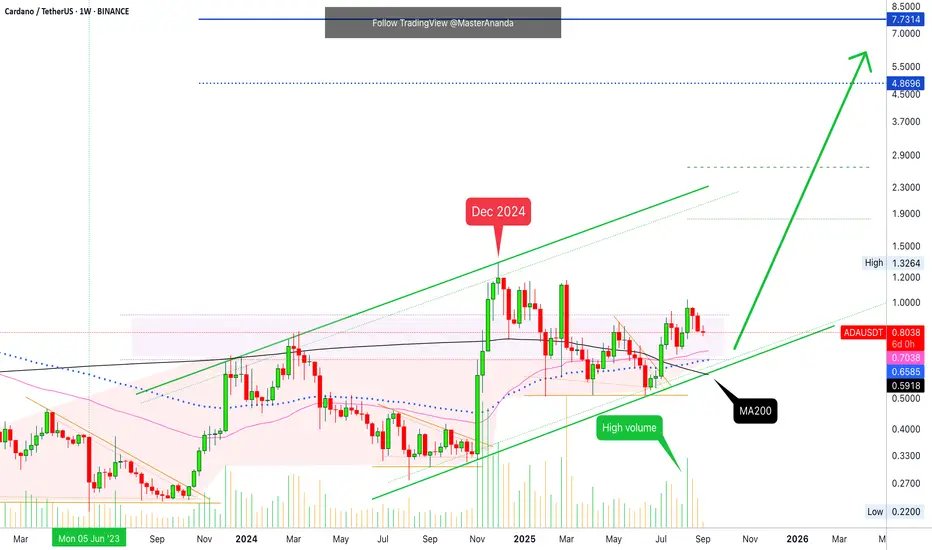
ADAUSDT weekly has been trading above EMA55, EMA89 and MA200 for weeks. Seven weeks to be exact. As the action happens above these levels, bearish momentum and sellers pressure has been very weak. Naturally, weak bearish action favors the bulls.
The highest volume bar since the strong March drop and rejection happened in August and it was bullish. Two weeks closed red recently and yet again there is low bear volume.
EMA55/89 and MA200 long-term are just too strong support. These are not being tested by the way. Three weeks red and yet ADAUSDT continues with local higher lows and ready to grow.
These weeks are just a small pause, which is great. When the market is growing long-term as ADA is doing, there is never any hurry, the market grows but fluctuates with prices rising and dropping with the classic upward bent.
Remember, Cardano has been growing since June 2023, it is a rising trend. The last major move and high was an advance that ended in December 2024.
It's been nine months. This is all the consolidation we need for a new and strong advance.
An advance tend to happen every 6-10 months. 10 months being the maximum and Cardano is now at 9. You know what this means? We are getting very close.
2025 produced a triple-bottom pattern. This is a very strong bullish signal.
The 16-June 2025 week (22-June) marks the final low and the break above MA200 7-July marks the start of the 2025 bull market bullish wave.
Cardano is already, right now, on a path to hit a new all-time high. This will be happening within a few months at max—or less.
Thank you for reading.
Namaste.
ADA Cardano Equilibrium Pullback and Possible Trade Opportunity🔵 ADA (Cardano) on the weekly timeframe is holding a strong bullish trend 📈. We can see price has retraced into the Fibonacci 50–61.8% zone 🔢, which is typically a pullback into equilibrium ⚖️—an area often considered an ideal continuation entry in line with the trend.
👀 My bias remains long, but let’s break it down further:
📊 On the 4H chart, price action suggests a potential base forming—possibly big money accumulation 💼💰. That said, we don’t yet have a decisive break above to confirm.
🔎 Zooming into the 30M chart, the recent downtrend has been compromised with a shift in structure to the upside 🔄📈. What I’m waiting for now is:
1️⃣ An expansion above the previous high
2️⃣ A retracement and retest
3️⃣ A potential buy opportunity in alignment with trend ✅
This setup also aligns with a possible Wyckoff accumulation 📚—we’ve got relative equal lows, and a liquidity spike below could create a springboard for more bullish activity 🌱🚀.
⚠️ This is purely educational and not financial advice 🔒

ADA Setup – Double Bottom at 61.8% FibADA has retraced to the 61.80% Fibonacci support while forming a double bottom—a setup that’s typically bullish. This confluence zone has often acted as a springboard for reversals and could offer a favorable long spot opportunity if support holds.
Trade Setup:
Entry Zone: $0.75 – $0.82
Take Profit Targets:
🥇 $0.98 – $1.15
🥈 $1.50 – $1.60
Stop Loss: Close below $0.72

ADA : BUY OR SELL?Hello friends
Well, after the decline we had, the price was able to create a small channel in the specified support area, which indicates the accumulation of the price, and if the support is maintained and the channel is broken, the price can move to the specified targets.
Otherwise, and if the support is broken, the decline will continue with a valid formation...
*Trade safely with us*

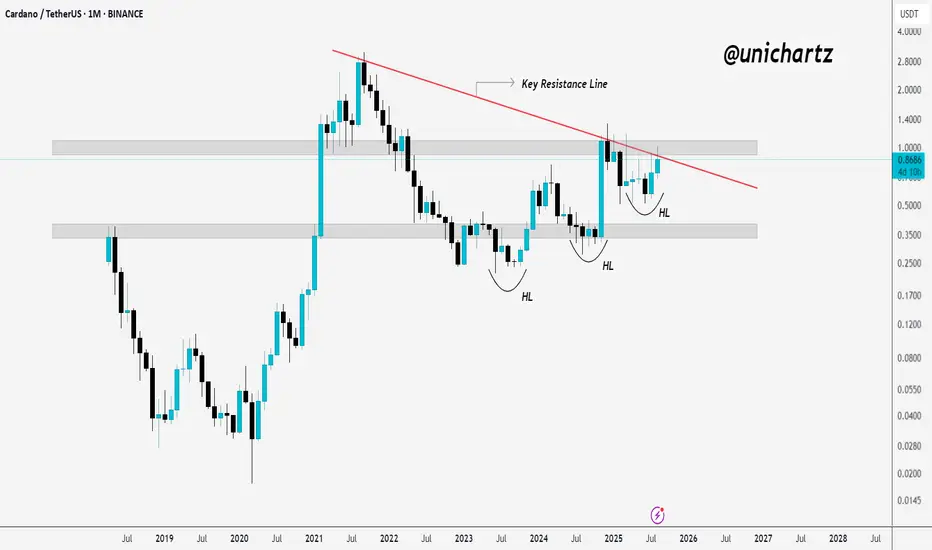
Cardano's Long-Term Setup Looks Too Clean to IgnoreCRYPTOCAP:ADA (Cardano) is forming a strong bullish structure with clear higher lows and is now approaching a major monthly resistance trendline. This setup hints at a potential breakout.
The $0.35–$0.40 zone has held well as support, and if ADA breaks above the red resistance line, it could signal the start of a long-term uptrend. Momentum is quietly building.
DYOR, NFA
Cardano Price To Bounce As IOHK Audit Report Nears ReleaseBINANCE:ADAUSDT price is currently $0.85 , holding steady above the $0.83 support level. The Ichimoku Cloud shows a bullish outlook, suggesting positive momentum for ADA. Investors are keeping a close eye on price movements, with potential for further gains if market conditions remain favorable for the altcoin.
A key catalyst for potential price growth is the upcoming audit report of Input Output Global’s ADA holdings. Charles Hoskinson, BINANCE:ADAUSDT founder, requested the audit to address transparency concerns after allegations of $600 million in misappropriated ADA . The report could play a crucial role in boosting investor confidence and market sentiment.
If the audit report meets investor expectations, BINANCE:ADAUSDT could see a price increase, potentially pushing it to $0.90. Successfully securing this level as support may pave the way for further gains, reaching $1.00. Such a move would solidify Cardano's position and help avoid a drop below the $0.83 support level.
ADA's Situation!So if you pay attention to the ADA chart you can see that the price has formed a Ascending FLAG which means it is expected to price move as equal as the measured price movement.( AB=CD )
NOTE: wait for break of the FLAG .
PREVIOUS ANALYSIS
Best regards CobraVanguard.💚
ADAUSDTI have conducted a technical analysis of 1150 using the Janne School methodology, combining both numerical and temporal analysis. Based on my findings, I believe that 1150 is poised to reach a target price of 44 rs. My analysis incorporates various
