ADA LONG SIGNAL 45 MINgerade
Hello dear traders,
In the Cardano cryptocurrency on the 45-minute timeframe, we witnessed the breaking of a resistance level, marked by a black line, which indicates a bullish trend. We expect that with the ascending trend and the setup of a long position in this area, the price will continue to rise. I have provided you with the stop loss and take profit levels.
Thank you for your support.
ADAUSDT

ADAUSDT Short Term Target $0.70!ADAUSDT Technical Analysis Update
ADAUSDT Currently Trading at $0.371
The ADA price broke its trend resistance line with high volume.
Buy zone : Below $0.372
Stop loss : $0.339
Always Keep Stop Loss

MINSWAP - Gems Series - 10x to 30xGreetings,
Welcome back to Gems Series!
Due to recent moves in cryptosphere, we will to to publish multiple Gems every day.
First one for today is Minswap and it's token Min.
This coin bottomed a few weeks ago then broke out consolidated and broke out again today.
This project is built on Cardano blockchain and today's move was on the bake of Cardano's own move up. Currently Cardano has only reached about 19% of it's previous all time high and a lot of room to grow. Minswap is one of the best project currently productive on Cardano and a DEX no less therefore this is definitly a GEM!
Here is the report on the selection criteria.
1- Project Status = Active
2- Industry = DeFi (Decentralized Exchange)
3- Community Involvement = Healthy
4- Prominent Listings = None - On Minswap itself
5- MarketCap = $60M
6- Coin Supply = Cir: 1.02B, Tot: 5B
This a small cap and has a lot of room to grow. Based on the factors, this coin has a potential for 10x to 30x rally.
Note: This is not financial advise and shall only be used for educational and/or entertainment purpose. Please do your own research before investing. Crypto Markets are highly volatile and you are responsible for the risk of losing your entire investment.

Cardano's Explosive Potential: Targeting $1 and Beyond Cardano (ADA) is about to explode with potential, aiming for a target of $1 and beyond!
Cardano, the blockchain platform that has been captivating the crypto community, is making significant strides towards becoming a force to be reckoned with. With its unique approach to scalability, sustainability, and security, Cardano has been gaining momentum, and the time to act is now.
Why should you be excited? Here's why:
1. Unleashing the Power of Proof-of-Stake: Cardano's innovative proof-of-stake (PoS) consensus mechanism sets it apart from other cryptocurrencies. PoS offers scalability, energy efficiency, and reduced environmental impact, making it an attractive alternative to the energy-intensive proof-of-work systems.
2. Smart Contracts on the Horizon: Cardano is on the verge of releasing its much-anticipated smart contract functionality through the Alonzo upgrade. This development will enable developers to create decentralized applications (dApps) on the Cardano blockchain, opening up a world of possibilities for innovation and growth.
3. Embracing Sustainability and Regulatory Compliance: Cardano takes a responsible approach by prioritizing sustainability and regulatory compliance. Cardano aims to foster trust and attract institutional investors by ensuring compliance with global regulations, further driving its growth potential.
Now, let's get down to business. It's time to take action and seize this incredible opportunity. Here's your call-to-action:
Long ADA now and position yourself for the Cardano revolution! With all the exciting developments in the pipeline, Cardano is set to soar to new heights. By taking a long position on ADA, you can potentially ride the wave of success and reap the rewards.
Remember, timing is crucial in the world of trading. As Cardano continues to gain traction and its value surges, you don't want to be left behind. Act now and join the ranks of forward-thinking traders who recognize Cardano's potential.
So, what are you waiting for? Open your trading platform, place your long position on ADA, and get ready to witness the explosive growth of Cardano firsthand.
Get ready to embark on an exhilarating trading adventure with Cardano!

ADAUSDTADAUSDT
We suggest considering the option with growth. If ADA manages to break through the green resistance line and consolidate higher, then the growth option will become a higher priority.
When breaking through the resistance line, you should pay attention to the following targets: 0.3749 – 0.4479 – 0.4978 – 0.5601.
The growth scenario will not be relevant if the price can break through the red support and consolidate below the level of 0.243
In case of growth, do not forget that the higher the goal, the more dangerous it is. Don’t be greedy and fix part of the profit in time so that a sharp drop does not eat up all the profit.
The idea is medium term.
Don't forget to show your support by like(rocket) and comment✅
Also you can ask for only 1 altcoins analysis and i will try to do my best to cover as much as i can✍️

ADAUSDT → Cup with Handle before distribution BINANCE:ADAUSDT is forming a breakout of the key pattern resistance, but we have not seen a corresponding reaction yet. The price is updating the 6-month high, but we did not wait for the distribution. Hopes are fueled by the formation of the "Cup with handle" pattern and the Golden Cross of MA200 & MA50
A reversal pattern "Cup with handle" is forming in relation to the limit resistance area at 0.3807. A false break of resistance forms a correction and consolidation near the key area, which peculiarly reminds us of the key pattern
Fundamentally, the cryptocurrency market is mainly waiting for results regarding ETF applications that the SEC is reluctant to review. Approval of applications for spot ETFs will greatly increase the inflow of funds and market capitalization
On the chart, the support at 0.3529 - 0.3500 is important for us. Within the framework of the forming pattern and correction, the price may test this area with a false breakout, which will begin to form a bullish potential, because according to statistics, the strongest movements occur after a false breakout.
Resistance levels: 0.3807, 0.3850
Support levels: 0.3529, 0.3490
I expect a support retest before distribution. A strong impulse can start after the breakout of the locational downside resistance of the pattern "Cup with handle"
CRYPTOCAP:TOTAL COINBASE:BTCUSD
Regards R. Linda!

ADAUSDT - WHALES Prefer a Lower Entry🐳Hi Traders, Investors and Speculators of the Charts 📈📉
A quick look at the Fractal that played out on Cardano during Jan - Feb 2021.
A Big demand zone lies a little lower towards the support, and if we take a quick look at Phoenix Ascending (EMA, RSI, LSMA and Momentum) more downward price action seems the most likely for the near future. However, trying to catch the exact bottom is a dangerous game, and I am happy with this entry and perhaps a little lower towards the lower support zone as pointed out on the chart.
If you like Fractals; you'll probably love this idea on BTC:
_______________________
📢Follow us here on TradingView for daily updates and trade ideas on crypto , stocks and commodities 💎Hit like & Follow 👍
We thank you for your support !
CryptoCheck

34% ADAHello
After a pullback its high time put your finger on buy button.
A nice divergence and breakout of trendline.

Short $ADA at Double TopAt $0.46 BINANCE:ADAUSDT has hit resistance and formed a double top.
We have had a nice altcoin pump, now it's time to retrace.
If Bitcoin keeps going up, Cardano could break through this resistance pretty easily, but a short for a few days may be lucrative.

Cardano Enters Buy with Strong Upward Channel - Time to Long ADAToday, I am thrilled to bring your attention to Cardano (ADA), as it enters a compelling buy phase with a strong upward channel. This is an exciting moment to seize, and I strongly encourage you to consider going long on Cardano. Let's dive into the details!
Cardano, the third-largest cryptocurrency by market capitalization, has been displaying impressive bullish momentum recently. Its price has been steadily climbing within a well-defined upward channel, indicating a positive trend that traders like us simply cannot afford to miss. The consistently higher highs and higher lows demonstrate the market's confidence in Cardano's potential for further growth.
The technical indicators for Cardano are also painting a promising picture. The Relative Strength Index (RSI) is comfortably positioned within the bullish zone, suggesting that there is still room for ADA to rally. Additionally, the Moving Average Convergence Divergence (MACD) indicator is showing a bullish crossover, further supporting the notion of an upward movement in the near future.
Considering these factors, it is evident that Cardano has tremendous potential for significant gains. As traders, we must identify and capitalize on such opportunities, and Cardano's current market conditions provide an ideal chance to do so.
Now, it's time for the call-to-action! I encourage you to take advantage of this bullish momentum and consider going long on Cardano. By opening a long position on ADA, you position yourself to benefit from the anticipated upward movement in its price. This could potentially yield substantial profits, allowing you to further solidify your trading success.
Remember, successful trading requires seizing opportunities when they present themselves. Cardano's upward channel and positive technical indicators indicate a highly favorable environment for long positions. Don't let this opportunity slip away!
As always, it is essential to conduct your own analysis and risk management before making any trading decisions. Keep a close eye on the market, set appropriate stop-loss orders, and continuously reassess your positions based on market developments.
So, are you ready to embark on this Cardano trading journey with me? Let's make the most of this bullish trend and aim for remarkable profits!
Wishing you a successful and prosperous trading experience!

🚧Cardano is Bullish now🚧 & many Traders don't see it 👀!!!ADAUSDT is in an ascending triangle which means the price is about to do a good bullish movement. The price can increase as much as the measured price movement ( AB=CD ) .The break out needed for increasing further has not happened but it should happen pretty soon.
🤑Stay awesome my friends.
_ _ _ _ _ _ _ _ _ _ _ _ _ _ _ _ _ _ _ _ _ _ _ _ _ _ _ _ _ _ _ _ _
✅Thank you, and for more ideas, hit ❤️Like❤️ and 🌟Follow🌟!
⤵️⤵️⤵️⤵️⤵️⤵️⤵️⤵️⤵️⤵️⤵️⤵️⤵️⤵️⤵️⤵️⤵️⤵️⤵️⤵️⤵️⤵️⤵️

ADA → TriangleWe have a possible Triangle pattern with a target at 0.46, as long as the price does not break the 0.37 zone.

Cardano can continue to rise up to 0.42Hi everyone,
Cardano managed to break 0.35 resistance level and hold above it. Moreover it managed to rise up to local resistance at 0.38 price. At the moment ADA is trading in a narrow price range of 0.37 - 0.39.
For the past 4 weeks Cardano price increased on 60% and it has a good chance to continue to grow.
Next big resistance level for Cardano located at 0.42 price and it has good chance at least touch it but in order it to happen Bitcoin price should remain at the same levels and avoid big drops.
In case of correction on Cardano I expect that price will drop in 0.35 - 0.33 price range and after that can continue to rise.
Please, do not forget to boost this idea & share it with your friends; thanks.

adausdtSupport and press the rocket to cheer me up
Observe the ten percent loss limit
Stay away from Bitcoins
Feel free to buy and sell and post your comments

ADAUSDT Idea - CARDANO RallyHello traders,
I must admit, the current situation has me somewhat uncertain.
However, it's crucial to consider the potential for a significant price surge,
possibly reaching the $0.5500 range!! "Really!"
Stay vigilant and keep a close eye on the market dynamics.
BINANCE:ADAUSDT BINANCE:ADAUSD
⚠️ Disclaimer: The viewpoints shared represent my individual outlook on the market, based on publicly accessible information and historical data. While a portion of these opinions is influenced by my actual trades, others are not. It's important to note that I am not a financial advisor, and I do not assume any responsibility for the decisions you make in your trading activities.
✅ Feel free to share your inquiries or suggestions in the comments. I am more than willing to assess and analyze any cryptocurrency, forex currency pair, or stock index that piques your interest, so, Please don't hesitate to ask or mention the specific currency chart you'd like me to review.

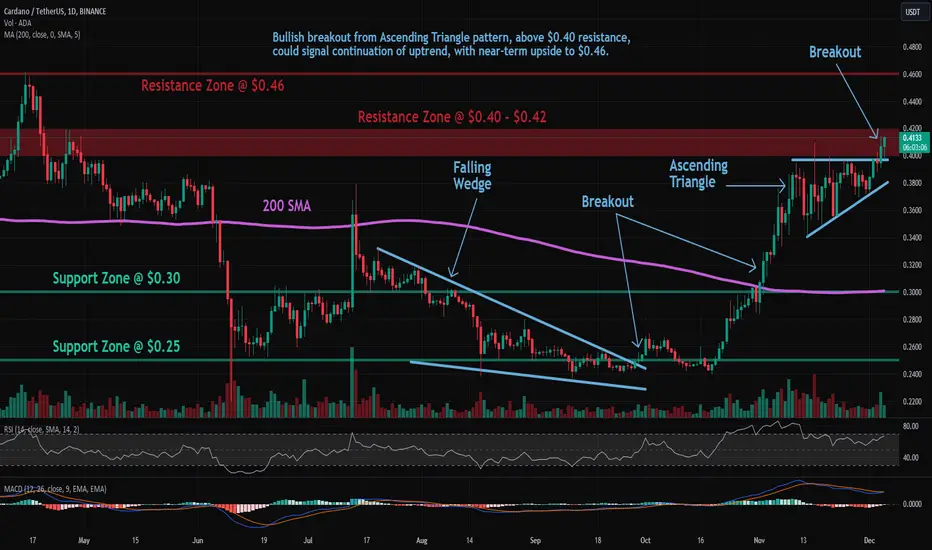
ADA: Ascending Triangle BreakoutCardano (ADA) technical analysis:
Trade setup : Bullish breakout from Ascending Triangle pattern, above $0.40 resistance, could signal continuation of uptrend, with near-term upside to $0.46. Previously, price broke above 200-day moving average ($0.30), which confirmed a bullish trend reversal to an Uptrend.
Pattern : Ascending Triangle which is a continuation pattern (it typically breaks out in the direction of existing trend). Most traders wait for a breakout but Swing traders could trade between the trendlines (Buy at Support, Sell at Resistance) as long as the trendlines are still relatively far apart.
Trend : Uptrend across all time horizons (Short- Medium- and Long-Term).
Momentum is Mixed as MACD Line is below MACD Signal Line (Bearish) but RSI > 55 (Bullish). MACD Histogram bars are rising, which suggests that momentum could be nearing another upswing.
Support and Resistance : Nearest Support Zone is $0.30 (previous resistance), then $0.25. The nearest Resistance Zone is $0.040 – $0.42, then $0.46.
Cardano (ADA) Price Rises With Soaring TransactionsSignaling Institutional Interest Cardano (ADA) Price Rises.
Recent data shared by a renowned analyst suggests a notable surge in Cardano transactions exceeding $100,000 over the past three months. This spike is seen as a potential indicator of heightened interest from institutional players and whales. This also indicates an upcoming price surge for ADA.
The latest data by Cardano Explorer shows that at Epoch 450, 451, and 452, the transactions have significantly seen a rise above 1,500,00. The transaction signifies a strong institutional hold on Cardano.
Cardano’s Flourishing Ecosystem
Recently, the launch of 150 projects and the continuous work on 1,304 projects highlight a vibrant ecosystem. This could be another reason for Cardano’s soaring transactions.
The creation of a staggering 9.1 million native tokens showcases the extensive customization options available on Cardano. Moreover, the establishment of 81,447 token policies exemplifies the diverse utility of Cardano’s asset creation capabilities. This makes Cardano a versatile choice for blockchain projects.
A significant milestone is the processing of 79.2 million transactions, affirming Cardano’s reliability and growing institutional adoption.
In addition to the growth of its ecosystem and network activity, Cardano developers have been working on scaling solutions, increasing node efficiency, and generally strengthening the backend infrastructure. Moreover, the recent completion of Fund11 proposals stands out as a testament to the platform’s dedication to innovation and community-led project funding.
Taking the advancement ground further, Cardano’s recent launch of Girolamo, an internet-enabled generative chatbot also gathered many eyes. Nevertheless, the chatbot is built to respond to a wide range of inquiries, from daily to industry-specific.
The Surging TVL And Price
Cardano’s Total Value Locked (TVL) again skyrocketed above all others. According to Defillama, Cardano’s TVL surged more than 50% within the year reaching $340 million first time in 19 Months.
The top positions are held by Indigo, Minswap, and Liqwid. The top three Dapps hold 78% of the Total Value Locked (TVL) in the Cardano ecosystem.
This came after the recent development in the Cardano (ADA) space as well as the Bitcoin rally. Resembling the same, Cardano (ADA) price saw an increase of 3.10% over the last day and 6.66% over the previous seven days. At the press time, ADA is trading at $0.408803, with $380,221,658.42 worth of trading volume in a day.

#ADA #CardanoIt is moving in an ascending triangle, which can escape from the top of the triangle towards the daily targets and touch the specified targets by breaking the sub-swing of the corner pattern. Therefore, after breaking the triangle and confirming the pullback, it is possible to enter a buy position around the specified targets.

Start renge ADA❤️❤️Thanks for boosting 🚀 and supporting us!
📈Start renge trend and entry to position sell in resistace & buy in support.
📊 (sell) : 0.3946
🔴 Stop Loss : 0.4122
🎯 Take Profit : 0.3441
🔗 For more communication with us, send a message in TradingView.

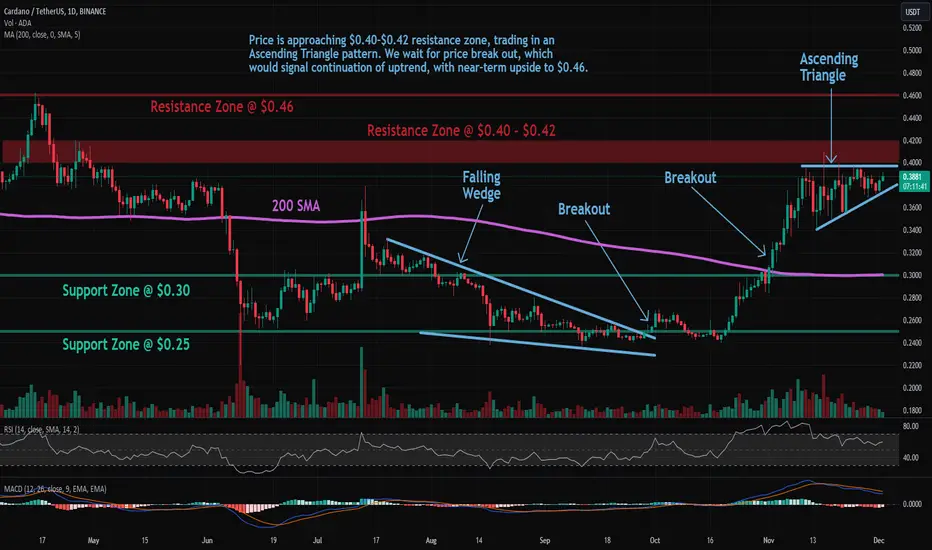
ADA: Ascending TriangleTrade setup : Price is approaching $0.40-$0.42 resistance zone, trading in an Ascending Triangle pattern. We wait for price break out, which would signal continuation of uptrend, with near-term upside to $0.46. Previously, price broke above 200-day moving average ($0.30), which confirmed a bullish trend reversal to an Uptrend.
Pattern : Ascending Triangle which is a continuation pattern (it typically breaks out in the direction of existing trend). Most traders wait for a breakout but Swing traders could trade between the trendlines (Buy at Support, Sell at Resistance) as long as the trendlines are still relatively far apart.
Trend : Uptrend across all time horizons (Short- Medium- and Long-Term).
Momentum is Mixed as MACD Line is below MACD Signal Line (Bearish) but RSI > 55 (Bullish).
Support and Resistance : Nearest Support Zone is $0.30 (previous resistance), then $0.25. The nearest Resistance Zone is $0.040 - $0.42, then $0.46.
ADA/USDT 1DAY UPDATE BY CRYPTOSANDERS !!Hello friends, welcome to this ADA/USDT update from Crypto Sanders.
Chart Analysis:- Cardano landed on its key support at 38 cents this week and, in the process, also registered a 3% loss in valuation. If bulls hold here, then ADA could end its correction.
The current resistance is found at 41 cents, and it may take some time before this cryptocurrency tests it again.
ADA has a good opportunity to reverse and end its correction at this level. If it fails and the current support falls, then the price is likely to go to 35 cents next.
I have tried to bring the best possible results in this chart.
If you like it, hit the like button and share your charts in the comments section.
Thank you.

CARDANO: Hydra update Bullish for ADAHi Traders, Investors and Speculators of Charts📈📉
Ev here. Been trading crypto since 2017 and later got into stocks. I have 3 board exams on financial markets and studied economics from a top tier university for a year 🏫
Cardano (ADA) has gained significant global recognition as a blockchain platform due to its emphasis on scalability, security, and interoperability. Frederik Gregaard, CEO of the Cardano Foundation, recently shared his vision for potential use cases, envisioning a future where Cardano plays a pivotal role in areas such as supply chain management, digital identity, and decentralized finance (DeFi).
In recent developments, Cardano welcomed the launch of Empowa, a new platform built on its network, which aims to address the housing crisis in Africa. Empowa operates as a DeFi platform, providing affordable housing loans to low-income families within the country. The platform operates entirely on Cardano's infrastructure, demonstrating the platform's capability to support innovative solutions.
Furthermore, Cardano has introduced Hydra, a scalability solution designed to enhance its mainnet's transaction throughput. Hydra serves as a layer 2 scaling mechanism that enables a significant increase in transactions per second while maintaining the security and decentralization aspects of the Cardano network. This becomes particularly significant as Ethereum experiences surging gas fees, prompting users to explore alternative options.
Looking ahead, Cardano's founder, Charles Hoskinson, who is also a co-founder of Ethereum, consistently emphasizes the importance of true decentralization as a global imperative. Cardano continues to prioritize scalability, security, and interoperability, attracting developers and entrepreneurs interested in building decentralized applications with practical use cases. With the recent launch of Empowa and the upcoming implementation of Alonzo, Cardano showcases its potential to emerge as a significant player in the realms of DeFi and smart contracts. The introduction of Hydra further strengthens its position as a secure and scalable blockchain platform.
The underlying technology of Cardano and its recent launch have the potential to disrupt traditional financial service providers and institutions in several ways:
Decentralization and Trust: Cardano's blockchain technology operates on a decentralized network, meaning that it does not rely on a central authority or intermediary for transactions and record-keeping. This decentralized nature eliminates the need for traditional financial institutions as middlemen, reducing transaction costs and increasing trust in the system. By leveraging blockchain's transparent and immutable nature, Cardano offers a trustless environment where participants can interact directly without the need for intermediaries.
Scalability and Efficiency: The scalability solutions implemented in Cardano, such as the Hydra protocol, enable the network to process a high volume of transactions per second. This scalability advantage allows Cardano to handle a large number of users and transactions simultaneously, providing efficiency and faster settlement times compared to traditional financial systems that may suffer from bottlenecks and delays.
Lower Costs: Traditional financial institutions often impose high fees for various services, including remittances, loans, and cross-border transactions. Cardano's decentralized infrastructure and smart contract capabilities can significantly reduce costs associated with these services. For example, decentralized finance (DeFi) platforms built on Cardano can provide lending, borrowing, and other financial services at a fraction of the cost compared to traditional intermediaries.
Inclusion and Accessibility: One of the key advantages of Cardano is its potential to provide financial services to underserved populations. By leveraging its interoperability features, Cardano can facilitate cross-border transactions and enable access to financial services for individuals who are unbanked or underbanked. This inclusivity can help bridge the gap between different economic strata, empowering individuals and communities that have been historically marginalized by traditional financial institutions.
Innovation and Smart Contracts: Cardano's platform enables the development and execution of smart contracts, which are self-executing contracts with predefined conditions that automatically execute when the conditions are met. Smart contracts offer a programmable and auditable framework for various financial applications, including decentralized exchanges, lending platforms, and insurance services. The ability to create innovative financial products and services on Cardano opens up new opportunities for entrepreneurs and developers to disrupt the traditional financial landscape.
While the adoption of Cardano and its technology in the mainstream financial industry is still in its early stages, the platform's focus on scalability, security, and interoperability positions it as a potential competitor to traditional financial service providers and institutions. As Cardano continues to evolve and attract more users and developers, its impact on traditional finance could become more significant in the future.
_______________________
📢Follow us here on TradingView for daily updates and trade ideas on crypto , stocks and commodities 💎Hit like & Follow 👍
We thank you for your support !
CryptoCheck
KUCOIN:ADAUSDT COINBASE:ADAUSDT BINANCE:ADAUSDT CRYPTOCAP:ADA COINBASE:ADAUSD KRAKEN:ADAUSD BITFINEX:ADAUSD

Exciting Cardano Rallies with New Resistance Targets!
Cardano (ADA) is on fire, and we have some thrilling updates to share with you. Get ready to long ADA and ride the wave of Cardano's incredible rally!
Cardano has been making some serious waves in the market, and we couldn't be more thrilled. The recent rallies have been nothing short of extraordinary, with ADA showing remarkable strength and resilience. We're excited to announce that our expert analysts have set new resistance targets for Cardano, ranging from 0.38 to 0.41. Yes, you read that right - Cardano is aiming high, and it's time for us to join the party!
Why should you consider long positions on Cardano? Well, let's take a moment to appreciate the immense potential this cryptocurrency holds. Cardano has been making significant strides in the blockchain space, with its innovative technology and commitment to scalability and sustainability. The recent launch of the much-anticipated Alonzo hard fork brings smart contract capabilities to Cardano, opening doors to a world of exciting opportunities.
With the introduction of smart contracts, Cardano is poised to become a leading platform for decentralized applications (DApps) and DeFi projects. The market sentiment is overwhelmingly positive, with investors and developers alike flocking to Cardano's ecosystem. This surge in interest is fueling the ongoing rally, and we firmly believe that the momentum will only continue to grow.
So, what's the call-to-action here? It's time to seize the moment and take advantage of Cardano's upward trajectory. Don't miss out on this thrilling opportunity to long ADA and potentially reap substantial profits. Our team of experts has carefully analyzed the market dynamics and set the resistance targets at 0.39 to 0.41. Now is the time to act, and we encourage you to consider opening long positions on Cardano.
Remember, trading always carries risks, and it's essential to conduct your own research and make informed decisions. However, with Cardano's recent developments and the market sentiment in its favor, the potential rewards are simply too enticing to ignore.
If you're ready to embark on this exciting journey with Cardano, we're here to support you every step of the way. Our team of experienced traders and analysts is available to provide you with valuable insights, market updates, and trading strategies to help you navigate the Cardano rally successfully.
Don't let this opportunity pass you by! Long Cardano (ADA) now and join the ranks of traders who are capitalizing on this thrilling rally. Together, let's ride the wave of Cardano's success!
