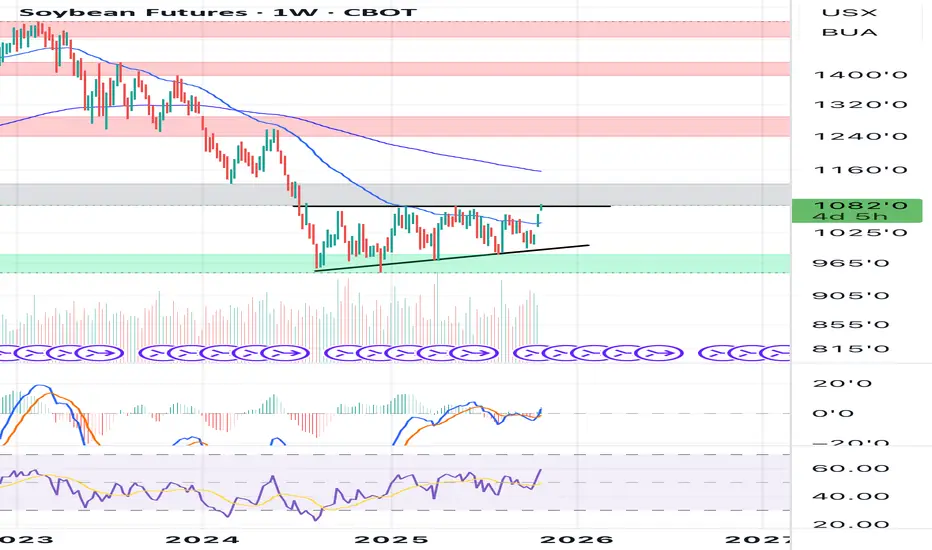
Long on Soybeans Clear ascending triangle in play.
RSI, MACD are bullish and also above the 50 EMA.
I’m bullish on soybeans and current fundamentals.
I will long on breakout of ascending triangle.
TP - 1200
Agricultural Commodities
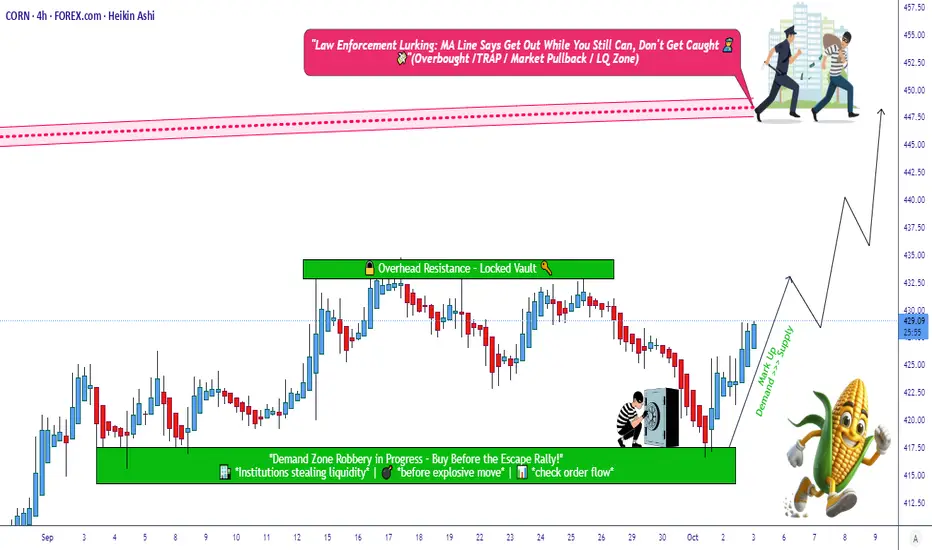
Corn Agro Market Strategy Map – Bullish Path Ahead!🚜🌽 CORN Agro Commodities Wealth Strategy Map (Swing/Day Trade)
📌 Plan: Bullish (Swing + Day Trade Setup)
✅ Market sentiment favors bullish bias in CORN.
🎯 Swing/Day traders can look for upside continuation until resistance zones.
🎯 Entry Plan (Layering Style Method)
🔑 You can enter at any price, but pullbacks are safer.
Layered Buy Limit Orders (multi-entry strategy):
🟢 417
🟢 420
🟢 422
🟢 425
🟢 427
📌 You can extend or add more layers depending on your personal risk appetite.
🛡️ Stop Loss (Protective Exit)
🚨 Thief SL is placed at 415.
📝 Note: This is my personal style. You can set your own SL depending on your strategy & risk comfort.
🎯 Target Levels (Profit Booking)
🏁 447 → Suggested take-profit zone.
🚔 450 = “Police Barricade” → Acts as a strong resistance + potential trap + overbought zone.
💡 Best practice: Exit at 447 before the heavy resistance wall to lock in profits.
🗣️ Important Note for Readers (Thief OG’s 🕶️)
🙏 This is not financial advice.
⚡ You are free to set your own TP/SL.
📌 I share my strategy map — you manage your own risk.
🏦 Market is open to everyone → take profits in your own style, at your own risk.
🔍 Key Insights & Market Correlations
🌾 Agro Commodity Correlations:
CORN often moves in relation to CAPITALCOM:WHEAT and $SOYBEAN.
Soft commodities like PEPPERSTONE:COFFEE can also reflect agro market sentiment.
💵 Currency Link (Dollar Impact):
TVC:DXY (US Dollar Index) plays a key role.
Stronger dollar = bearish pressure on commodities.
📈 Indices & Risk Sentiment:
Global equities ( CAPITALCOM:US30 , SP:SPX , NASDAQ:NDX ) indirectly influence commodities via sentiment.
⚡ Energy Connection:
NSE:OIL & FX:NGAS affect input costs → higher energy = higher agro costs.
Farmers & supply chains react, impacting commodity pricing.
📊 Related Pairs to Watch
🌽 CAPITALCOM:CORN
🌾 CAPITALCOM:WHEAT
CAPITALCOM:SOYBEAN
☕ PEPPERSTONE:COFFEE
🛢️ NSE:OIL
💵 TVC:DXY
📊 CAPITALCOM:US30 / SP:SPX / NASDAQ:NDX
✨ “If you find value in my analysis, a 👍 and 🚀 boost is much appreciated — it helps me share more setups with the community!”
⚠️ Disclaimer: This is a thief-style trading strategy, designed for fun and community sharing. Not financial advice. Please trade responsibly and at your own risk.
#CORN #AgroCommodities #SwingTrade #DayTrading #TradingStrategy #LayeringStrategy #MarketAnalysis #WHEAT #SOYBEAN #COFFEE #DXY #US30 #SPX #Commodities
1000 USD: Coffee Bull Market Overview: Prices set to DOUBLE ☕ Coffee (Arabica, ICE “KC”) — Outlook to 2026
Where we are: Nearby Arabica trades ~405–410 US¢/lb after a parabolic 2025 on weather stress, thin deliverable stocks, and policy shocks. The Dec ’25 contract is ~400 ¢/lb.
Big picture 2025/26: Official global production is pegged at a record ~178.7 M bags (robusta-led) versus ~169.4 M bags consumption; ending stocks remain tight near ~22.8 M. Inside that headline, arabica is the pinch point: Brazil’s arabica is down year over year on heat/drought, and multiple private houses flag an arabica deficit on the order of ~–8.5 M bags for 2025/26.
________________________________________
🤖 1) Brazil 2025 flowering & 2026 crop execution (↑ to 9.5/10)
Why it matters: Brazil is the swing producer for arabica; 2026 outcomes hinge on Sep–Oct 2025 flowering and the trees’ carryover stress from 2024–25 dryness/frost. Local co-ops in Cerrado report frost-related damage with six-figure bag impacts to 2026 potential.
What we’re seeing: The latest national estimate cuts 2025 output to ~55.2 M bags total (arabica ~35.2 M), confirming a weaker arabica “off” year. Talk of a “super 2026” has faded unless rains arrive and stick through flowering and early fruit set.
Why 9.5/10? A missed flowering or poor fruit set is the cleanest path to a 2026 arabica shortfall big enough to rip futures.
________________________________________
🌍 2) U.S. 50% tariff on Brazilian coffee (new 9.0/10)
Why it matters: The U.S. typically imports ~8 M bags from Brazil. A 50% tariff (effective Aug 6, 2025) distorts flows, inflates U.S. landed costs, and channels more hedging into NY “KC,” structurally supporting futures. Brazil trade groups directly linked August’s vertical move to the tariff shock.
Why 9.0/10? If the tariff persists into 2026, basis stays elevated and retail prices remain sticky even if global aggregates look “adequate.”
________________________________________
🧭 3) EU Deforestation Regulation (EUDR) go-live (↑ 8.8/10)
Why it matters: Traceability/geolocation rules begin Dec 30, 2025 for large/medium operators (SMEs Jun 30, 2026). Compliance temporarily shrinks “eligible” supply and reprices differentials.
Why 8.8/10? Early-2026 could see EU-grade shortages, wider diffs, and higher KC via arbitrage.
________________________________________
📉 4) Exchange (ICE) certified stock drawdown (↑ 8.5/10)
Why it matters: Deliverable supply amplifies squeezes. Arabica certified stocks ~0.67–0.78 M bags in early September—thin for the season.
Why 8.5/10? With low float, any weather or logistics hiccup can air-pocket futures into blow-off spikes.
________________________________________
🌡️ 5) ENSO/La Niña watch & Brazil rainfall tail-risk (holds 8.0/10)
Why it matters: La Niña-skewed patterns risk ill-timed rain (flower knock-off) or too-little rain (poor fruit set) in Minas Gerais during Sep–Oct. Early September dryness was flagged; late-September storms are pivotal.
Why 8.0/10? The timing of rain matters as much as totals; a mis-timed pattern is enough to dent 2026 yields.
________________________________________
🇻🇳 6) Vietnam robusta recovery vs. water stress (↑ 7.8/10)
Why it matters: Robusta tightness forced blend shifts. A rebound toward ~31 M bags in 2025/26 would cap KC via spread relief; persistent water stress/tree fatigue would keep robusta tight, forcing arabica to carry the world.
Why 7.8/10? Binary swing factor: a real rebound cools spreads; a miss extends the squeeze into 2026.
________________________________________
🏛️ 7) Policy & trade fragmentation beyond U.S. tariffs (↑ 7.5/10)
Why it matters: Frictions and exemptions remain fluid. Retaliation or parallel measures could redirect flows to EU/Asia, move basis, and distort origin diffs.
Why 7.5/10? The tariff is already biting; add-ons would compound tightness.
________________________________________
💵 8) FX (BRL) & producer selling (↑ 7.0/10)
Why it matters: A stronger BRL curbs farmer selling; a weak BRL unleashes hedges and pressures KC. Policy/inflation noise keeps BRL volatile.
Why 7.0/10? Not first-order, but magnifies weather/policy shocks.
________________________________________
🏭 9) Demand elasticity & substitution (holds 6.8/10)
Why it matters: 2025 sticker shock clipped demand by roughly –0.5%. 2026 could stabilize if prices plateau; if retail rises further (tariffs/EUDR), more down-trading or substitution (robusta/other beverages) caps upside.
Why 6.8/10? A genuine headwind to the $10/lb path unless supply breaks further.
________________________________________
🚢 10) Logistics, certifications & differentials (new 6.5/10)
Why it matters: Tight washed/tenderable pools, evolving ICE rules/diffs, and shipping bottlenecks can widen basis and squeeze deliverables.
Why 6.5/10? Secondary, but adds fuel to any fundamental spark.
________________________________________
📈 11) Spec positioning & financial flows (↑ 6.5/10)
Why it matters: 2025’s run featured panic buying in a low-float market. Another weather scare + thin stocks invites CTA/momentum flows through round-numbers.
Why 6.5/10? Not fundamental—but can yank KC vertically.
________________________________________
🧪 12) “Record global production” optics vs. arabica reality (new 6.0/10)
Why it matters: The record headline is robusta-led. Inside, Brazil arabica declines and exporters stay cautious. The market trades the arabica bottleneck, not the aggregate.
Why 6.0/10? This optics gap sustains volatility—bulls can still win if arabica under-delivers.
________________________________________
Updated Catalyst Scorecard
Rank Catalyst Score
1 Brazil 2025 flowering → 2026 crop 9.5
2 U.S. 50% tariff on Brazil 9.0
3 EU EUDR (Dec 30, 2025 start) 8.8
4 Low ICE certified stocks 8.5
5 ENSO/La Niña rainfall risk 8.0
6 Vietnam robusta recovery risk 7.8
7 Wider trade policy fragmentation 7.5
8 FX (BRL) & selling behavior 7.0
9 Demand elasticity/substitution 6.8
10 Logistics, diffs & certification frictions 6.5
11 Spec/CTA flows 6.5
12 “Record crop” optics vs arabica bottleneck 6.0
________________________________________
📊 Supply–Demand Snapshot — Why Arabica Is the Pinch Point
• World 2025/26: Production ~178.7 M; consumption ~169.4 M; ending stocks ~22.8 M (still lean).
• Brazil arabica: ~40.9 M (down ~2.8 M YoY); robusta records elsewhere (Brazil/Indonesia); Vietnam recovery penciled near 31 M.
• Private balance: Arabica deficit ~–8.5 M for 2025/26 (vs ~–5.5 M in 2024/25).
• ICE plumbing: Certified arabica ~0.67–0.78 M bags and trending lower → thin deliverables, higher tail-risk premia.
________________________________________
🔍 Recent Headlines You Should Know
• KC spiked toward/above $4/lb in early 2025 on panic buying, weather, and policy shocks.
• “Record global crop” headlines coexist with lower Brazil arabica and tight ending stocks.
• U.S. 50% Brazil tariff (Aug 6, 2025) credited with a ~30% surge in August.
• EUDR deferred to Dec 30, 2025 for large/medium operators; compliance scramble into 1H26.
• Early-Sep 2025 Minas dryness kept flowering risk live; markets watching late-Sep showers.
________________________________________
🎯 Street & Agency Views (as of Sep 2025)
• Early-2025 consensus had end-2025 ~$2.95/lb, expecting mean reversion. The market disagreed post-tariffs.
• One multilateral outlook saw >50% y/y up in 2025, then –15% in 2026, assuming supply normalization and Colombia recovery.
• Several trade houses continue to highlight a widening arabica deficit into 2025/26.
Takeaway: Consensus expects some 2026 cooling, but policy + compliance + arabica weather can overwhelm “aggregate surplus” narratives.
________________________________________
🧭 Pathways to 1,000 ¢/lb in 2026 (Aggressive Target)
We’re already near 400 ¢. To reach $10/lb, the market needs a stack of arabica-specific shocks that persist into 2026:
1. Brazil under-delivers in 2026: Patchy/failed flowering (Sep–Oct ’25) and/or heat during fruit set reduce yields; 2026 arabica ≤ ~38–40 M.
2. Tariffs persist through 2026: U.S. 50% duty remains in force, lifting U.S. basis and rerouting flows; fewer tenderable lots into ICE.
3. EUDR friction bites in 1H26: Non-compliant lots stranded; compliant premiums surge; differentials widen and pull KC higher.
4. Certified stocks < ~500k bags: Roaster drawdown + limited grading/tendering triggers backwardation and squeeze mechanics.
5. Vietnam misses rebound: Water stress or tree fatigue keeps robusta tight; arabica must carry blends globally.
6. Pro-cyclical flows: Thin deliverables + headlines = momentum/CTA accelerants through round numbers (500 → 700 → 900 → 1,000).
Probability assessment: Not the base case, but plausible if two or more of (1–4) coincide while financial flows amplify. Call it ~20–25% conditional on Q4’25 weather and policy staying restrictive.
________________________________________
🧮 Scenario Framework (NY Arabica, nearby; end-2026)
• Bull (30%) — Squeeze: Brazil 2026 < 40 M; tariff persists; EUDR tight; certifieds < 0.5 M; Vietnam under-shoots.
Price: 800–1,000 ¢/lb (blow-off spikes possible above 1,000 on transient squeezes).
• Base (50%) — Elevated & volatile: Brazil 2026 ~41–44 M; tariff partially eased or offset; EUDR frictions fade by 2H26; Vietnam rebounds.
Price: 450–650 ¢/lb with episodic spikes on weather or logistics.
• Bear (20%) — Normalization: Strong Brazil flowering → 2026 ≥ 45 M; tariff rolled back; EUDR compliance smoother; certifieds rebuild > 1.2 M; demand softens.
Price: 280–420 ¢/lb (vol still above pre-2024 norms).
________________________________________
🗓️ Watchlist & Timeline (what to track)
• Sep–Oct 2025: Brazil flowering windows (Minas/Cerrado/N. São Paulo). Look for rain onset, follow-up, and heat bursts.
• Nov–Dec 2025: Fruit set confirmation; disease incidence; updated 2026 potential.
• Dec 30, 2025: EUDR go-live (large/medium operators).
• Q1–Q2 2026: Compliance bottlenecks, EU diffs, tenderable quality flows into ICE.
• All 2025/26: Tariff status, BRL swings, certified stock trajectory, Vietnam water/harvest updates.
________________________________________
⚠️ Risk Matrix (what flips the call bearish)
• Timely rains in Sep–Oct 2025 and mild temps → robust fruit set; Brazil 2026 ≥ 45 M.
• Tariff rollback or broad exemptions reduce U.S. basis support.
• Vietnam outperform (> 31 M) relieves spreads; Indonesia robusta stays strong.
• Certified stocks rebuild > 1.2 M bags by mid-2026.
• Demand destruction accelerates (retail fatigue, substitution), capping upside.
________________________________________
📌 Positioning Lens (informational, not advice)
• Drivers of upside convexity: Brazil weather into October, policy stickiness (tariff/EUDR), and certified stock path.
• Tell-tales of a squeeze: Steepening backwardation, diffs blowing out for compliant washeds, and rapid certified draw alongside rising exchange open interest.
• Tell-tales of normalization: Strong flowering reports, improved grading pass-rates, certified rebuilds, and easing EU compliance premia.
________________________________________
Bottom Line
• The base case remains elevated and volatile into 2026, not automatic mean reversion.
• A credible path to 1,000 ¢/lb exists if Brazil’s 2026 arabica disappoints, policy frictions persist, EUDR pins EU-grade supply, and certifieds fall sub-0.5 M, with CTA flows doing the rest.
• Conversely, timely Brazil rains, tariff relief, and a clean EUDR transition cap the rally and pull prices toward the high-$3s/low-$4s.

Analysis Techniques – Arabica Coffee Futures (Dec 2025)Analysis Techniques – Arabica Coffee Futures (Dec 2025)
Date: October 23, 2025 | Timeframe: D1 | Contract Code: ICEUS KCZ25
1. Trend Overview and Price Structure
December 2025 Arabica coffee futures continued to rally strongly, up +2.18% to 423.95 cents/lb, marking the sixth consecutive session of gains and returning to the highest level since early May 2025.
The current technical setup shows clear bullish momentum following a two-week consolidation between 380–400 cents.
If momentum persists, prices could advance toward the strategic resistance zone at 450 cents/lb, corresponding to the March 2025 swing high.
Short-term trend: Strongly bullish – continuing wave (3) within a broader recovery cycle.
2. Key Technical Price Levels
Resistance: 424 – 450 – 480
Support: 388 – 351 – 316
3. Detailed Technical Analysis
(1) Short-Term Trend:
Price has broken above the 400–410 resistance zone and is now aiming for the 450 target area.
A clear horizontal accumulation breakout pattern has formed, signaling that buyers are fully in control of the market.
(2) Trading Volume:
Volume has expanded alongside rising prices over the past week, confirming renewed speculative and commercial participation.
Managed money funds are likely rebuilding net-long positions after September’s liquidation phase.
(3) Wave Structure:
According to Elliott Wave Theory, Arabica is in wave (3) of a bullish sequence that began from the 316.50 low in July 2025.
Wave (1): 316 → 388
Wave (2): correction to 351
Wave (3): currently targeting 450–455, the 161.8% Fibonacci extension.
(4) Confirmation Signals:
Price broke above the accumulation range with long-bodied bullish candles, showing no signs of distribution.
Short-term EMAs (12–36) are expanding upward, confirming strong momentum.
Breakout volume exceeded the 20-session average, validating the move.
4. Strategic View – VNC
According to Bloomberg Intelligence, Arabica’s sharp rally through October has been driven by three fundamental catalysts:
1. Short-Term Supply Tightness in Brazil:
September exports fell nearly 11% year-on-year, as dry weather slowed harvest progress.
ICE-certified stocks dropped sharply, reaching the lowest level in 18 months.
2. Renewed Speculative Flows:
Commodity funds have rotated back into soft commodities (coffee, cocoa, sugar) as the energy complex corrected.
The Arabica-to-Robusta net-long ratio has risen to 1.4x, its highest since April.
3. Stable Consumption Demand:
Roasters in Europe and the U.S. have increased stockpiling ahead of the winter season.
The slightly weaker Brazilian real (5.52 BRL/USD) has discouraged farmer selling, tightening near-term supply.
VNC expects bullish momentum to persist in the short term, with 450 cents/lb as a medium-term target. However, profit-taking or a rebound in the real could trigger corrective pullbacks near 460–470 cents/lb.
5. Suggested Technical Strategies
Primary Long Scenario (Trend-Following):
Entry: 415 – 420
TP1: 450
TP2: 465
SL: 404
Probability: 75%
Risk/Reward Ratio: ~1:2.8
Alternative Short Scenario (Rejection at 450 Resistance):
Entry: 448 – 452
TP: 388
SL: 460
Probability: 25%
Risk/Reward Ratio: ~1:3
6. Corporate Hedging Strategies
For Arabica Exporters (Brazil, Colombia):
Increase forward price fixation around 440–450 cents/lb, as prices approach strong resistance.
Utilize options collars to protect profit margins in case of a near-term correction.
For Importers and Roasters (EU, U.S., Vietnam):
Consider early hedging in the 400–420 zone to lock in costs before a potential breakout above 450.
If prices reach 450–460, consider unwinding older hedges to maintain a neutral exposure.
For Commercial Traders:
Maintain medium-term long positions, targeting 450–455 for partial profit-taking.
A confirmed breakout above this zone could open the path toward 480–500 cents/lb.

CORN Bulls in Control? Retest Pullback Confirms Trend Bias🌽 CORN Institutional Edge Plan (Swing/Day Trade Setup)
🔍 Market Context
CORN (CFD on US Corn Futures) is showing signs of bullish momentum after testing a key resistance area. Institutional order flow hints at accumulation in the mid-420s region — a potential pullback zone before continuation higher.
🧭 Thief Strategy Plan — Layered Entries
This setup follows the “Thief Strategy”, a layered entry approach using multiple buy limit orders to capture volatility and improve average entry cost.
📈 Layered Buy Zones:
1️⃣ 428
2️⃣ 430
3️⃣ 432
(Traders may extend layers based on risk appetite and confirmation signals.)
🛑 Protective Stop (Thief SL): Around 424
🎯 Profit Zone (Thief TP): Around 445
🧠 Plan Insight
Expecting a resistance retest pullback to confirm the bullish structure.
Momentum aligns with higher-timeframe bias after institutional demand emerged near 420s.
Targets align with overbought resistance and prior liquidity traps — best to secure profits and protect gains as price nears 445.
💡 Note: Each trader should manage risk independently. This setup is educational only — showing how to structure a layered “Thief-style” plan, not a recommendation to buy/sell.
🔗 Correlated Assets to Watch
OANDA:WHEATUSD – Often mirrors agricultural flow shifts.
$SOYBEANUSD – Moves inversely at times; watch for divergence.
TVC:DXY – A stronger dollar can pressure commodity prices.
OANDA:SPX500USD – Risk appetite correlation; strong equities can support commodity demand.
🕵️♂️ Thief’s Key Notes
Dear Ladies & Gentlemen (Thief OG’s) — this plan shows how I structure entries, not where you should trade.
You can make money — then take money — at your own risk.
Manage your own stop-loss, target, and position sizing like a pro.
✨ “If you find value in my analysis, a 👍 and 🚀 boost is much appreciated — it helps me share more setups with the community!”
📜 Disclaimer:
This is a Thief-style trading strategy created just for fun and educational purposes.
Not financial advice. Trade responsibly.
#CORN #Commodities #Futures #InstitutionalTrading #SwingTrade #DayTrading #LayeredEntries #ThiefStrategy #SmartMoney #PriceAction #CommodityMarket #Agriculture #DXY #WHEAT #SOYBEAN #TradingView #ThiefTrader

Sugar Down In DiwaliInspite of real estate, automobile and banking sector showing an uptrend, which are all related to the festive season of Diwali, only sugar has been left behind.
Balrampur chini has markdly underperformed in the last 3 months, down by 25%

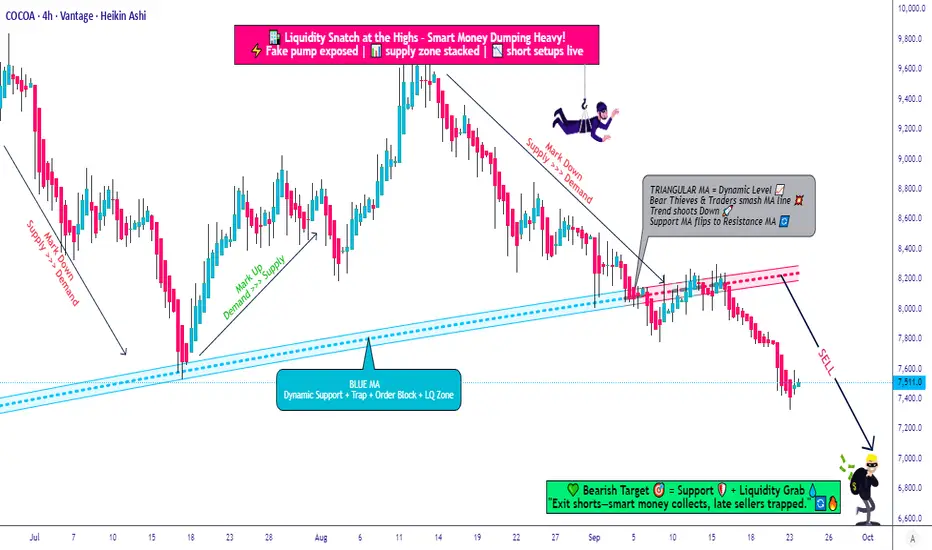
Cocoa CFD Technical Playbook | Downside Targets in Focus😎 Cocoa Crash Caper: Thief-Style Swing/Day Trade Setup 🍫📉
Asset: Cocoa Commodities CFD
Market Strategy: Wealth Thief Map (Swing/Day Trade)
Outlook: Bearish 🐻 — Sellers smashed through the Triangular Moving Average (TMA 1786), confirming the downtrend! 🚨
📜 The Grand Heist Plan
🎯 Entry: Deploy the Thief Layering Strategy with multiple sell limit orders to snatch profits like a pro!
Suggested layers:
💰 8000
💰 7800
💰 7600
💰 7500
Pro Tip: Feel free to add more layers based on your risk appetite — stack those orders like a master thief!
🕵️♂️ Alternatively, enter at any price level if you’re feeling bold!
🛑 Stop Loss: Set at 8200. Dear Thief OG’s 👑, this is my suggested SL, but it’s your heist — adjust it to your risk tolerance!
🎯 Target: Aim for 6800, where strong support, oversold conditions, and a potential trap await! 🕳️ Escape with your profits before the market pulls a fast one!
Note: This is my TP suggestion — take profits at your own discretion, you sly foxes! 🦊
🧠 Why This Setup?
The Cocoa market is screaming bearish vibes after sellers bulldozed the 1786 TMA . 📉 The trend is confirmed, and the momentum is on our side. With the Thief Layering Strategy, we’re setting up multiple sell limit orders to capitalize on this downward spiral while managing risk like seasoned bandits. 💸
🔗 Related Pairs to Watch ($ Correlated Assets)
Keep an eye on these correlated markets for extra clues:
Coffee ( PEPPERSTONE:COFFEE ): Often moves in tandem with Cocoa due to shared agricultural market dynamics. Watch for similar bearish signals! ☕
Sugar ( PEPPERSTONE:SUGAR ): Another soft commodity that can reflect broader agricultural trends. Check for parallel price action. 🍬
USD Index ( TVC:DXY ): A stronger USD can pressure commodity prices, including Cocoa. Monitor for correlation with Cocoa’s decline. 💵
Key Correlation Point: Cocoa prices often weaken when the USD strengthens, as commodities are priced in USD. A rising TVC:DXY could amplify this bearish setup, so keep tabs on it! 📊
⚠️ Disclaimer
This Thief-Style Trading Strategy is just for fun and educational purposes! Trading is risky, and you’re the master of your own heist. Always do your own research and manage your risk responsibly. No financial advice here — just a playful setup to spark your trading creativity! 😜
✨ “If you find value in my analysis, a 👍 and 🚀 boost is much appreciated — it helps me share more setups with the community!”
#TradingView #Cocoa #ThiefStrategy #SwingTrading #DayTrading #Bearish #Commodities #TechnicalAnalysis
Bioceres Crop Solutions | BIOX | Long at $1.43Technical Analysis
Bioceres Crop Solutions NASDAQ:BIOX has entered my selected "crash" simple moving average. This area is often a zone of share accumulation and may result in a trend reversal (or a short-term stair-step down to $1 or lower before trading sideways).
Growth, Fundamentals, & Health
Not expected to become profitable again until 2028.
Earnings-per-shares growth from 2026 (-$0.26) to 2028 ($0.56): +323%
Revenue growth from 2026 ($350 million) to 2028 ($511 million): +46%
Current Fair Value: $5
Debt-to-Equity: 0.9x (very good / healthy)
Altman's Z-Score/Bankruptcy Risk: .9 (high risk, some financial distress)
Action
75% technical analysis play and only 25% based on company fundamentals. The only major risk based on the data is bankruptcy. The near-term could be rough for the company, but the outlook into 2028 shows significant growth. Thus, at $1.43, NASDAQ:BIOX is in a personal buy zone. There could be near-term risk near $1 or a bit lower, but this one is a total gamble. Time will tell.
Targets into 2028
$2.00 (+39.9%)
$4.00 (+179.7%)

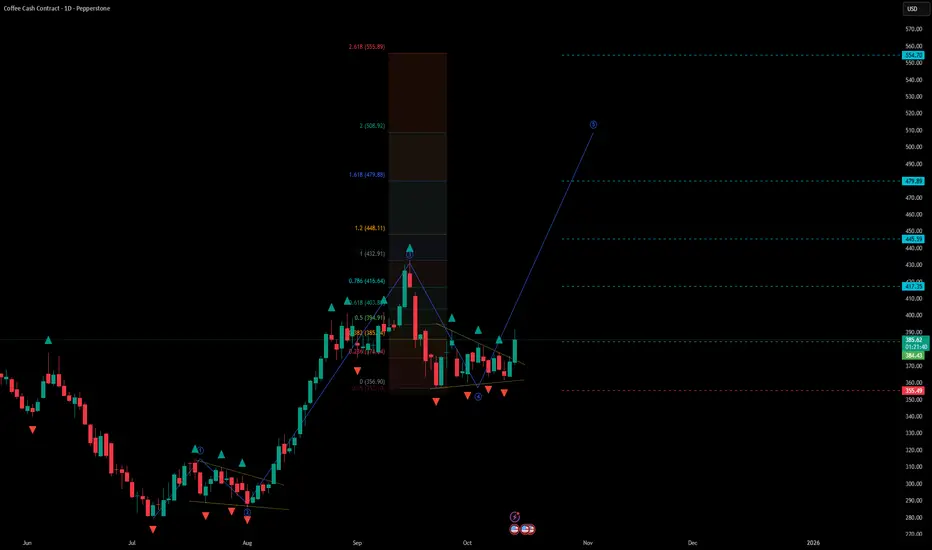
#Coffee – Triangle Formation#Coffee (D1) – Triangle Formation & Potential Wave 5 Extension
Current price: $386.4
Coffee futures are developing a triangle continuation pattern, signaling possible breakout toward the next impulsive wave — likely wave 5 within the broader bullish sequence.
🧩 Technical Context
• The market completed a clean 1–2–3–4 wave sequence since the August low (~$330).
• Current structure consolidates inside a symmetrical triangle, typical before a wave 5 breakout.
• The pattern is forming above key supports, confirming mid-term bullish bias.
📈 Wave 5 Projection
• Potential breakout direction: upward continuation
• Stop-loss: below wave 4 low (~$355)
• Fibonacci-based upside projections:
– 0.786 Fib → $416
– 1.0 Fib → $432
– 1.2 Fib → $448
– 1.618 Fib → $480
– 2.0 Fib → $508
– 2.618 Fib → $556
Expected wave 5 may extend toward $480–$500 if breakout confirms with volume.
🧭 Summary
• D1 structure indicates triangle consolidation in a bullish trend.
• Breakout above $390 would confirm the start of wave 5.
• Stop remains below the wave 4 low (~$355) to protect against false breaks.
• Momentum and volume confirmation are key for trend continuation.
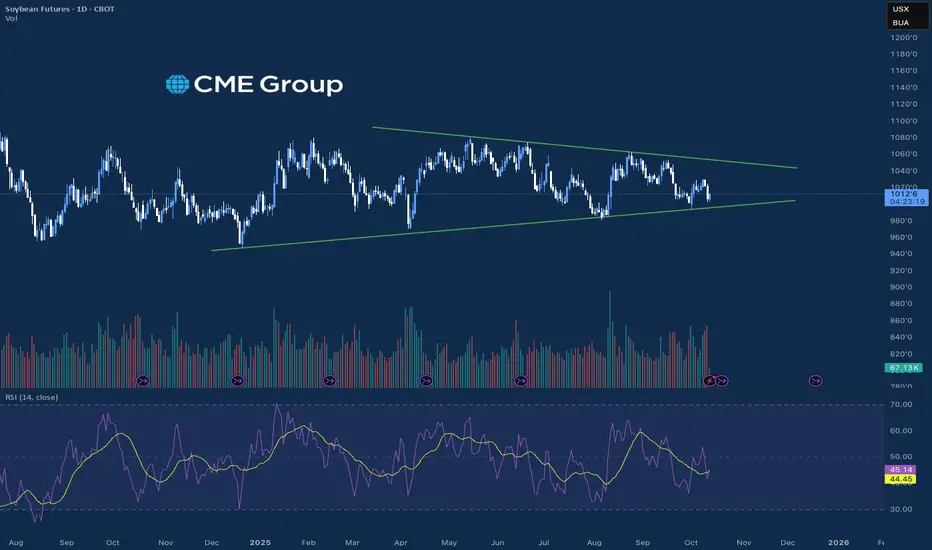
What's Next for Soybeans?The soybean market over the last four weeks has been volatile, largely driven by a combination of geopolitical tensions, U.S. harvest developments, and South American weather. The market has seen consolidation within a range where it seems to be carving out higher lows and may be on track for prices to rise. The 50-day and 200-day moving average are right in line with each other on this daily chart and the market saw selling pressure from these levels in the recent down move. Futures prices generally remain under pressure from large supply estimates but see spikes and drops based on daily news.
Most recently, prices have seen a sharp downturn, especially heading into the second week of October, with November soybean futures dropping significantly on fears of escalating U.S.-China trade tensions. The ongoing trade war has severely impacted U.S. soybean exports, as China (the world's largest buyer) has largely avoided new crop purchases. News and rhetoric regarding trade talks, including discussions of a potential meeting between the U.S. and Chinese leaders, have caused significant price swings.
The U.S. harvest is underway, and while some initial reports suggested yields slightly below the most recent USDA forecasts, the overall projected supply remains high, which is a bearish factor. However, logistical issues, such as critically low water levels on the Ohio and Mississippi Rivers, are raising concerns about the ability to move the massive crop, potentially firming the cash basis in some areas.
Favorable weather for planting in Brazil and recovery from past drought conditions in Argentina are contributing to the expectation of large future global supplies, which puts long-term pressure on prices. Along with that, a U.S. government shutdown led to a postponement of key reports, such as the USDA's monthly WASDE report, leaving traders with less official information and relying more on private estimates and harvest reports.
*CME Group futures are not suitable for all investors and involve the risk of loss. Copyright © 2023 CME Group Inc.
**All examples in this report are hypothetical interpretations of situations and are used for explanation purposes only. The views in this report reflect solely those of the author and not necessarily those of CME Group or its affiliated institutions. This report and the information herein should not be considered investment advice or the results of actual market experience.
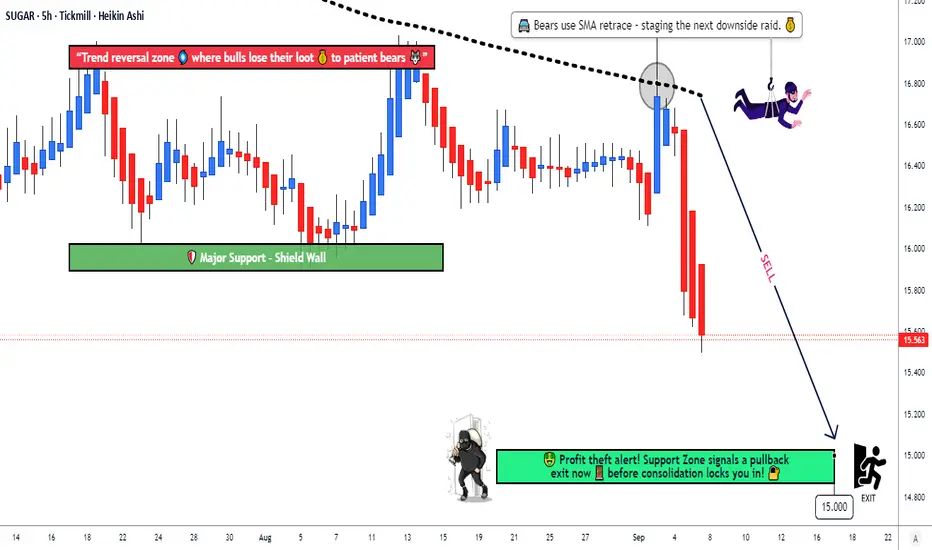
Is This the Perfect Short Entry in Sugar RAW? Check the Plan!🏴☠️ Thief OG’s Sugar RAW CFD Money Making Plan 💰 (Swing/Day Trade)
Asset: SUGAR RAW Commodities CFD
Plan: Bearish Plan confirmed with 200 SMA rejection of bulls + seller pressure on the downside
⚡ Trade Setup – Thief Strategy Style
Entry: Use Thief layering strategy with multiple limit orders:
Example: 16.000 / 15.800 / 15.600 / 16.100
💡 You can increase limit layers based on your own plan.
Stop Loss: Thief SL @16.400 ❌
Adjust based on your strategy & risk appetite.
Target: Support + oversold + market reversal trap → Target @15.000 🎯
Note: Take profits at your discretion — “stolen money” is yours to keep 💵
🔍 Why This Plan? – Thief Technical + Macro Analysis (SEPTEMBER 05)
Thief Technical Plan:
Bearish trend confirmed via 200 SMA rejection 📉
Multiple layer entries to optimize risk/reward ⚡
Market traps and reversal zones accounted for 🕵️♂️
Fundamental & Macro Insights:
Fundamental Score: 6/10
✅ Record global production: 189.3M MT (Brazil & Thailand)
❌ Surplus of 7.5M MT pressuring prices
⚠️ Logistical bottlenecks & ethanol competition affecting supply
Macro Score: 5/10
📉 Weak global demand amid slowdown
🌎 Geopolitical tensions affecting trade flows
💵 Strong USD capping gains
Investor Sentiment:
Retail Traders: Bullish 45% 🐂 / Bearish 55% 🐻
Institutional Traders: Bullish 35% 🐂 / Bearish 65% 🐻
Fear & Greed Index:
Current Level: 40/100 😨 Neutral → slight fear
Mood: Cautious due to oversupply
Overall Market Outlook: Bearish 📉
Oversupply + weak demand + macro headwinds outweigh emerging market demand potential
🔗 Related Pairs to Watch:
$COFFEEUSD ☕
$COTTONUSD 🧵
OANDA:SUGARUSD 🍬
“If you find value in my analysis, a 👍 and 🚀 boost is much appreciated — it helps me share more setups with the community!”
#SugarCFD #CommoditiesTrading #ThiefStrategy #BearishPlan #SwingTrade #DayTrade #CryptoCommodities #ForexCFD #MarketAnalysis #TradingViewIdeas #TraderOG
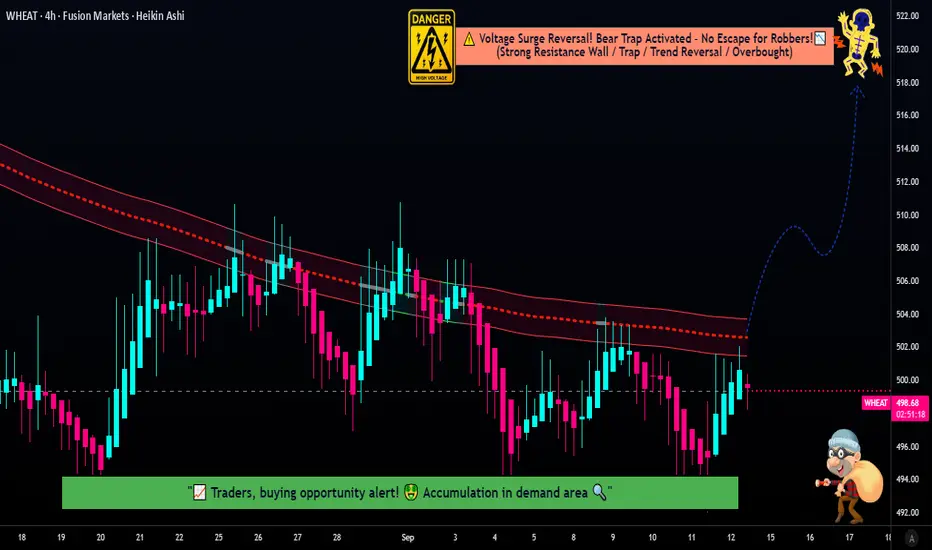
Wheat Market Outlook – Fundamentals, Sentiment, and Key RisksTitle: 🌾 WHEAT CFD: The "Money Looting" Thief Plan (Bullish Breakout Setup) ⚡🤑
Executive Thief Summary 🦹
Ladies & Gentleman, Thief OG's! 👋 Ready to execute a precision heist on the Wheat markets? This plan uses a layered entry strategy (a.k.a. The Thief Strategy) to loot some profits from a potential bullish breakout. We're stacking limit orders like cash stacks and making a clean escape before resistance shows up. Alarm bells are ringing! 🔔
📈 The Technical Thief Plan (Swing/Day Trade)
Asset: CAPITALCOM:WHEAT (Wheat CFD)
Bias: Bullish ⬆️
Trigger: A breakout and close above 504 on the LSMA Moving Average.
🎯 Entry Strategy (The "Thief" Layering Method):
Step 1: SET AN ALARM at 504 to notify you the moment the breakout happens!
Step 2: Upon confirmation of the breakout, deploy multiple BUY LIMIT orders on any pullback at the following layers:
Layer 1: @ 502
Layer 2: @ 500
Layer 3: @ 498
Layer 4: @ 496
Pro Thief Tip: You can add or adjust these layers based on your capital and risk appetite. The goal is to get a better average entry price.
⛔ Stop Loss (Escape Route):
A collective Stop Loss can be placed at 493, ideally after the breakout and a pullback into your layers occurs.
⚠️ Disclaimer: Dear Thief OG's, I am not a financial advisor. You MUST adjust your SL based on your own strategy and risk tolerance. Protect your capital!
✅ Take Profit (The Getaway Car):
Our primary target to escape with the stolen money is at 520, a strong resistance zone where overbought conditions and traps may lurk.
⚠️ Disclaimer: This is MY plan. You are the master thief of your own trade. Take profits based on your own analysis and risk management. Run when you've got the bag! 💰
🔍 Why This Plan? The Fundamental Intel
This isn't just a technical play; the macro backdrop provides a compelling narrative for a potential move north.
🌍 Fundamental & Macro Score: 5.5/10 (Stable but Vulnerable)
Supply/Demand (6/10): Production is steady (EU & Russia with big crops), but record utilization and booming feed demand in Brazil/EU are supportive. US exports are forecast at a multi-year high.
Macro Factors (5/10): Black Sea geopolitical tensions add a risk premium. Strong global trade offsets ample stocks. Inflation and potential Fed cuts support commodities, though China's import cuts are a headwind.
😊📊 Trader Sentiment Outlook (Mixed but Leaning Cautious)
Retail: 38% Bullish 🟢 | 62% Bearish 🔴 (Cautious due to recent dips)
Institutional: 45% Bullish 🟢 | 55% Bearish 🔴 (Slightly more optimistic on export recovery)
The crowd is cautious, which can often be a contrarian signal for opportunities.
⚖️😨 Fear & Greed Gauge: Neutral (45/100)
Balanced between fear of abundant production and greed from tightening global stocks. Weather concerns in Europe/US and strong Asian demand are key drivers. No extreme emotions mean room for a sentiment shift.
🚀 Overall Market Outlook: Mild Bull (Long) 🟢
Expect gradual upside in H2 2025 from declining global stocks and solid demand. The trigger for a rally could be disappointing Russian yields or an acceleration in exports. Avoid shorts below $500 support.
👀 Related Pairs/Assets to Watch
CAPITALCOM:CORN (Corn CFD)
CAPITALCOM:SOYBEAN (Soybean CFD)
FX: FX_IDC:USDRUB (US Dollar/Russian Ruble - for Black Sea export risk)
TVC:DXY (US Dollar Index)
✨ “If you find value in my analysis, a 👍 and 🚀 boost is much appreciated — it helps me share more setups with the community!”
#Wheat #Trading #Commodities #CFD #TradingStrategy #Breakout #Bullish #SwingTrading #DayTrading #TechnicalAnalysis #FundamentalAnalysis #TradingViewIdea #Investing #SupplyDemand
Agro Commodity Watch: Soybean Sets Stage for Bullish Expansion🏦💰 SOYBEAN HEIST: The Cash Flow Caper! | SOYBEAN/USD Strategic Entry Plan
🎯 THE SETUP: Agricultural Gold Rush Edition
Market: SOYBEAN vs USD (Agro Commodity - Cash Flow Management Strategy)
Trading Style: Swing/Day Trade Hybrid
Mission Status: 🟢 BULLISH BIAS ACTIVATED
📊 THE MASTER PLAN: Triangular Moving Average Breakout Strategy
🚀 Entry Conditions:
Wait for the Triangular Moving Average (TMA) breach to the upside — this confirms our bullish trend validation! Once we see that clean break above resistance, we're ready to "acquire our positions" strategically.
⚠️ CRITICAL: Set price alerts on your trading platform to catch the breakout in real-time!
💎 Layered Entry Zones (Scaling In Like Pros):
Strategic accumulation levels for risk management:
Layer 1: $10.050 🎯
Layer 2: $10.100 🎯
Layer 3: $10.150 🎯
Layer 4: $10.200 🎯
Pro Tip: You can choose ANY price level entry after the breakout confirmation — these layers simply optimize your average cost basis!
🛡️ RISK MANAGEMENT PROTOCOL
⛔ Stop Loss Zone: $10.000
Important Disclaimer: This is MY personal risk tolerance level. As traders, YOU must determine your own risk appetite and stop-loss placement. Trade at your own risk and only risk capital you can afford to lose!
🎯 PROFIT EXTRACTION TARGET
💰 Primary Target: $10.400
The "Police Barricade" Analysis:
This zone presents multiple confluences:
🔴 Strong resistance acting as psychological barrier
📉 Oversold conditions may trigger reversals
Potential bull trap zone — time to secure profits!
Exit Strategy: Consider scaling out positions as we approach $10.400. Don't get greedy — secure gains incrementally!
Important Note: This target is MY analysis. YOUR profit-taking strategy should align with your personal trading plan and risk management rules. Always secure profits at YOUR comfort levels!
🌾 RELATED AGRICULTURAL COMMODITIES TO MONITOR
Watch these correlated markets for confirmation signals:
CORN ( CBOT:ZC1! ) 🌽 - Direct grain market correlation, often moves in tandem with soybean fundamentals
WHEAT ( CBOT:ZW1! ) 🌾 - Grain sector sentiment indicator, affects overall agricultural commodity flows
SOYBEAN MEAL ( CBOT:ZM1! ) 📦 - Derivative product, reflects processing demand and crush spreads
SOYBEAN OIL ( CBOT:ZL1! ) 🛢️ - Key byproduct, influenced by biodiesel and cooking oil demand
DBA (Invesco DB Agriculture ETF) 💵 - Broad agricultural sector strength gauge
Dollar Pairs for Macro Context:
DXY (US Dollar Index) 💵 - Inverse correlation: weaker USD = stronger commodity prices
DX1! (Dollar Futures) - Real-time currency strength affecting agricultural export competitiveness
Key Correlation: Soybeans typically exhibit negative correlation with USD strength. Monitor the Dollar Index for macro tailwinds supporting our bullish thesis!
🔑 KEY TECHNICAL CONFLUENCES
✅ Triangular Moving Average breakout confirmation
✅ Multi-layered entry approach minimizes timing risk
✅ Clear risk-defined stop loss below psychological support
✅ Target aligned with technical resistance + overbought zones
✅ USD weakness could provide fundamental tailwinds
Risk Warning: Commodity futures and options trading carries significant risk and may not be suitable for all investors. You could lose more than your initial investment.
"Thief Style" Context: The playful "heist" terminology is purely thematic storytelling to make technical analysis engaging — it does NOT encourage or endorse any illegal activities or unethical trading practices. All strategies discussed involve legitimate, legal market participation.
📣 COMMUNITY ENGAGEMENT
✨ If you find value in my analysis, a 👍 and 🚀 boost is much appreciated — it helps me share more setups with the community!
#SOYBEAN #Commodities #AgricultureTrading #SwingTrading #DayTrading #TechnicalAnalysis #PriceAction #BreakoutStrategy #CashFlow #RiskManagement #TradingSetup #FuturesTrading #GrainMarkets #USD #ForexCorrelation #MovingAverages #SupportAndResistance #TradingPlan #MarketAnalysis #CommodityFutures

COFFEE | HMA Support Holds | Bullish Breakout Imminent🎯 COFFEE CFD: The Double-Bottom Espresso Shot Setup ☕💰
📊 Market Overview
Asset: COFFEE (Commodities CFD)
Strategy Type: Swing/Day Trade - Cash Flow Management
Bias: 🟢 BULLISH
Timeframe: 2h
🔍 The Setup - Why This Brew is About to Percolate
Alright coffee addicts and chart nerds, let's break down this caffeinated opportunity! ☕⚡
Technical Confirmation:
🎯 Hull Moving Average (HMA) is acting as our dynamic support level
📍 Double Bottom Formation confirmed after price retested the HMA support TWICE
🔥 Buyers stepped in aggressively at the dynamic support zone, confirming bullish momentum
📈 The trend reversal is LOCKED IN - bulls are taking control
This isn't your average coffee break setup - we've got a textbook double-bottom pattern forming right on our dynamic HMA support. Price knocked twice, buyers answered both times. You know what that means? It's go time! 🚀
💎 Entry Strategy - The "Thief" Layered Approach
Primary Entry Signal:
✅ Breakout Confirmation: Wait for price to breach and CLOSE above @385 resistance zone
⚠️ IMPORTANT: Set your price alerts at 385 on your trading platform so you don't miss this breakout! TradingView, MT4, MT5 - whatever you use, SET THAT ALARM! ⏰
🎯 Layered Entry Zones (Scaling In):
This is the "Thief OG" method - you can choose ANY of these levels post-breakout:
Layer 1: 360
Layer 2: 365
Layer 3: 370
Layer 4: 375
Layer 5: 380
Pro Tip: You don't have to enter all at once! Scale in as price confirms momentum. Buy the dip, catch the rip! 🎢
🛑 Risk Management
Stop Loss: @350
Risk-Reward Ratio: Approximately 1:2 (Solid setup! 💪)
📢 Disclaimer Note:
Dear Ladies & Gentlemen (Thief OG's) - This SL is MY personal level. YOU control YOUR money, YOUR risk. Adjust according to your account size and risk tolerance. Trade smart, not hard! 🧠💰
🎯 Profit Targets - Know When to Take Your Coffee to Go
Target Zone: @420 🎯
Why 420?
Strong historical resistance level
Overbought conditions likely
Potential bull trap zone - don't get greedy!
💡 Strategy: Scale OUT just like you scaled IN. Take profits along the way. Lock in gains before the market locks YOU out! 🔒💵
📢 Disclaimer Note:
Dear Ladies & Gentlemen (Thief OG's) - This TP is MY personal target. YOU control YOUR profits. If you're in the green, secure your bag at your own discretion. Nobody ever went broke taking profits! 💰✨
📈 Correlated Pairs to Watch
Keep an eye on these related markets - they move together like coffee and cream ☕🥛
PEPPERSTONE:SUGAR (SB1!) - Commodity correlation
ASX:BRL (Brazilian Real) - Brazil = #1 coffee producer, currency strength matters
PEPPERSTONE:COCOA (CC1!) - Soft commodities sector correlation
DXY (US Dollar Index) - Inverse relationship; weaker dollar = stronger commodities
Key Point: If sugar and cocoa are rallying, coffee usually follows the party! Also, watch weather reports from Brazil - drought conditions = bullish coffee prices. ☀️🌧️
⚡ Key Takeaways
✅ Double-bottom pattern confirmed on HMA dynamic support
✅ Bullish momentum building
✅ Wait for 385 breakout confirmation
✅ Layer entries between 360-380
✅ Manage risk with SL @350
✅ Secure profits near 420 resistance
✅ Watch correlated pairs for confirmation
🎭 The "Thief Style" Philosophy
This is the Thief OG strategy - we steal opportunities from the market like a caffeinated ninja!
This analysis is for educational and entertainment purposes. We're here to learn, laugh, and hopefully make some money along the way!
Remember: The market doesn't care about your feelings. Stick to YOUR plan, manage YOUR risk, and protect YOUR capital. This is a game of probabilities, not certainties!
✨ If you find value in my analysis, a 👍 and 🚀 boost is much appreciated — it helps me share more setups with the community!
#Coffee #CommoditiesTrading #CFDTrading #SwingTrading #DayTrading #TechnicalAnalysis #DoubleBottom #HullMovingAverage #HMA #Breakout #BullishSetup #TradingStrategy #PriceAction #SupportAndResistance #RiskManagement #ThiefStyle #CoffeeMarket #CommodityTrading #TradingIdeas #ChartAnalysis #ForexCorrelation #SoftCommodities

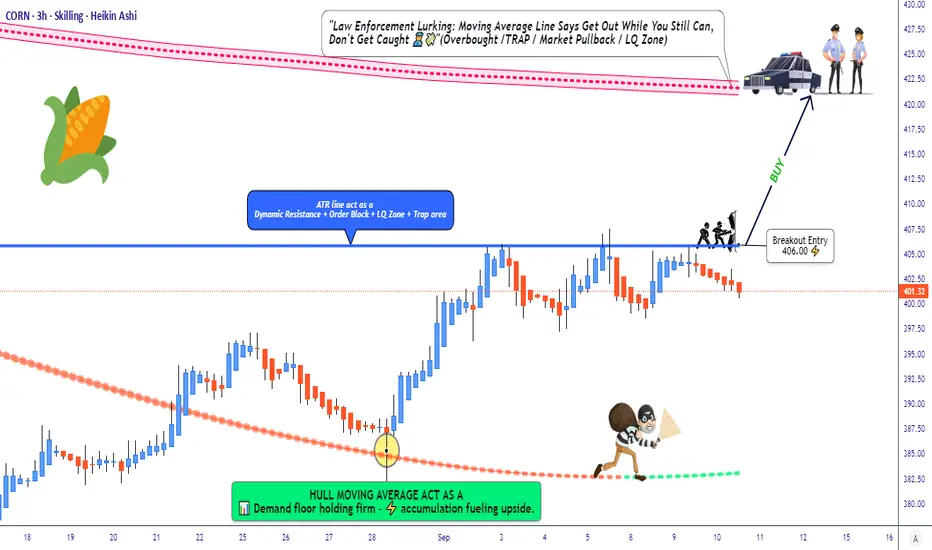
CORN Setup: Is This The Bullish Breakout We've Been Waiting For?🌽 CORN CFD | Money Heist Plan 🎭 (Swing / Day Trade)
🔑 Trading Plan (Thief Style Strategy)
Entry (Breakout Trigger): 📈 406.00 — when candle breaks ATR resistance, bullish plan activates.
Layering Entries (Thief Method):
Buy Limit Layers: 400.0 | 402.0 | 405.0 | 407.0 | 410.0 (flexible — adjust/add more based on breakout confirmation).
Layering helps manage entries & average position smartly.
Stop Loss (Thief’s Safety Lock): @ 395.00 🛑 after breakout trigger.
⚠️ Adjust SL based on your own risk tolerance.
Target (Escape Point): 🎯 421.00
Resistance zone + overbought condition = “police barricade” (take profits before getting trapped).
🌍 Why This Plan? | Thief Technical + Macro/Fundamental Mix
📊 Technical Edge
ATR breakout level at 406.00 ⚡
Momentum build-up near resistance, potential squeeze if volume spikes.
Layered entries provide risk-managed exposure.
🌽 CORN Market Data (10 Sep 2025)
Daily Change: -1.05% 🔴
Monthly Performance: +3.13% 🟢
Yearly Performance: -1.90% 🔴
👥 Investor Sentiment
Retail: 45% Long 😊 | 55% Short 😟 (slightly bearish bias).
Institutions: Net short 91,487 contracts 🏦 (hedging against oversupply).
😨 Fear & Greed Index
Score: 51/100 (Neutral 😐)
Balance between fear (supply risks) vs greed (demand resilience).
📉 Fundamentals & Macro Score
Supply Side
Record US production: 16.7B bushels 🟢
Brazil’s harvest adds oversupply pressure 🔴
Crop diseases (Tar Spot & Southern Rust) hurting yields 🔴
Demand Side
Exports YTD: +46.8% 🌍
Ethanol production: 1.105M barrels/day ⛽ (+30k WoW) 🟢
Tariff risks (China/Mexico) could slow trade 🔴
Macro Score: 6/10 → Moderately Bullish
🎯 Market Outlook Summary
Bull Case (Long) ✅
Strong exports (+28.6% YTD)
Biofuel/ethanol demand supporting floor
Technical rebound chances
Bear Case (Short) ❌
Record harvests (US/Brazil/Ukraine) = oversupply
Institutions scaling up shorts
Global glut risks
📌 Outlook Bias: Bearish-to-Neutral 🐻⚖️
Short-term pressure from supply glut, but demand stabilizes downside.
📌 Key Takeaways for Traders
Breakout Watch: 406.00 🚨
Layered Entry: Manage risk via staggered buys.
Target Zone: 421.00 (book profits before trap).
Macro Mix: Demand solid but supply risks dominate.
Watch List: CAPITALCOM:CORN , CBOT:ZS1! (Soybeans), CBOT:ZW1! (Wheat), CBOT:ZC1! (Corn Futures)
🔗 Pairs to Watch (in USD)
AMEX:SOYB (Soybeans CFD): Moves in lockstep with CORN due to shared ag trends.
AMEX:WEAT (Wheat CFD): Grains often trend together—keep an eye out!
TVC:USOIL : Influences ethanol demand, impacting CORN indirectly.
TVC:DXY (US Dollar Index): A rising USD could pressure commodity prices.
✨ “If you find value in my analysis, a 👍 and 🚀 boost is much appreciated — it helps me share more setups with the community!”
#CORN #Commodities #SwingTrade #DayTrade #ThiefStrategy #MoneyHeistPlan #Futures #LayeringStrategy #BreakoutTrading #Agriculture #Ethanol #TradingCommunity
Short Idea On Sugar (SB1!)Based On :
- Markov state still in bearish regime
- VP and Avwap levels
- Supply zone

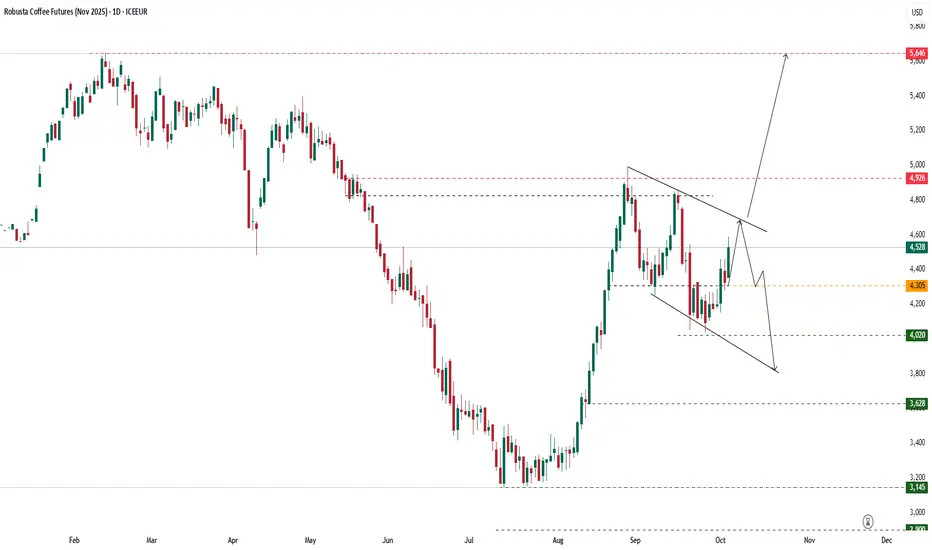
Analysis techniques – Robusta Coffee Futures (Nov 2025)Analysis techniques – Robusta Coffee Futures (Nov 2025)
Date: Oct 06, 2025 | Timeframe: D1 | Contract Code: LRCX25
1. Trend Overview and Price Structure
November Robusta coffee surged to USD 4,528/ton (+4.65%), extending its rebound from the 4,020 – 4,305 support zone.
The price pattern is shaping a falling wedge, a potential reversal setup if the upper boundary near 4,600 – 4,650 breaks.
Medium term, the market is transitioning from a downtrend into a consolidation-recovery phase, targeting 4,926 – 5,646 once resistance breaks.
2. Key Technical Levels
Resistance: 4,650 – 4,926 – 5,646
Support: 4,305 – 4,020 – 3,628
3. Detailed Technical Analysis
(1) Short-term Trend:
The current rally is a corrective move after September’s decline. Holding above 4,305 shows renewed buying strength, supported by a breakout through the descending trendline.
(2) Volume:
Volume expansion during Oct 4–5 sessions indicates active technical buying and bullish participation.
(3) Wave Structure:
Price appears to be forming a wave 3 recovery leg. If the move extends, theoretical targets lie around 4,926 – 5,646.
(4) Confirmation Signals:
A daily close above 4,650 confirms wedge breakout; a break below 4,305 would risk a pullback toward 4,020.
4. Bloomberg Intelligence Strategic View
Short Term: Technical rebound supported by tight ICE inventories and speculative buying in Robusta.
Medium Term: Heavy rains in Vietnam’s Central Highlands and Brazil’s Minas Gerais may improve 2025/26 output, yet Indonesia’s weak supply continues to underpin prices.
Key Risk: A stronger USD or weaker BRL could trigger producer hedging and limit upside momentum.
5. Suggested Technical Strategies
Preferred Long Setup:
Entry: 4,450 – 4,520
TP: 4,926 – 5,646
SL: 4,305
Probability: 65%
Counter-trend Short Setup:
Entry: 4,900 – 4,950
TP: 4,305 – 4,020
SL: 5,000
Probability: 40%
6. Corporate Hedging Guidance
Exporters: Consider forward sales around 4,900 – 5,000 to secure short-term profits.
Roasters/importers: Hedge near 4,400 – 4,500 to mitigate upside exposure in case of a breakout above 4,926.
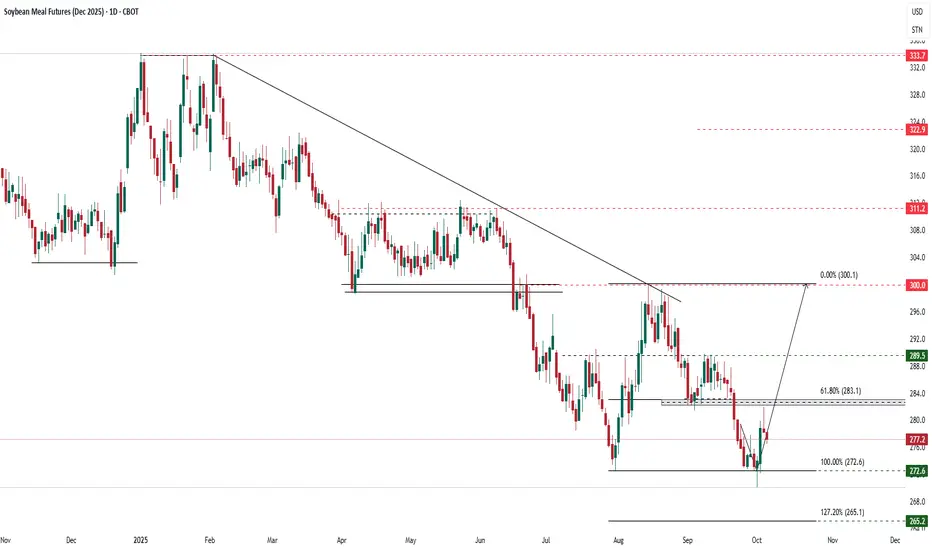
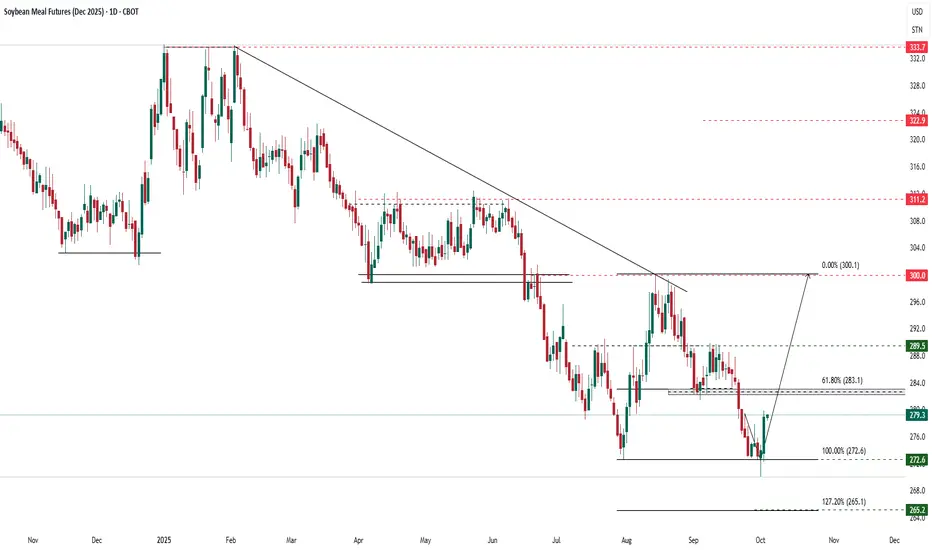
Analysis techniques – Soybean Meal Futures (Dec 2025)Analysis techniques – Soybean Meal Futures (Dec 2025)
Date: Oct 06, 2025 | Timeframe: D1 | Contract Code: ZMZ25
1. Trend Overview and Price Structure
December soybean meal futures edged down by 0.8 USD to 277.4 USD/ton (-0.29%) after rebounding from strong support at 272.6 — the 100% Fibonacci extension of the August–September decline.
The structure suggests a potential short-term corrective rebound, targeting 283.1 (Fib 61.8%) and possibly 300 USD if momentum builds.
Medium-term trend remains bearish, though the narrowing downside range hints at a short-term technical bottom formation.
2. Key Technical Levels
Resistance: 289.5 – 300.0 – 311.2
Support: 277.0 – 272.6 – 265.1
3. Detailed Technical Analysis
(1) Short-term Trend:
Rebound signals from 272.6 suggest potential upside toward 283 – 289.5, with a breakout above 283 confirming recovery momentum.
(2) Volume:
Slight uptick in volume during the rebound indicates renewed bottom-fishing activity.
(3) Wave Structure:
Likely completion of corrective wave C and start of a technical recovery phase (wave 1–2–3) targeting around 300.
(4) Confirmation Signals:
Close above 283 confirms recovery; drop below 272.6 invalidates the bullish setup and opens downside risk toward 265.1.
4. VNC View
Short Term: Technical rebound expected as meal prices are heavily discounted relative to soybeans and soyoil.
Medium Term: Supply-demand balance remains fragile — weaker crush margins and sluggish feed demand cap the upside.
Risks: Stronger USD and Argentine export competition may pressure U.S. meal prices.
5. Suggested Technical Strategies
Preferred Long Setup:
Entry: 276 – 278
TP: 289.5 – 300
SL: 272
Probability: 65%
Short Setup (resistance test):
Entry: 298 – 300
TP: 283 – 276
SL: 305
Probability: 40%
6. Corporate Hedging Guidance
Feed importers: Consider locking in purchases around 275–280 if prices hold above 272.
Oilseed crushers: Delay forward sales until prices approach 300 to secure better processing margins.
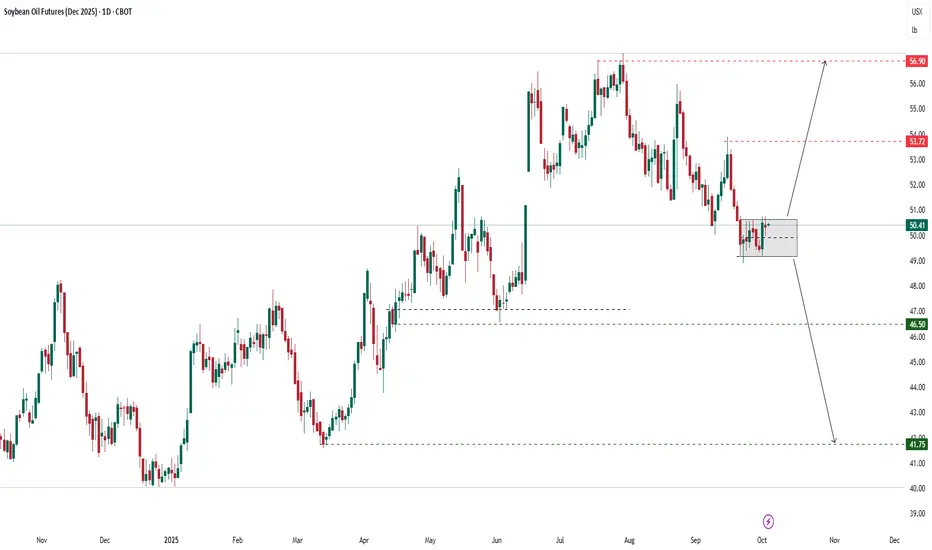
Analysis techniques – Soybean Oil Futures (Dec 2025)Analysis techniques – Soybean Oil Futures (Dec 2025)
Date: 03/10/2025 | Timeframe: D1 | Contract Code: ZLZ25
1. Trend Overview and Price Structure
Soybean oil (Dec 2025) closed at 50.41 cents/pound (+0.16%), consolidating within a tight range of 49.5 – 50.5. After a prolonged decline since July, the market is forming a temporary base but remains under bearish pressure. Current structure suggests indecision, awaiting a breakout from the consolidation box.
2. Key Technical Levels
Resistance: 50.5 – 53.7 – 56.9
Support: 49.0 – 46.5 – 41.8
3. Detailed Technical Analysis
Short-term trend: Sideways consolidation in 49.5 – 50.5; breakout will set next direction.
Volume: Average trading volume, limited new flows.
Wave structure: The prior bearish wave is stalling; a corrective rebound could emerge if 50.5 is breached.
Confirmation signals: A close above 50.5 opens upside toward 53.7 – 56.9; a break below 49 targets 46.5 – 41.8.
4. VNC View
Short term, soybean oil is in a fragile balance. A breakout from 49.5 – 50.5 range will provide a clear trading signal. Medium term, global vegetable oil supply (palm, sunflower) exerts strong competition, limiting sustainable rallies unless supported by crude oil or biodiesel demand.
5. Suggested Technical Strategies
Long Setup (on breakout):
Entry: 50.6 – 51.0
TP: 53.7 – 56.9
SL: 49.5
Probability: 60%
Short Setup (on breakdown):
Entry: 48.8 – 49.0
TP: 46.5 – 41.8
SL: 50.5
Probability: 55%
6. Corporate Hedging Guidance
Edible oil producers: May hedge raw material costs near 49 – 50.
Biodiesel industry: Watch 50.5 breakout; increase hedging if confirmed.
Exporters: Favor partial selling near 53.7 – 56.9 during rallies to avoid downside risks toward 46 – 42.
Analysis techniques – Soybean Meal Futures (Dec 2025)Analysis techniques – Soybean Meal Futures (Dec 2025)
Date: 03/10/2025 | Timeframe: D1 | Contract Code: ZMZ25
1. Trend Overview and Price Structure
Soybean meal (Dec 2025) closed at USD 279.3/ton (+0.14%) on Oct 3. After testing the 272.6 support (Fib 100%) successfully, prices rebounded. The structure suggests a recovery wave is forming, with near-term targets at 283.1 and 300.
The descending trendline from April remains intact, but a short-term rebound could extend if resistance at 283.1 – 289.5 is broken.
2. Key Technical Levels
Resistance: 283.1 – 289.5 – 300.0
Support: 272.6 – 265.0 – 260.0
3. Detailed Technical Analysis
Short-term trend: The bounce from 272.6 signals a recovery setup.
Trading volume: Bottom-fishing flows have returned, confirming strong reaction to support.
Wave structure: The bearish wave since July may have ended at Fib 100%, opening room for a corrective rally toward 289.5 – 300.
Confirmation signals: A close above 283.1 validates the rebound; failure below 272.6 risks further downside toward 265.0.
4. VNC View
In the short term, soybean meal is in a technical recovery after a deep sell-off. Medium term, abundant U.S. supply and South American crop outlook remain bearish drivers. The 300 level is critical: a breakout confirms a trend reversal, while failure keeps prices range-bound at 265 – 280.
5. Suggested Technical Strategies
Preferred Long Setup (short-term):
Entry: 276 – 278
TP: 289.5 – 300
SL: 272
Probability: 65%
Short Setup (failed rebound):
Entry: 289 – 290
TP: 272.6
SL: 296
Probability: 50%
6. Corporate Hedging Guidance
Livestock sector: May hedge feed costs around 276 – 278.
Exporters: Should sell partially at 289 – 300 to secure margins.
Processors: Stay neutral, add coverage only if prices sustain above 300.
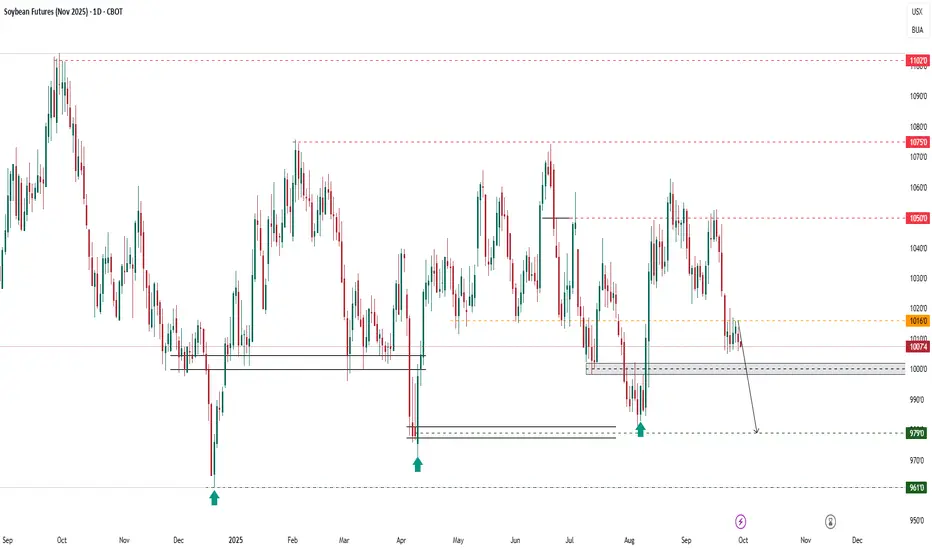
Analysis techniques – Soybean Futures (Nov 2025)Date: 30/09/2025 | Timeframe: D1 | Contract Code: ZSX25
1. Trend Overview and Price Structure
Soybean futures (Nov 2025) remain under pressure after failing to hold the 10,500 resistance. Prices are trading below 10,200 and are testing the psychological 10,000 level, with risks of retesting the 9,790 support. The dominant trend remains bearish.
2. Key Technical Levels
Resistance: 10,160 – 10,500 – 10,750
Support: 10,000 – 9,790 – 9,610
3. Detailed Technical Analysis
Short-term trend: The bearish momentum persists, with consecutive red candles confirming seller dominance.
Trading volume: No major spikes, but sellers remain in control.
Wave structure: A new bearish wave is unfolding, with 9,790 as the immediate target.
Confirmation signals: A recovery above 10,160 is needed to invalidate the bearish outlook.
4. VNC Intelligence Strategic View
With the U.S. 2025 harvest nearing completion and expectations for strong yields, supply pressure remains elevated. Meanwhile, slower Chinese demand adds to the bearish tone. Only unexpected weather disruptions or acreage cuts in 2026 planting could shift sentiment back to bullish.
5. Suggested Technical Strategies
Primary Short Setup:
Entry: 10,050 – 10,100
TP: 9,790
SL: 10,220
Probability: 65%
Counter-trend Long Setup:
Entry: 9,790 – 9,810
TP: 10,050
SL: 9,610
Probability: 50%
6. Corporate Hedging Guidance
Importers may consider gradual buying around 9,800 – 9,790 to secure costs, while U.S. farmers are advised to lock in partial sales near 10,100 – 10,200 to protect margins amid a prevailing bearish environment.
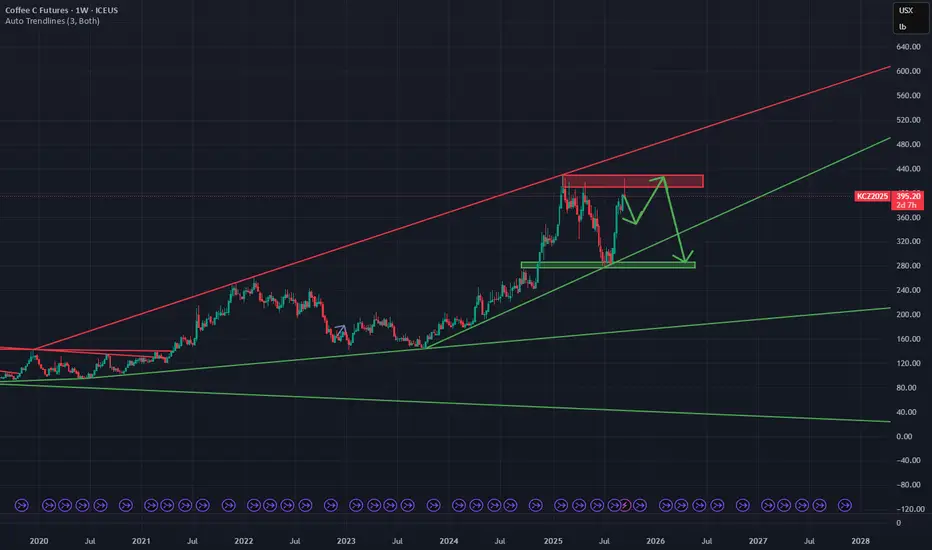
Short Arabica Coffee🔍 Setup
Price is approaching a well‐defined supply/resistance zone (red area on chart). Historically this zone has acted as overhead resistance.
Below, there is a green demand/support zone which should act as target support area.
My target on the short is around 7.8% downside from entry, with stop loss placed just above the resistance zone / recent swing high to limit risk.
📊 Fundamental & Sentiment Background (COT & Others)
According to the latest COT report (as of 9 Sep 2025), commercial hedgers are significantly net short in Coffee C.
tradingster.com
However, speculators / non-commercials are heavily net long. This suggests that bullish momentum is still in force.
tradingster.com
Open interest is rising, showing participation in current levels. This makes the risk of a breakout (to the upside) real, if bulls hold control.
⚠️ Risks to this trade
Momentum from speculators could drive price through resistance, triggering stop losses and a strong short squeeze.
Any unexpected fundamental shock (weather, export disruption, currency devaluation, etc.) could reduce supply or boost demand, pushing prices higher.
If volume doesn’t drop on advance into resistance, the upward move may be stronger than anticipated.
✅ Conditions / Trigger For Entry
I will consider entering the short position once:
Price touches or re-tests the red supply zone.
There's a clear rejection (candlestick reversal pattern + bearish confirmation).
Momentum or RSI / MACD divergence is visible.
Speculator net longs show signs of plateauing or declining in the COT (next report).
🎯 Targets & Risk/Reward
Entry: around current price near supply, or after confirmed rejection.
Stop Loss: just above resistance / recent high.
Target: green demand/support zone (approx. 7-8% downside).
Risk-Reward Estimate: aiming for at least 1.5-2x potential reward vs. risk, ideally better.
🧐 My Edge vs What Could Go Wrong
My trading strategy gives me an average short profit of 7.8%, so this is in line with my risk appetite. The probability for a profitable trade for a short position is 75%. However, on average I will lose 12% on a losing short trade.
But I’m aware shorting commodities is riskier when there's strong bullish positioning (as is the case with speculators now).
I will monitor upcoming COT reports and fundamentals closely — if speculators increase longs again, I might bail earlier or tighten stops.
Conclusion: The COT data does not overwhelmingly confirm a short at this moment. It offers partial support via hedger short positions, but speculator long bias remains strong. If price shows a credible technical rejection in the supply zone and sentiment shows cracks, I believe this short has good risk/reward.
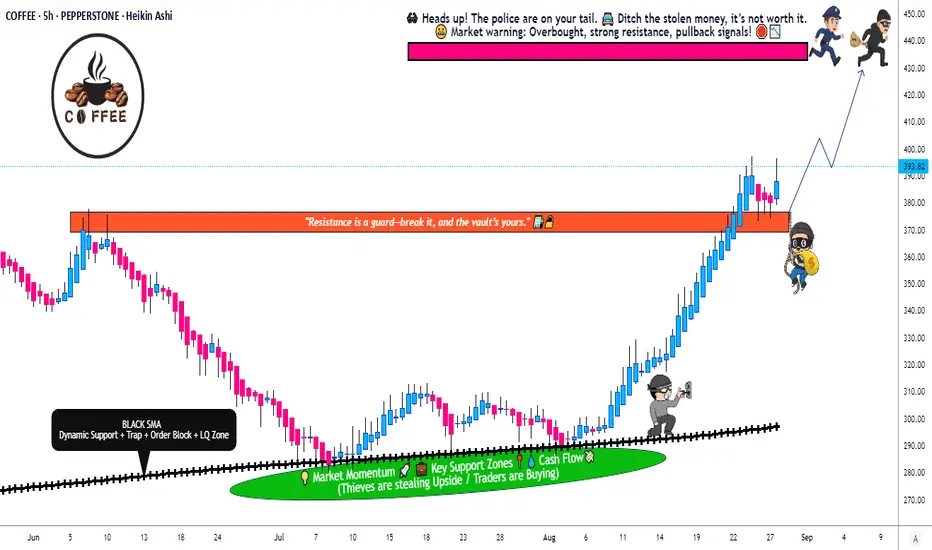
Coffee Heist: Are You Ready for the Bullish Layup?🚨☕ "COFFEE" Heist Plan – Swing/Day Robbery 🚨
🌟 Hola! Ola! Bonjour! Hallo! Marhaba! 🌟
Dear Robbers & Money Makers 🤑💰💸✈️
Based on 🔥 Thief Trading Style Analysis 🔥 here’s our master heist plan to rob the "COFFEE" Commodities CFD Market.
🎯 Plan: Bullish Robbery
Entry 📥: Any price level – Thief always sneaks in at any vault door.
👉 But remember: Thief Strategy = LAYERED ENTRY ⚡
Multiple Buy-Limit Layers:
(390.00) 🏦
(380.00) 💎
(370.00) 🎭
(360.00) 🔑
(Add more layers based on your own robbery plan)
Stop Loss 🛑:
This is Thief SL @ 340.00 ⚔️
Dear Ladies & Gentlemen (Thief OG’s) – Adjust your SL based on your personal robbery strategy & risk appetite.
Target 🎯:
⚠️ Police barricade spotted @ 440.00 🚔
So escape early with the loot @ 430.00 💸 before getting caught!
🏴☠️ Thief Notes:
Our heist is in the bullish zone 🚀
Layer in carefully, don’t rush 💎
Always manage risk – the cops (market makers) are watching 👮♂️
Use alerts, trailing SL & risk management to protect your stolen bags 💰
💥 If you’re riding with the Thief crew – Hit Boost 🚀 & Share Love ❤️ – that fuels our robbery strength!
We rob, we trade, we escape – That’s the Thief Way! 🏆🐱👤
#ThiefTrader #CoffeeHeist #CommoditiesCFD #SwingTrade #DayTrade #LayerStrategy #BuyTheDip #TradingPlan #ForexRobbers #MarketHeist