RENDER - Decision Zone ApproachingRENDER is slowly grinding lower and approaching a clear demand zone, an area where buyers have previously stepped in aggressively.
As long as price is holding inside this blue demand zone, the plan is simple:
👉 look for longs, patiently, with confirmation...
That said, context matters.
For the bulls to fully take control again, one thing is still missing:
a clean break above the red falling channel. Until that happens, any upside remains corrective rather than impulsive.
In short:
Demand zone = opportunity.
Channel break = confirmation.
⚠️ Disclaimer: This is not financial advice. Always do your own research and manage risk properly.
📚 Stick to your trading plan regarding entries, risk, and management.
Good luck! 🍀
All Strategies Are Good; If Managed Properly!
~Richard Nasr
AI

$APLD – One of the Hottest Charts in the Market Right NowApplied Digital ( NASDAQ:APLD ) just delivered a big breakout over $40, and this one has real heat behind it. Clean chart, clean story, and serious momentum.
🔹 The Setup:
Clear breakout through $40, a major technical and psychological level.
Price has been coiling and building energy — this move is the release.
Volume expansion confirms this isn’t a fake move.
🔹 The Theme:
NASDAQ:APLD is an AI data center play, and that theme is back in force.
Infrastructure names tied to AI compute and power are where the money is flowing.
When the theme + chart align like this, you pay attention.
🔹 My Trade Plan:
1️⃣ Position: Added this morning on the breakout.
2️⃣ Stop: $37 — clean, defined risk.
3️⃣ Management: Looking to ride momentum and trail as long as it holds structure.
Why This One Stands Out:
Breakout from a well-defined base.
Strong narrative + strong tape.
This is what leadership looks like when a sector is in favor.
Right now, this is one of the hottest charts in the market.

Is NVIDIA showing signs of a potential momentum shift?Is NVIDIA starting to shift momentum after a strong uptrend since October 2022?
There’s a possibility of a retest toward $88 if price fails to break out above the $180 range.
Volume continues to decline, suggesting weakening participation. Only time will tell.

CIEN (USA) - Optical Infrastructure Holding Key SupportCiena Corp has been a powerhouse in the infrastructure space, delivering a gain of around 200% over the last year. While the headlines focus on the AI chips, Ciena provides the massive optical plumbing needed to actually move that data around.
Fundamentally, the demand for bandwidth is clearly showing up in the numbers. Looking at the quarterly financials snapshot, revenue (the blue bars) hit a high in the most recent quarter, confirming that orders are flowing in. However, you’ll notice the net margin (the orange line) dipped recently. That kind of volatility isn't unusual when a company is scaling hard to meet a rush of demand. Costs often jump before efficiency kicks back in. The driver here remains the frantic build-out of data centers around the world requiring high-speed interconnects.
Technicals show a classic bull flag forming. The price has pulled back from its highs and consolidated above the 50-day SMA (the orange line), which has supported this run for months. We are now back up above the 20-day so will be good to see if it holds this level. You can see the RSI has reset from overbought levels down to a neutral 57, indicating a better value area people like to enter at. The MACD histogram is also shallowing out, suggesting the selling pressure is already drying up. It looks like a standard recovery period before the market decides on the next run.
Might be worth a watch.
..................................................
PLEASE NOTE: Nothing I post is trading advice. All investing involves risk, and past performance doesn’t predict future results. Trends can and do end. For 2026 , my goal is to try and post one new asset each day. Something outside the usual gold, silver, BTC, or big tech names. I like to find stocks worldwide showing steady trends with some good gains, a recent pullback, and signs of renewed strength. I don’t necessarily hold positions in these. They are simply companies I find interesting at the time of posting. I’ll often revisit them within a week to see how they went and share any updates. If you enjoy these posts, please BOOST and FOLLOW ME to discover more under-the-radar stocks and businesses from around the world.
..................................................

Baidu — China’s AI Stack: Search → Cloud → Chips → AutonomyCompany Overview
Baidu NASDAQ:BIDU is a China internet & AI leader spanning search, AI cloud, generative AI, and autonomous driving—a full-stack platform positioned for secular AI adoption.
Key Catalysts
Kunlunxin Spin-Off (HK): Planned listing of the AI chip unit could surface hidden value, improve capital access, and sharpen execution as China accelerates domestic semiconductor development.
Generative AI Leadership: ERNIE 5.0 and upcoming proprietary AI chips strengthen model performance + unit economics across consumer and enterprise use cases.
AI Cloud & Platforms: Expanding AI cloud workloads and ecosystem tools drive recurring revenue; integration across Baidu’s services enhances data/network effects.
Autonomous Driving/Apollo: Long-duration optionality from robotaxi and AD stacks—strategic relevance as cities scale autonomous pilots.
Why It Matters
End-to-end AI control: model + chip + cloud + apps
Structural China tailwinds in AI/semis
Resilient core search cash flows funding AI scale-up
Investment Outlook
Bullish above: $125–$126
Target: $280–$290 — supported by chip spin-off unlock, ERNIE leadership, and AI cloud growth.
#BIDU #AI #Kunlunxin #GenerativeAI #ChinaTech #AICloud #AutonomousDriving

Salesforce Wins $5.6B Army Deal: AI & Strategic AnalysisAn in-depth analysis of Salesforce’s $5.6B U.S. Army contract and its multi-domain impact on CRM stock.
Geostrategy and Geopolitics: The Defense Pivot
Salesforce effectively entered the hard-power arena with its $5.6 billion U.S. Army contract. This move transcends typical software procurement. It signals a strategic alignment between Silicon Valley innovation and national security imperatives. The Pentagon, now emphasizing an "AI-first" warfighting stance, requires robust commercial partners. Salesforce’s "Missionforce" initiative directly addresses this geopolitical need. By securing this foothold, Salesforce mitigates risks associated with purely commercial market fluctuations. The deal positions the company as a critical infrastructure provider for the Department of Defense. This geopolitical integration offers a long-term hedge against global economic instability.
Business Models and Economics: The IDIQ Structure
Investors must scrutinize the "indefinite-delivery, indefinite-quantity" (IDIQ) nature of this agreement. While the $5.6 billion headline figure grabs attention, it represents a ceiling, not guaranteed revenue. The actual economic value depends entirely on the velocity of task orders. This business model shifts the focus from immediate bookings to long-term consumption utility. Analysts note a transition from buying software to "orchestrating outcomes at scale." Consequently, revenue recognition will likely trickle in rather than surge. This structure demands patience from shareholders expecting immediate quarterly spikes.
Technology and High-Tech Innovation: Agentic AI
The core value proposition lies in "Agentic AI." Salesforce aims to deploy autonomous agents that streamline logistics and decision-making. This technology leapfrogs traditional static dashboards. The Army contract specifically targets the unification of disparate data sources. By creating a "trusted data fabric," Salesforce lays the groundwork for advanced AI deployment. This focus aligns with the Pentagon’s broader GenAI.mil initiative. Success here proves that Salesforce’s AI tools work in high-stakes, chaotic environments.
Industry Trends and Competition
The government IT sector remains a crowded battlefield. Microsoft and Oracle traditionally dominate this space, while Palantir commands the data analytics niche. Salesforce’s entry disrupts this oligopoly. The contract validates Salesforce’s ability to compete for massive federal allocations. It challenges the assumption that CRM tools lack the robustness for defense applications. This trend suggests a blurring line between enterprise customer service tools and military-grade logistics. Salesforce is aggressively carving out market share from established defense contractors.
Management and Leadership: Strategic Alignment
Salesforce leadership executed a precise pivot toward the public sector. Kendall Collins, CEO of Missionforce, effectively operationalized this strategy. This leadership success highlights an adaptive corporate culture capable of navigating complex federal procurement. Furthermore, alignment with Defense Secretary Pete Hegseth’s "AI-first" vision demonstrates high-level strategic synergy. Peter Lington, VP for the Department of War business, emphasizes data as a "strategic asset." This coherent messaging between corporate executives and Pentagon leadership instills market confidence.
Cyber Security and Data Sovereignty
Security remains the linchpin of this deal. The Army requires absolute trust in its data before unleashing autonomous agents. Salesforce’s "Computable Insights" subsidiary addresses these specific security mandates. The emphasis on a "Modular Open-Source Approach" (MOSA) reduces vendor lock-in risks. It also forces Salesforce to prove its cybersecurity resilience constantly. Any breach would jeopardize not just the contract, but the company's entire federal reputation. Therefore, cybersecurity excellence acts as the primary gatekeeper for realizing the contract’s full value.
Macroeconomics and Market Sentiment
Salesforce shares ticked up 0.6% to $229.40 following the news. This muted reaction reflects investor caution regarding the macroeconomic environment. High interest rates continue to pressure tech valuations. Traders currently weigh the "hype" of AI against tangible book orders. The upcoming February 25 earnings report becomes the critical litmus test. The market demands proof that federal wins effectively counter broader economic slowdowns. Until then, the stock likely remains range-bound, waiting for concrete revenue data.
Patent Analysis and Science
The underlying science of this deal rests on data unification and API orchestration. Salesforce must leverage its intellectual property to connect legacy military systems. This requires advanced patent-protected methods for data ingestion and normalization. The "Golden Record" concept, a single source of truth, relies on sophisticated algorithmic reconciliation. Future patent filings will likely focus on "Agentic" behaviors and secure government cloud architectures. This intellectual property moat protects Salesforce from competitors seeking to clone its government-specific solutions.

Will Gas Prices Collapse or Skyrocket in 2026?The natural gas market stands at a critical inflection point in 2026, transforming from a simple commodity into a geopolitical weapon and economic force. A massive surge in global LNG capacity, dubbed the "third wave," is reshaping the entire energy landscape. The United States has achieved record production levels of 108.5 billion cubic feet per day, while new liquefaction facilities from Qatar to the Gulf Coast prepare to flood markets with an additional 300 billion cubic meters by 2030. This abundance has driven domestic prices down, saving American consumers $1.6 trillion over 17 years and pushing gasoline to 4-year lows.
However, this supply glut creates a paradox. While North American producers maintain unprecedented output, global volatility intensifies as regional markets become interconnected. A production disruption in Qatar now affects prices in Houston; a cold snap in Tokyo impacts manufacturing costs in Berlin. Geopolitical risks have escalated dramatically, pipelines have become legitimate military targets, cyberattacks on infrastructure are industrialized, and traditional alliances fracture under sanctions. Russia's gas flows through Azerbaijan to Europe exemplify how energy security has become a theater for strategic manipulation.
Technology accelerates both opportunity and risk. Artificial Intelligence now drives exploration decisions and trading algorithms, while satellites patrol for methane leaks. Yet the industry faces existential threats: state-sponsored hackers target control systems, carbon regulations tighten globally, and the economics of stranded assets loom large. Capital discipline has replaced the boom-bust mentality of previous cycles, with producers prioritizing margins over volume. The convergence of massive supply, geopolitical tension, and technological transformation creates a market where the only certainty is radical uncertainty, making natural gas simultaneously more abundant and more volatile than ever before.

ZM - Zoom in on this one...Growing Revenue, chart stabilising...Is NASDAQ:ZM looking to make a serious move to the upside?
Our systems have identified a point of potential interest & volatility in ZM.
If price can hold above $78.21 ... Significant Bullish potential may be unlocked.
If however price falls below $78.21 ... Significant Bearish risk may come into play.
As things sit now, it seems momentum may have turned to the upside for ZM, but will it hold? Let's find out...
We're inspired to bring you the latest developments across worldwide markets, helping you look in the right place, at the right time.
Explore our profile for further updates, and we look forward to being of service along your trading & investing journey!
Disclaimer: Please note all information contained within this post and all other Bullfinder-official Tradingview content is strictly for informational purposes only and is not intended to be investment advice. Past performance is not in any way indicative of future performance. Please DYOR & Consult your licensed financial advisors before acting on any information contained within this post, or any other Bullfinder-official TV content.

NVIDIA – Head & Shoulders Forming | Trade Setup InsideNVIDIA NASDAQ:NVDA has been a market leader in AI and semiconductors, posting record revenue and earnings in recent quarters. Strong demand from data centers and enterprise AI continues to drive top-line growth. However, valuation remains elevated, and macro risks—especially around tariffs—are resurfacing.
🔍 On the chart, a Head & Shoulders pattern appears to be forming, signaling a potential reversal. If tariff-driven volatility picks up, a breakdown toward the $162–$163 support zone is possible. This level could offer a short-term bounce or signal deeper weakness depending on confirmation.
📊 Trade Setup:
Entry: $162–$163 (support zone)
Take Profit: $174, then $184
Stop Loss: $156
Long-term fundamentals remain strong, but technical caution is warranted here. Watch the neckline and macro headlines for clues on next moves.

TSLA D1 Institutional Buy/Sell Levels by ProjectSyndicate 🔱 TSLA DAILY SNAPSHOT — EXECUTIVE SUMMARY (NEW WEEK | JAN 2026)
✨ Dip-accumulation reversal setup is the focus — but upside is capped until overhead sell-side is cleared
🧲 Fresh overhead sell-side liquidity / fresh supply: 495 plus key level 460
📌 Context: price is range-bound between fresh supply 495 and fresh demand 300 → institutional levels define the map
🧲 Bull FVG + preferred reversal zone: 365 USD = best area to scale into longs (360–380)
🛡 Failure zone / risk-off trigger: loss of 340 opens downside to 300 fresh demand
🎯 Bull target: 495 fresh supply pocket overhead
🏦 Core play: accumulate on dips at/near 360/380, manage risk if 340 fails, take profit into 495
🗳️ TSLA Daily Scenarios — What’s Your Play?
Which path do you have for TSLA next week?
🅰️ Hold 360–380 → reversal works → reclaim 420 → rotation into 460
🅱️ Sweep below 360 → reclaim 365 FVG → squeeze into 420 → 460
🅲 Drive into 460 → stall/reject → pullback toward 420 → 380
🅳 Break/hold below 340 → weakness confirms → downside opens to 300
Your key levels: 460 / 420 / 380 / 340
Your FVGs: 365 (bulls)
Your fresh zones: 495 supply / 300 demand
Plot same levels on your TSLA chart with
Supply Demand Zones PRO | ProjectSyndicate

INVH - Invitation Homes ready for a comeback?Revenue continuing to grow, however margin took a hit from 23 to 24. Can 25 results re-establish robust margins and continue to improve beyond?...Is NYSE:INVH looking to make a comeback?
Our systems have identified a point of potential interest & volatility in INVH.
If price can hold above $26.15 ... Significant Bullish potential may be unlocked.
If however price falls below $26.15 ... Significant Bearish risk may come into play.
As things sit now, momentum is not to the upside for INVH, but will we see that change shortly? Let's find out...
We're inspired to bring you the latest developments across worldwide markets, helping you look in the right place, at the right time.
Thank you for reading! Explore our profile for further updates, and we look forward to being of service along your trading & investing journey...
Disclaimer: Please note all information contained within this post and all other Bullfinder-official Tradingview content is strictly for informational purposes only and is not intended to be investment advice. Past performance is not in any way indicative of future performance. Please DYOR & Consult your licensed financial advisors before acting on any information contained within this post, or any other Bullfinder-official TV content.

CoreWeave: The Trump-Backed AI Power PlayPresidential portfolios rarely scream "growth stock," but recent financial disclosures change the narrative. Donald Trump purchased over $50 million in corporate bonds, including debt from AI infrastructure unicorn CoreWeave (CRWV). This move places the GPU cloud provider alongside established industrial titans. Investors must now decide if this political endorsement aligns with fundamental value.
Geopolitics and Geostrategy
The executive branch views Artificial Intelligence as a sovereign asset. CoreWeave’s infrastructure directly supports U.S. dominance in the global AI arms race. By financing domestic GPU capabilities, the administration signals a strategic pivot away from foreign reliance. This investment acts as a tacit endorsement of CoreWeave’s role in national security. The company is no longer just a cloud provider; it is a critical national infrastructure.
Business Models and Economics
CoreWeave rejects the speculative excesses of the dot-com era. Management utilizes a disciplined "take-or-pay" revenue model. They only deploy capital expenditure after signing five-year customer contracts. These agreements cover infrastructure costs and debt service immediately. This strategy reduced financing costs significantly, securing recent funding at highly competitive rates. The company builds to meet existing demand, not anticipated hype.
Industry Trends and Financials
The financial data reveals explosive momentum. Third-quarter revenue hit $1.4 billion, a staggering 134% year-over-year increase. The revenue backlog swelled to $55 billion, nearly quadrupling since the year began. This backlog confirms that demand for high-performance computing far outstrips supply. Unlike legacy cloud providers, CoreWeave offers pure-play AI exposure.
Technology and Innovation
Hardware is useless without intelligent orchestration. CoreWeave’s proprietary software, "Mission Control," serves as its technological moat. This layer autonomously manages operations to maximize performance and extend GPU lifespan. Industry experts awarded CoreWeave the exclusive Platinum ClusterMAX ranking twice. No other cloud provider holds this distinction. This technical superiority drives customer retention, evidenced by early contract renewals at near-original prices.
Management and Leadership
Executive leadership actively mitigates concentration risk. At the start of 2025, a single customer held 85% of the backlog. Today, no client exceeds 35%. Furthermore, over 60% of this backlog now comes from investment-grade entities. Management proved their transparency by lowering 2025 guidance due to third-party construction delays. They prioritized realistic communication over inflating short-term expectations.
Macroeconomics and Future Outlook
The macroeconomic environment favors infrastructure builders. Forecasts suggest revenue will skyrocket to $29 billion by 2028. Adjusted earnings per share could swing from a loss to $4.51 in the same period. If the stock trades at a reasonable 35x forward earnings, CRWV offers over 55% upside. The market consensus rates the stock a "Strong Buy" with a $124.70 price target.
Conclusion
CoreWeave combines political tailwinds with elite technical execution. The Trump debt purchase validates the company's stability. However, the $55 billion backlog serves as the true buy signal. For investors seeking direct exposure to the engine room of the AI economy, CoreWeave represents a high-conviction opportunity.

MPWR: The High-Conviction AI Power PlayMonolithic Power Systems (MPWR) is now a critical lynchpin in the global AI infrastructure race. Market expectations have shifted upward, with revised price targets significantly exceeding previous levels. Investors must look beyond the headline numbers to understand the deep structural advantages driving this valuation.
Industry Trends and Technology
Artificial Intelligence runs on power as data centers scale to support next-generation GPU and XPU platforms, and energy consumption skyrockets. Experts identify MPWR as a compelling AI infrastructure bet for this exact reason. The company dominates high-density power delivery. Their integrated circuits (ICs) solve the twin challenges of energy efficiency and heat dissipation. In the high-stakes world of AI training, thermal management is not just a feature; it is a physics-defined necessity.
Business Models and Innovation
MPWR differentiates itself through relentless specialization. Unlike broad-market chipmakers, they focus exclusively on high-performance power solutions. This "sniper" approach allows them to capture high-margin segments in computing, automotive, and industrial markets. Their business model relies on solving complex engineering problems that competitors avoid. This culture of engineering excellence creates a formidable moat. By reducing total energy consumption, they provide direct cost savings to hyperscalers, making their products indispensable.
Geopolitics and Geostrategy
AI dominance is the new nuclear arms race. Nations and corporations compete desperately for computational supremacy. This geopolitical friction drives demand for the most efficient hardware available. MPWR sits at a strategic choke point in this supply chain. Without advanced power management, the world’s fastest chips cannot operate at peak performance. Consequently, MPWR’s technology becomes a strategic asset, insulating it somewhat from standard consumer cycle fluctuations.
Macroeconomics and Economics
The macroeconomic environment remains uncertain, yet AI spending shows resilience. Corporations prioritize AI investment to drive future productivity, ignoring short-term headwinds. This divergence creates a multibillion-dollar potential for MPWR. While other sectors contract, the data center power market expands. This economic decoupling allows MPWR to outperform broader indices. Smart capital flows toward infrastructure plays that underpin the entire digital economy.
Patent Analysis and Science
MPWR’s dominance rests on hard science and intellectual property. Their patent portfolio covers novel methods for reducing heat dissipation in integrated circuits. This is not merely design; it is material science innovation. Protecting these advancements prevents commoditization. Competitors struggle to replicate MPWR’s efficiency metrics without infringing on their IP. This legal and technical barrier secures their market share against cheaper, generic alternatives.
Conclusion
Monolithic Power Systems represents more than a chip stock. It is a foundational infrastructure play for the AI era. Management executes a clear vision, leveraging technical superiority to command pricing power. For investors seeking high-conviction exposure to the AI boom without picking a single software winner, MPWR offers a compelling solution.

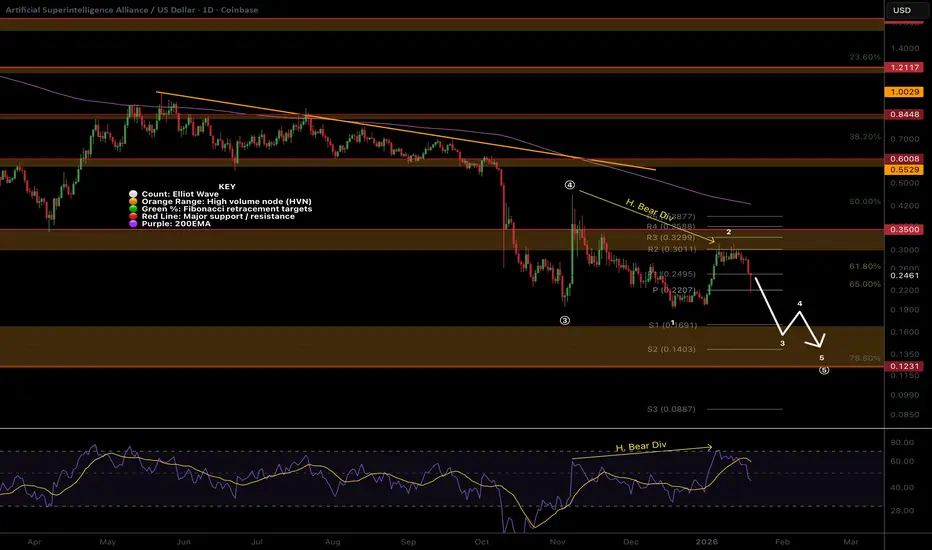
FET looking for new lows, downtrend in tact, h. bear divNYSE:FET
🎯The downtrend is intact, with wave 2 appearing complete. Wave 3 down is strong and hard. Price appears to want to continue lower to test the altCoin golden pocket at 0.786 Fibonacci retracement.
📈 Daily RSI went too high, too fast, and printed hidden bearish divergence at a High Volume node. The rejection was hard and swift.
👉 Analysis is invalidated above wave 2 swing high, $0.3.
Safe trading
AXTI (USA) - Up 900% over the last 12 months. Super Speculative!AXT Inc has had a bonkers run this year, posting gains of nearly 900% over the past twelve months. This company is a specialist in the semiconductor space, specifically making high-performance wafers for when standard silicon isn't enough. If you want to move data using light in an AI data centre which is becoming the standard, then according to them (and potentially their share price) you need the indium phosphide wafers these guys produce. It is classic "picks and shovels" play for the ongoing AI infrastructure build-out.
At the January 2026 Needham Growth Conference, AXT management emphasized their role as the only "pure-play" indium phosphide company available to investors. They explained that AI data centres are hitting a limit with copper wiring and are moving rapidly toward optical connectivity . This shift requires their wafers at both ends of the fibre optic cables. Management expects demand to double in 2026 and potentially double again in 2027. While they acknowledged risks involving Chinese export permits, they are doubling their capacity to capture market share from Japanese competitors, positioning themselves as a critical link in the AI hardware supply chain.
Full conference transcript here: www.tradingview.com
The fundamental story here is driven by a massive shift from copper to optical connectivity . As data speeds increase, the demand for their core material is expected to double annually for the next couple of years. The recent sharp drop in price looks like a mix of standard profit-taking after a vertical move and some nerves regarding Chinese export permits . Since they manufacture in China, they have to navigate some geopolitical bureaucracy, which adds a layer of risk but doesn't seem to have dampened the overall demand for their tech.
Technically, the stock went parabolic and has just had a big pullback. The price is currently moving back toward the 20-day SMA (the green line), which is a much healthier place to look at a trend follower than at the very top of a vertical spike. The RSI has reset from extremely overbought levels down to around 60, giving the chart some room to move again. While the MACD histogram shows that upward momentum is slowing for now, the primary trend remains very strong. It hasn't bounced yet, so it's too early to pick a direction, but still an interesting company at the cutting edge of technology.
Super speculative trade, but if their technology really is the main game in town and they can navigate Chinas export drama then it could be an interesting stock to keep an eye on.
==============================
PLEASE NOTE: Nothing I post is trading advice. All investing involves risk, and past performance doesn’t predict future results. Trends can and do end. For 2026 , my goal is to try and post one new asset each day. Something outside the usual gold, silver, BTC, or big tech names. I like to find stocks worldwide showing steady trends with some good gains, a recent pullback, and signs of renewed strength. I don’t necessarily hold positions in these. They are simply companies I find interesting at the time of posting. I’ll often revisit them within a week to see how they went and share any updates. If you enjoy these posts, please BOOST and FOLLOW ME to discover more under-the-radar stocks and businesses from around the world.
==============================

Zeta Global: structure reset on the weeklyZeta Global Holdings Corp. operates in marketing technology, providing data-driven customer intelligence and automation solutions for enterprises.
On the weekly chart, ZETA has completed a breakout above the long-term descending trendline and is currently holding a clean retest zone. The key support area sits between 17.8 and 18.4, where the weekly MA100 aligns with the 0.786 Fibonacci retracement. This confluence strengthens the structure and confirms acceptance after the impulse. Volume expanded on the breakout and cooled during the pullback, suggesting controlled price action rather than distribution. Weekly MACD is turning higher after a prolonged reset, while RSI remains above neutral territory, supporting a shift in market phase. Volume profile highlights upside attraction zones, with the first major area near 29–30 and a higher zone around 40.
From a fundamental perspective, the company shows improving financial quality. Market capitalization is around $5B, with consistent positive operating cash flow. Quarterly operating cash flow reached $57.9M, while free cash flow increased to $52.4M, both growing strongly year over year. Revenue continues to expand, with Q4 2025 estimates near $378M and expected EPS of $0.23. ZETA does not pay dividends, focusing instead on reinvestment and growth, while maintaining manageable debt and a solid balance sheet.
This is a higher-timeframe positioning idea where the market gradually reassesses the business after a corrective phase. Calm structure, improving fundamentals, and clear technical logic.

Autodesk | ADSK | Long at $261.72Autodesk NASDAQ:ADSK is a leading software company providing 3D design, engineering, and entertainment solutions. It's primarily known for AutoCAD, a program used by professionals in architecture, engineering, construction, and product design to create, visualize, and manage projects from concept to completion. It's increasingly integrating AI for enhanced automation and workflows, operating on a subscription model with cloud-based tools.
Technical Analysis
The price is currently bouncing along my selected historical simple moving average. So far, it has behaved "nicely and predictably" in this area of support. Momentum is trending upward, but this doesn't mean a short-term dip into the low $200's isn't ahead. The glaring price gap between $335 and $339 on the daily chart will be filled, though. It's just a matter of when. Given the low RSI (indicating a potential reversal) and current area of support, it seems primed for a move up soon...
Health
Debt-to-equity: 0.9x (very healthy)
Altman's Z score / bankruptcy risk / long-term health: 5.3 (very low risk)
Quick ratio / ability to pay today's bills / short-term health: 0.8 (minor risk)
Growth
Earnings-per-share growth expected 45.1% between 2025 ($10.23) and 2028 ($14.84)
Revenue growth expected around 32% between 2025 ($7.2 billion) and 2028 ($9.8 billion)
Insiders
Lots of selling (bearish, but common among tech)
Action
NASDAQ:ADSK transition to a subscription-based/cloud-native model, continued EPS and revenue growth, dominant market position, and exploration of AI-drive tool are all bullish cases for the stock. It's current P/E of 50x, insider selling, and short-term solvency are bearish, though. Given the growth potential, upward momentum, and last gap fill to $339, NASDAQ:ADSK is in a personal buy zone at $261.72. It's a starter position in case short-term bearishness kicks in and additional, lower opportunities open up in the low $200's.
Targets into 2029
$292.00 (+11.6%)
$338.00 (+29.1%)

007660 (Korea) - ISU Petasys Major Momentum RunnerISU Petasys Co., Ltd. has had an incredible run, gaining over 360% in the last year. Based in South Korea, they are a major player in manufacturing multi-layer printed circuit boards (PCBs) used in networking and AI infrastructure .
The fundamental story here is all about the demand for high-performance computing and data centres. As a supplier to global tech giants, they’ve ridden the AI wave hard. The recent pullback doesn't look like a business failure; it looks like standard profit-taking after the stock got a bit ahead of itself. The demand for high-spec network boards in the AI space remains a strong driver.
Technically, the pullback has been a deep 30% drop back into value . Price fell through the shorter-term averages and is now looking like it is recovering and moving away from the more critical 100-day SMA (the red line). This is often where longer-term trends find support after a deep correction. The RSI has cooled all the way down to a neutral 49, resetting the overbought conditions we saw earlier. The MACD is still negative, but the selling pressure seems to be slowing down as price consolidates in this zone.
Might be worth a watch to see if it runs again. AI led demand isn't going away any time soon.
==============================
ABOUT ME: Global TradingView Moderator (English) and full-time trader. I focus on top-performing stocks worldwide , trading momentum and clean trend continuations after pullbacks. I use a trailing stop customised for each stock to manage risk, lock in gains, and exit when the trend ends. Nothing I post is trading advice. I simply like to highlight interesting companies from around the world that may be worth a closer look. Please give this idea a BOOST if you found it interesting, and FOLLOW ME to discover more standout stocks and businesses from global markets.
==============================

TSLA: Wave 5Short term looks positive. Slightly more to go within the corrective phase. As usual its a sideways movement, to a grind up, to a spike up.
Timing is not advised.
*This is a long term investors perspective on technical analysis.

Silver $92: The "Boring" Rock That Crushed The Nasdaq (210% 1Y) "Wait... Silver did WHAT?" 🤯
I put the Thinking Face emoji on the chart for a reason. It represents 90% of the market right now. While everyone was busy arguing about Nvidia and Bitcoin, the "boring" gray rock quietly went vertical to $92.00.
If you were watching the Nasdaq, you missed the real show. This isn't just a rally, folks. It’s a Capital Rotation. The "Smart Money" stopped buying paper lottery tickets and started buying heavy metal.
Why is this happening?
1. Silver is the new "Tech Stock" ⚡
Forget grandma's silverware. You want to build AI Data Centers? You need Silver (it's the best conductor on Earth). You want to build Solar Panels? You need Silver. Basically, if you want the "Future," you have to buy the metal that powers it. We are running out of the essential ingredient for the tech revolution.
2. We Forgot to Dig 📉
For the last 10 years, nobody wanted to build silver mines. It wasn't "cool." Well, now demand is exploding, and guess what? You can't 3D print a silver mine. We are in a massive supply deficit. The only way to fix it is higher prices. Much higher.
3. The "Panic" Bid 🛡️
Let's be real—the world got a little crazy in 2025. When billionaires and Central Banks get nervous about currencies, they don't buy bonds anymore. They buy hard assets. Silver is just Gold on steroids.
The Chart:
Institutional "God Mode" Look at those colored lines (Moving Averages). They are fanned out like a royal flush.
Green Line (20 MA): Holding.
Purple Line (50 MA): Holding.
Orange Line (200 MA): Miles away.
This is what "Up Only" looks like when the big boys are accumulating.
The Verdict The "Thinking Emoji" is for the bears who are still waiting for a dip that never comes. Don't be confused. This is just what happens when Industrial Scarcity meets Unlimited Money.
Disclaimer: Just one trader's view on the madness. Not financial advice.
Are you team "Tech Stocks" or team "Heavy Metal" for 2026?
Fight it out in the comments. 👇

ASE Technology (ASX) — Advanced Packaging Tailwind from AI & HPCCompany Overview
ASE Technology NYSE:ASX is a global leader in semiconductor packaging & testing, leveraged to rising chip complexity and outsourcing across AI, HPC, automotive, and communications.
Key Catalysts
Revenue Momentum: Nov ’25 sales +15.5% YoY (~$1.9B) on accelerating demand for AI-related assembly and advanced test.
LEAP Platform: LEAP advanced packaging is a growing mix & margin driver as heterogeneous integration (chiplets, 2.5D/3D) becomes essential for next-gen AI silicon.
Scale Advantage: Broad customer base + leading OSAT scale support capacity, yield, and time-to-market advantages versus smaller peers.
Auto/Comms Upside: Content-per-vehicle and RF/optical upgrades add durable, non-AI legs to growth.
Investment Outlook
Bullish above: $13.50–$14.00
Target: $20.00–$21.00 — supported by AI/HPC packaging demand, LEAP margin expansion, and continued test outsourcing.
#ASX #Semiconductors #AdvancedPackaging #AI #HPC #Chiplets

IREN financial report and investment ideaExecutive summary (≤200 words)
IREN (NASDAQ: IREN) trades near $50.33 (market cap $16.53B). Recent metrics show strong profitability (ttm net income $523.3M; diluted EPS ttm $1.74) and large operating cash generation (OCF ttm $392.2M) but negative levered FCF (ttm −$957.1M) driven by heavy capex. Enterprise value $16.46B implies EV/Revenue 23.9x and EV/EBITDA 16.93x. Using updated inputs (shares 328.34M, net cash ≈ $64M, revenue ttm $688.6M, EBITDA ttm $232.1M), I run a 5‑year DCF and multiples checks. Conservative DCF (WACC 9.0%, terminal g 2.5%) yields fair value below market; comparable EV/EBITDA expansion scenarios can justify materially higher market prices if growth/margins exceed conservative assumptions.
Key catalysts: Sweetwater commissioning cadence, Microsoft contract billing milestones, NVIDIA delivery timing. Key risks: execution on buildouts, high GPU & DC CapEx, high short interest (15.8% of float) amplifying volatility.
Key inputs
Price (close Jan 12, 2026): $50.33; pre‑market $50.93
Market cap: $16.53B; EV: $16.46B
Shares outstanding: 328.34M; float: 257.98M
Revenue (ttm): $688.55M; Gross profit (ttm): $480.75M
EBITDA (ttm): $232.12M; Net income (ttm): $523.26M; EPS (ttm): $1.74
OCF (ttm): $392.15M; Levered FCF (ttm): −$957.13M
Total cash (mrq): $1.03B; Total debt (mrq): $965.63M → Net cash ≈ $64M
Valuation ratios: P/E (trailing) 28.93; EV/Revenue 23.90; EV/EBITDA 16.93; P/S 19.47
Short interest: 50.01M (15.78% of float); Beta 4.27
Modeling approach and adjustments
Use revenue ttm $688.6M as new base (FY‑end 6/30). Translate ttm figures to FY2026 starting point and derive starting unlevered FCF from OCF and known capex patterns. Incorporate known GPU CapEx (if confirmed) as incremental investing outflow; otherwise treat as contingent and show sensitivity. Use shares 328.34M and net cash ~$64M to move from EV → equity value. Present DCF (5‑yr explicit) plus sensitivity table (WACC ±1%, terminal g ±0.5%). Provide multiples valuation using implied EV/EBITDA and peer ranges.
Assumptions applied (explicit)
Base unlevered FCF (Year 0 / FY2026 base): derive from OCF ttm $392.2M; subtract normalized CapEx. Given levered FCF ttm −$957.1M, I treat FY2026 base unlevered FCF ≈ $200M after heavy one‑off GPU/DC spend adjustments (conservative).
Growth profile (5‑yr): FY2027 +40%, FY2028 +30%, FY2029 +20%, FY2030 +12% (decelerating to terminal). These reflect aggressive commercialization of contracted capacity but remain conservative vs market optimism; alternative high‑growth scenario shown below.
EBITDA margin expansion to 25% by FY2028 (from current ttm ~33.7% implied by EBITDA/Revenue but recognizing gross/net distortions — model uses progressive margin improvement).
WACC base: 9.0%; terminal growth g: 2.5%.
Updated DCF (concise results)
Projected unlevered FCF (illustrative)
FY2026 (base): $200M
FY2027: $280M (+40%)
FY2028: $364M (+30%)
FY2029: $437M (+20%)
FY2030: $489M (+12%)
Terminal value = FCF2030(1+g)/(WACC−g) = 489*(1.025)/(0.09−0.025) ≈ $7.68B
Discounted PV of explicit FCFs (WACC 9%): approx $200/1.09 + 280/1.09^2 + 364/1.09^3 + 437/1.09^4 + 489/1.09^5 ≈ $183 + $236 + $272 + $298 + $318 = $1,307M
PV(Terminal) ≈ 7.68B / 1.09^5 ≈ $4,991M
Enterprise value (EV) ≈ $1,307M + $4,991M = $6,298M
Adjust for net cash (~$64M): Equity value ≈ EV + net cash = $6,298M + $64M = $6,362M
Per‑share fair value = $6,362M / 328.34M ≈ $19.38 per share (conservative baseline)
Sensitivity (concise)
Base: $19.4 (WACC 9%, g 2.5%)
WACC 8% / g 2.5% → fair ≈ $28–30
WACC 10% / g 2.5% → fair ≈ $13–15
Terminal g +0.5% → ~ +10–15% on base value; terminal g −0.5% → ~ −8–10%
Multiples check
Current implied EV/EBITDA = 16.93x (from dataset). Apply this to projected FY2026–FY2028 EBITDA scenarios:
If FY2026 EBITDA (conservative) = Revenue2026 (estimate) * margin. Using revenue base $688.6M and projected growth +40% → Revenue2027 ≈ $964M; but to compare simply: use FY2026 prox EBITDA ≈ $232M (ttm) as baseline.
EV = 232M * 16.93 ≈ $3.93B → Equity = EV + net cash ≈ $3.99B → per share ≈ $12.15 (low)
If market prices IREN with premium growth (apply EV/EBITDA 30x): 232M * 30 = $6.96B → Equity ≈ $7.02B → per share ≈ $21.4
If forward EBITDA (post‑ramp) = $1.2B (aggressive, used in earlier illustrative peer exercise), EV = 1.2B * 18 = $21.6B → Equity ≈ $21.66B → per share ≈ $66.0 (aligns with market upside scenarios).
Interpretation & key takeaways (short)
Conservative DCF produces a fair value materially below current market price (~$19.4 vs market $50.33) — driven by heavy near‑term capex and conservative FCF ramp assumptions.
Multiples/comps can justify significantly higher valuations only if EBITDA scales rapidly (>$1B) and market assigns premium growth multiple (20–30x+ EV/EBITDA).
Net cash position (~$64M) improves liquidity relative to prior assumed net debt, lowering immediate solvency risk — but levered FCF is deeply negative (ttm −$957M), indicating ongoing heavy financing needs unless capex pauses or cash receipts accelerate.
High short interest (15.8% of float) and elevated beta indicate potential for amplified price moves around execution milestones (Sweetwater commissioning, Microsoft billing, NVIDIA deliveries).
Risks & catalysts (bullet)
Catalysts: Sweetwater tranche commission dates and realized billing from Microsoft; NVIDIA B200/B300 delivery & deployment; sequential quarters with positive FCF conversion.
Risks: execution delays, higher than expected CapEx, weaker realized margins, requirement to raise equity (shelf $660M) or debt at unfavorable terms, customer concentration, regulatory/permits delays.
Deliverables attached if you want more detail (I will produce on request)
Full DCF table (year‑by‑year FCF, discount factors, PVs) and sensitivity grid (WACC vs terminal g).
Multiples table: EV/Revenue and EV/EBITDA scenarios with implied per‑share values (low / base / high cases).
Short‑interest & liquidity dashboard and a concise two‑paragraph investment recommendation (Buy/Hold/Sell with rationale and hedges).

Palantir: Air is getting thin NASDAQ:PLTR recently reached our designated red short Target Zone, triggering an active short trade. We have been managing risk proactively, reducing the position by 50% after hitting the initial take-profit level. As a result, our stop-loss is now set at the entry price. As the weekly chart indicates, the stock is primarily in a major corrective phase, identified as wave II in beige. This correction is expected to continue, first pausing in the upper green Target Zone ($117.54–$95.10) before potentially extending down to the lower green Target Zone between $72.58 and $40.66. Alternatively, there is at least a 33% chance that the stock could first post a new high for wave alt.I in beige, above resistance at $207.23.
