NQ on Major Support Target 36,490Nasdaq 100 index is on major support since September. This is the area you want to buy and as it goes up take some profits if you want for a potential check back into support around early 2027 (green path).
There's the alternative scenario (orange path) that we just trend right up to 36,490 resistance and then have a major pullback to the long term trend. This one is less likely, but possible.
Either way if you sell some of your position (like shorter term options) in the middle of the range you're likely to be in a better position than holding the entire time as eventually that lower trend should get hit and that's a lot of time decay to ruin your positions.
Good luck!
AI

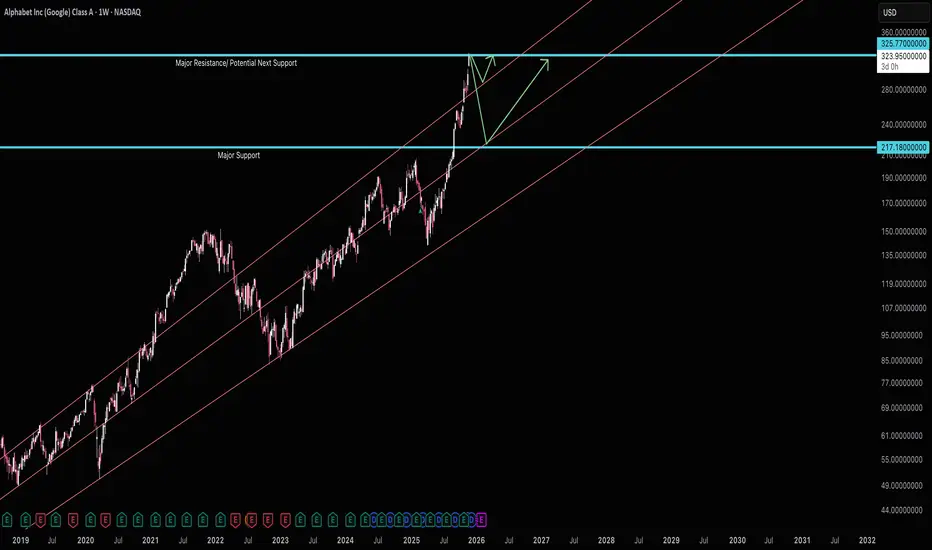
Alphabet Into $325 ResistanceGoogle/Alphabet has ripped through 217 and now at 325. The trouble with a fast move like this is there's heavy money looking for reversion to the mean. We are very far form any long term trend lines and up above the post-covid maximum trend line. Holding onto GOOG/GOOGL is highly risky here.
Major resistances like $217 almost always get checked back into so the risk of $217 is very high. I know google's revenue has been showing signs of accelerating, but not at fast enough rates that make me think it can fully avoid hitting 217.
So short resistance here 325 targeting 217.
Good luck!
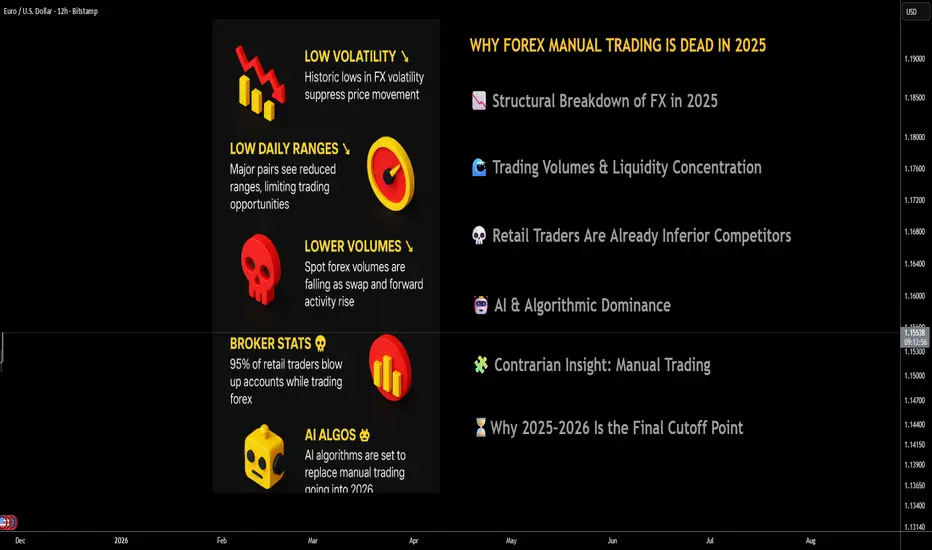
Why Manual Forex Trading Is Officially Dead 📘 Why Manual Forex Trading Is Officially Dead — And AI Will Bury It in 2026
________________________________________
1. 🚨 Executive Summary
Manual FX trading is not merely declining—it is entering its terminal phase. As of 2025, the confluence of record-low volatility, crushed daily ranges, shrinking spot volumes, and hyper-efficient AI execution frameworks has dismantled the edge discretionary traders once possessed.
Regulators report that 74–89% of retail CFD/FX traders lose money, with internal broker statistics showing even higher failure rates—often pushing the informal industry estimate of 90–95% account blow-up rates. The structural market environment now exacerbates those figures: less movement, tighter spreads, and faster AI-driven price formation leave no oxygen for manual decision-making.
The verdict is clear: manual FX trading is no longer a competitive activity—it's an anachronism.
________________________________________
2. 📉 Structural Breakdown of FX in 2025: A Market That No Longer Moves
The fundamental requirement for profitable manual FX trading—price movement—has been suppressed. According to multiple 2023–2024 analyses (Reuters, BIS), FX markets entered a multi-year period of historically subdued volatility, with the CVIX (Currency Volatility Index) sitting near multi-cycle lows.
Major pairs like EUR/USD and USD/JPY are posting 1/3 to 1/2 of their historical daily ranges, compressing intraday opportunity. What used to be 80–120 pip swings are now 30–50 pip oscillations dominated by micro-structure noise rather than directional moves.
In this environment, manual traders have insufficient statistical runway to generate returns, while AI systems can still monetize tiny dislocations at millisecond speed.
________________________________________
3. 🌊 Trading Volumes & Liquidity Concentration: The Game Has Moved On
The 2022 BIS Triennial Survey already documented a shift: spot FX volumes stagnated while swap and forward activity increased, driven by hedging and treasury optimization rather than speculative flows.
By 2025, institutional venues show continued softness in spot volumes, and even the leading eFX platforms reported lower activity during prolonged volatility droughts. This matters because:
• Lower volume = fewer sustained directional trends
• More volume concentrated among algos = fewer exploitable inefficiencies
• Liquidity providers internalize flow before it ever becomes visible to retail charts
Manual trading can’t survive structural liquidity centralization reinforced by machine execution.
________________________________________
4. 💀 Retail Traders Are Already Inferior Competitors and the Data Shows It
Manual traders are not just competing against the market—they are competing against:
• Prime brokers running internal AI risk engines
• HFT firms reading order books at microsecond resolution
• Banks using reinforcement-learning execution algos
ESMA’s regulatory disclosures show 74–89% of retail FX/CFD accounts lose money, but internal broker studies often cite 90–95% destruction rates, especially when volatility is muted.
The brutal truth: manual traders blow up because the game is no longer designed for human reaction speed or intuition.
________________________________________
5. 🤖 AI & Algorithmic Dominance: The 2026 Regime Shift
By 2026, FX will be AI-first, not human-first. Institutional adoption of AI execution is growing double digits annually (per GMI, GrandView), and retail brokers are already rolling out AI-assisted trade generation, AI signal clusters, and AI risk models.
AI advantages include:
• Predictive ability using LSTM/transformers trained on terabytes of tick data
• Zero-latency execution across fragmented liquidity pools
• Ability to profit in low-volatility regimes via microstructure edge
• Adaptive models that rewrite themselves every 24 hours
• No fatigue, no bias, no emotional degradation
In contrast, manual traders operate on slow cognition, subjective pattern recognition, and outdated chart heuristics. This is not a fair fight. Manual trading is no longer a skill—it's an obsolete hobby.
________________________________________
6. 🧩 Contrarian Insight: Manual Trading Isn't Just Dying—It’s Being Engineered Out
Here are non-obvious, high-conviction insights that institutional investors should consider:
(1) Market makers WANT low volatility
Low volatility increases internalization efficiency and reduces hedging costs. Human traders thrive on chaos; AI thrives on order. Who does the system favor?
(2) AI reduces liquidity available to humans
Liquidity is increasingly “dark” inside internal matching engines, meaning price discovery happens before retail traders ever see the candle.
(3) Manual trading can’t survive the “fractionalization” of edge
AI doesn’t need large moves—it monetizes micro-micro-inefficiencies in ways humans never could.
(4) Spread compression kills human R:R ratios
With 0.1–0.3 pip spreads on majors, AI can scalp micro-spreads—humans cannot.
(5) Behavioral inefficiencies have been minimized
Classic manual strategies—breakouts, fib levels, candlestick patterns—worked because humans created predictable behavioral cycles.
Now? AI models detect and arbitrage those behaviors instantly.
The most contrarian conclusion?
Manual trading didn’t die naturally—the market evolved to eliminate it.
________________________________________
7. ⏳Why 2025–2026 Is the Final Cutoff Point
Three forces collide in this window:
1. Volatility compression (structure-driven, not temporary)
2. AI adoption exceeding human adaptability
3. Retail traders facing the worst statistical environment in 15 years
This is the first time in FX history where:
• Human intuition has zero measurable edge
• AI dominance is irreversible
• Market conditions structurally reject manual trading
The past cycles always argued “vol will return.”
In 2025–2026, that is no longer a credible investment thesis.
________________________________________
8. 📈 Implications for Investors & Brokers
Investors should allocate to:
• AI-driven FX funds
• ML-enhanced macro strategies
• Data infrastructure feeding predictive FX models
Brokers should:
• Pivot to AI-based trading tools
• Monetize analytics subscriptions
• Shift away from promoting discretionary trading education
The firms that expect a retail manual trading revival will be structurally misaligned with market evolution.
________________________________________
________________________________________
🔥 Final Conclusion: Manual Traders Will Be Left Behind in 2026
The logic is now overwhelming:
low volatility + low ranges + reduced volumes + AI dominance = endgame for manual FX trading.
Human discretionary trading cannot survive in a marketplace designed for—and increasingly ruled by—data-driven, sub-millisecond, self-learning AI engines.
Manual traders in 2026 will not fight the bots.
They will simply be trading inside a system architected by the bots, reacting slowly to patterns that no longer exist.
The era is over.
The market has moved on.
Uptrend Started After Liberation Day - All Has Broken BelowThe US markets have been described as “on a rally” for quite some time. I would not agree if it is meant to describe the overall US market, but would agree if it refers specifically to AI or tech stocks. Why?
Among the four major US indices, the Russell—representing a much broader base of US-listed companies—continues to struggle to break above its high from last year, even though the others have far surpassed it. In fact, it has since corrected by 9.5% since its all-time high just last month.
After that, the other indices are also following suit only in the past few days, breaking below this uptrend that started in April.
Russell has taken the lead and has broken below this trend in late October.
The earliest clue came from the Russell Index, where many suppliers of the Magnificent 7 companies are also part of Russell 2000 components. When the Russell—or smaller-cap companies—starts to weaken, it often reflects broader market pressures that may eventually spill over to the rest of the indices or vice versa.
Video version on the process of how I monitor the four indices and then narrow it down to the individual index.
Micro E-mini Russell 2000 Index
Ticker: M2K
Minimum fluctuation:
0.10 index points = $0.50
Disclaimer:
• What presented here is not a recommendation, please consult your licensed broker.
• Our mission is to create lateral thinking skills for every investor and trader, knowing when to take a calculated risk with market uncertainty and a bolder risk when opportunity arises.
CME Real-time Market Data help identify trading set-ups in real-time and express my market views. If you have futures in your trading portfolio, you can check out on CME Group data plans available that suit your trading needs www.tradingview.com

HLU - Trio Retest: Where Structure Meets Opportunity!Homeland Uranium TSXV:HLU just secured a long-forgotten 35-million-pound uranium deposit in Colorado, originally discovered in 1979 and abandoned when the nuclear industry collapsed.
With uranium prices up 141% in four years , and global demand expected to jump another 28% by 2030 , Homeland is positioning itself inside a powerful multi-year commodity cycle few investors are watching.
Add AI-driven power demand, national security concerns, and new U.S. policies fast-tracking domestic uranium, and HLU becomes a high-conviction asymmetric energy play.
📊 Technical Analysis
After surging by over 160% , HLU has been in a healthy correction phase, trading within the falling channel marked in red.
However, from a long-term perspective, HLU remains overall bullish, trading within the rising broadening wedge pattern.
The orange circle represents a massive rejection point, the intersection of three confluences, what I call a TRIO RETEST :
- The lower bound of the rising wedge pattern
- The lower bound of the falling channel, acting as an oversold zone
- The structure marked in blue
As HLU approaches the orange zone, we will be looking for trend-following longs.
For the bulls to confirm long-term control and kickstart the next big impulse upward, a break above the falling red channel is needed.
💡 Bigger Picture
Here’s why the fundamentals add fuel to the technical setup:
- A $2.7B uranium prize reclaimed for pennies: Homeland acquired a 35-million-pound U.S. uranium deposit for just $0.15/lb, material now worth nearly $80/lb.
- Trump’s Day-One energy orders: New executive actions prioritize U.S. nuclear power and domestic uranium production. Homeland controls a rare U.S.-based asset right as the policy tide shifts.
- AI is outgrowing the grid: Microsoft, Google, and Oracle are moving toward nuclear due to soaring power needs. Homeland owns the fuel they’ll need.
- National security tailwind: The U.S. imports 98% of its uranium. Russia banned exports. China is hoarding supply. Homeland’s American deposit is uniquely strategic.
📘 Bottom line
HLU is sitting at a key technical zone while the macro, political, and energy narratives align in its favor. If the TRIO retest holds, the next bullish impulse could unfold from a position of both structural and fundamental strength.
📌 Always do your own research and consult your financial advisor before investing.
📚 Stick to your trading plan, entry, risk management, and execution.
All strategies are good, if managed properly.
~ Richard Nasr

TradeCityPro | FET: Will It Bounce at Support or Fall Further?👋 Welcome to TradeCityPro!
In this analysis, I want to review the FET coin , one of the crypto projects related to artificial intelligence, with a $635 million market cap, currently ranked 78th on CoinMarketCap.
⏳ 4-Hour Timeframe
On the 4-hour timeframe, this coin had an upward movement and then entered a correction phase, reaching an important PRZ support zone.
💡 The zone the price is currently testing is a very critical support area, which we had already identified in the chart. Additionally, this zone coincides with the golden Fibonacci zone.
✔️ Given the length of time the price has been correcting, we can confirm a trend change sooner and don’t need to wait for the main support at 0.2036 to be broken.
🔔 Currently, the selling volume is increasing, and the price has reached the lower bound of the box between 0.2638 and 0.3306.
🧮 There’s significant bearish momentum entering the market, and it can be said that the only reason some coins like FET are still holding above their support is Bitcoin’s dominance.
⚖️ If the price stabilizes below its support zone, we will confirm the bearish trend and can open a short position. The next support levels are 0.2340 and 0.2036.
💫 However, if the price rises and moves toward the upper bound of the box, breaking 0.3306, we can become optimistic about the coin’s upward movement again.
📝 Final Thoughts
Stay calm, trade wisely, and let's capture the market's best opportunities!
This analysis reflects our opinions and is not financial advice.
Share your thoughts in the comments, and don’t forget to share this analysis with your friends! ❤️

If I hadn’t second-guessed the forecast, my risk-to-reward 1:5As mentioned before, the y-axis of the AI output is fixed. If the price action goes beyond the forecast image, it simply means the forecast can’t cover the full range. In those cases, we rely on market shape and timing instead.
This is a great reminder to trust in the new era of AI accuracy and really let it guide us!
If I hadn’t second-guessed the forecast, my risk-to-reward (R:R) would have been 1:5 🤩

Looking to long CRWV at $60Previously I was bearish on coreweave, and wow did that cause some strife in the comments, but I've closed my short yesterday and now looking to long $60.
Good luck!

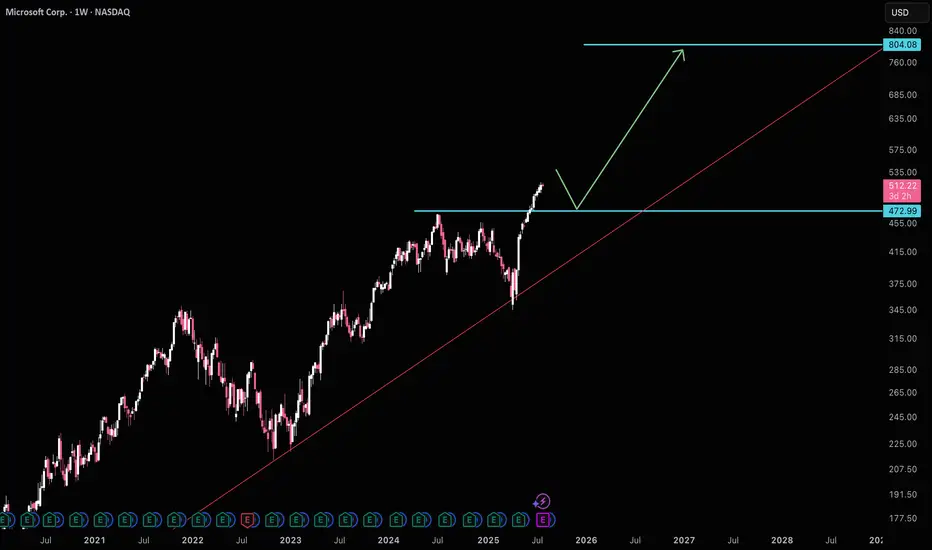
Mircrosoft wants to pullback to $470MSFT is likely to test $470 support before making it's move to $800. Another thing to be weary about is ratio MSFT/AAPL is at historical avg highs, which usually signals a bias towards AAPL. Waiting for $470 is a good idea before getting long again.
Good luck!
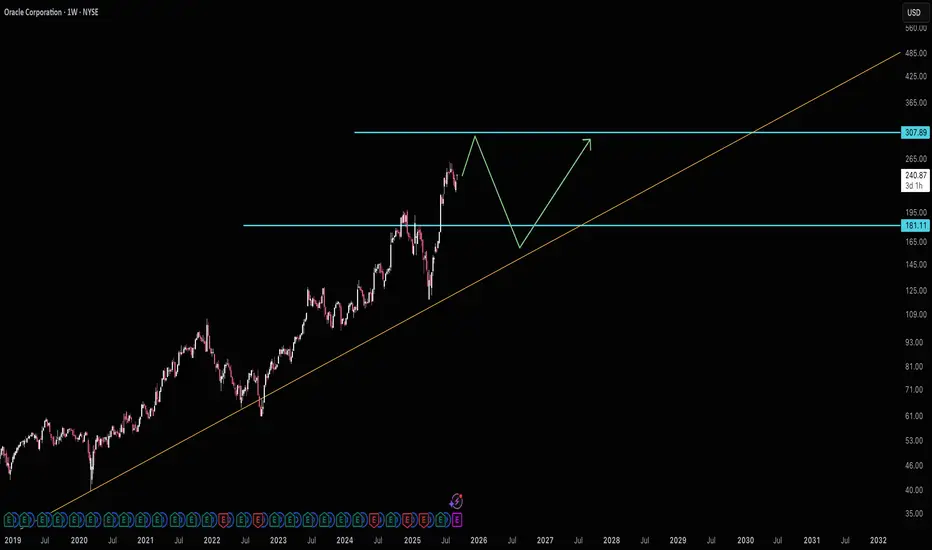
Oracle wants $181Oracle is well off it's long term average and accelerating growth by around 4 years if it hits $307. If it makes it there I would *highly* suggest selling and even potentially a short position. A fair price for ORCL would be $181.
Good luck!
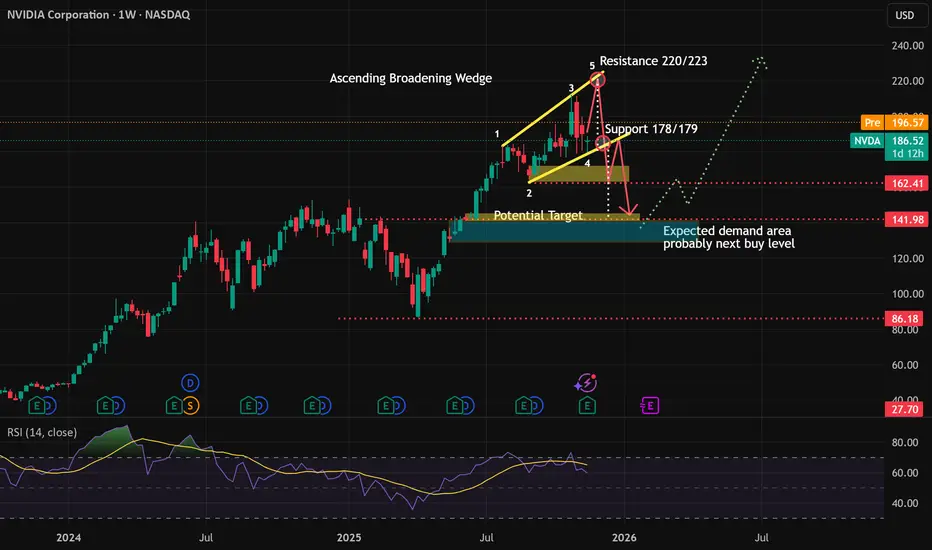
Ascending Broadening Wedge for NVIDIA Weekly ChartThe downtrend probably won't be happen in the near term, but the rebound alson have limited upside. But at least there are 2 possibilities ahead of the price.
I suspect Ascending Broadening Wedge is in process in weekly chart for Nvidia. The concern is the potensial downtrend pressure, especially if support trendline break.
I devide it on 2 scenario :
1. Rebound to 220/223 first. This mean no immediate breakout support anytime soon based on the count. The price will have to raise first with maximum target 220/223 before followed with rejection. But the raise don't have to be exactly 220/223. It can also retest the previous high (3) before rejected and fall.
2. No rebound, support 177/178 immediately broken, the downtren continues to the target area.
There area possibilities to go up first if Santa Claus Rally succeed to push the price above or near resistance, then after the seasonal trade for Santa Claus or January effect will face the profit taking and underpressure through the supportline.
After the pressure, we probably will see some demand on blue area to push the price back on the uptrend..that ofcourse..if no "AI-buble" coming in coming months
DISCLAIMER
Do with your own risk!
This is not suggestion! This is my personal view on the opportunities that could happen to Nvidia.
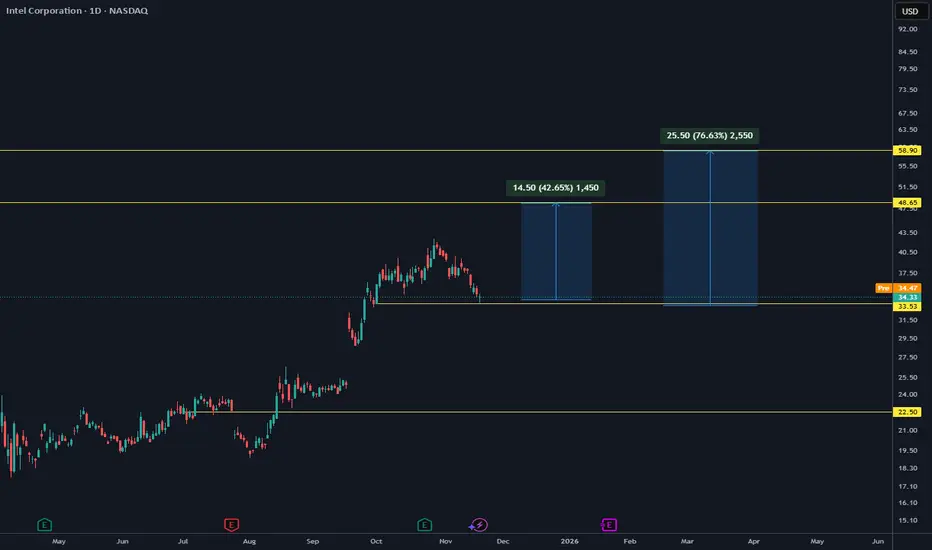
$INTC is set to go to $50I shared this when Intel was sitting at $23 and I am still bullish.
We pulled back to last quarterly opening price which is $34. I wouldnt be surprised if we bounce from here.
Anyway, sentiment is very positive on Intel so good luck.
First $50 then $100 in a long run.
NEAR posed for a break outI'm buying CRYPTOCAP:NEAR here
> At the bottom of the range
> NVIDIA earnings today - if the earnings will be good, AI coins will be the first to pump
> Seeing lots of positive content on the timeline
Rejected 4 times on the resistance, 5th time we break out.

AI-bubble fears dragged USTEC lower.
Alphabet (GOOGL) CEO Sundar Pichai added to the cautious mood, noting that the current AI boom shows signs of irrationality and warning that no company would be immune if the bubble bursts.
Meanwhile, ADP data showed private-sector jobs falling by roughly 2.5k per week over the four weeks to Nov 1, fueling worries about a labor-market slowdown. Fed Governor Waller reiterated his support for a December rate cut, citing ongoing softness and stagnation in the labor market.
This week’s NFP release may shape expectations for further Fed easing and add to market volatility.
USTEC extended its downtrend, breaking below 24525. The diverging bearish EMAs indicate a potential expansion of the bearish structure.
If USTEC breaks below 24300, the index could decline further toward the next support at 24000.
Conversely, if USTEC closes back above 24525, the index may advance toward the next resistance at 25200.

FET - Bulls Preparing for a Comeback?FET has completed a clean correction after its previous strong impulse move, retracing all the way back into the support zone around 0.23–0.28, which has been acting as a key demand area for weeks.
Price bounced from that zone and is now attempting to reclaim structure, signaling that buyers might be preparing to take control again.
For now, the market structure is simple:
Impulse upward ➝ Correction ➝ Potential new impulse.
If the bulls manage to hold above the orange zone and break the descending correction trendline, the next impulsive leg toward 0.50 becomes the most likely scenario.
However, if FET breaks back below 0.23, the bullish setup would fail and deeper downside would be expected.
We are now at the stage where the market decides whether the bulls fully take over… or if this bounce is just a pause before another dip. 🤔
⚠️ Disclaimer: This is not financial advice. Always do your own research and manage risk properly.
📚 Stick to your trading plan regarding entries, risk, and management.
Good luck! 🍀
All Strategies Are Good; If Managed Properly!
~Richard Nasr.

Target aquired! Another beautiful win over hereIn this setup, we identified a strong entry signal, executed perfectly, and captured profit as the predicted move played out. The 30-min interval revealed a high-probability trade. Key levels were respected, and our targets were met with discipline. Stop loss and risk management kept us safe through volatility. Great momentum in BTCUSDT—watch for further setups in upcoming sessions!

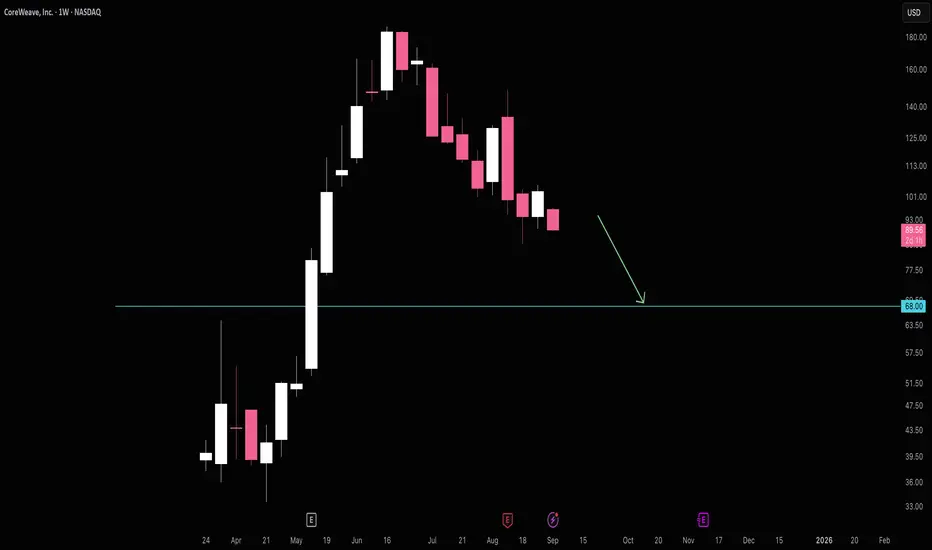
CoreWeave Falling to $68CoreWeave seems to be falling towards $68 support. It's hard to say if $68 will hold, but it's absolutely a good area to close shorts for a potential bounce.
CRWV has yet to form any long term trend lines that I can find. Perhaps this will come from a bounce off $68.
Good luck!
Palantir reversal underway.Here is the #PLTR chart compared to Silver.
We can observe a softness in this ratio.
This has formed a minor head and shoulders pattern, initiating a downward trend.
In the end, I truly believe that the significant inverse head and shoulders breakout is probably going to be tested.
Michael Burry's puts might very well yield substantial returns as a lot of the AI trade experiences a retracement or backing and filling following some massive upward movements.

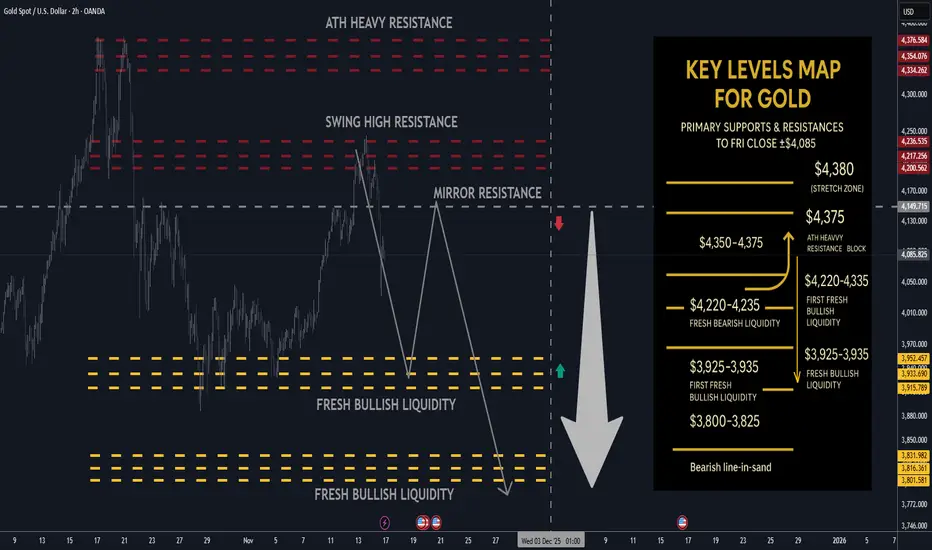
Gold next week: Key S/R Levels and Outlook for Traders🔥 GOLD WEEKLY SNAPSHOT — BY PROJECTSYNDICATE
🏆 High/Close: ~$4,244 → ~$4,085 — buyers punched through $4.20k but sellers defended the $4,220–4,250 band; weekly close is soft but still comfortably above $4k and mid-range.
📈 Trend: Bullish but in corrective / two-way mode ; treating current tape as range-trade while below the $4,350–4,375 ATH supply block.
🛡 Supports: $3,925–3,935 fresh bullish liquidity → $3,800–3,825 deeper demand pocket— key shelves where dip-buying is expected.
🚧 Resistances: $4,220–4,230 short-term fade zone → $4,350–4,375 (ATH heavy resistance block).
🧭 Bias next week: Preference to fade strength into $4,220–4,230, targeting a rotation back into $3,925–3,935. Alternative is to buy dips into $3,925–3,935 and ride the range back toward $4,220–4,230. Invalidation on sustained acceptance above $4,350–4,375; loss of $3,800–3,825 risks deeper mean reversion.
________________________________________
________________________________________
🔝 Key Resistance Zones
• $4,220–4,230 — immediate weekly ceiling; aligns with your noted resistance block, attractive area to initiate shorts on first tests.
• $4,350–4,375 — prior ATH / “heavy resistance block”; any spike here is a fade candidate unless price accepts above it on strong volume.
🛡 Support Zones
• $3,925–3,935 — fresh bullish liquidity; preferred first take-profit for shorts and primary dip-buy zone.
• $3,800–3,825 — deeper fresh liquidity; failure here would signal a more meaningful correction, not just a pullback in an uptrend.
________________________________________
⚖️ Base Case Scenario
Range/consolidation between roughly $3,800–$4,230:
• First pushes into $4,220–4,230 are sellable for rotations toward $3,925–3,935.
• As long as weekly closes keep rejecting the ATH block $4,350–4,375, bias stays “sell strength, buy clean liquidity dips.”
🚀 Breakout / Breakdown Triggers
• Bull trigger: Sustained acceptance above $4,350–4,375 multiple sessions holding above and using that band as support would shift tone back to full-on trend and reopen the path toward and beyond prior extremes (~$4,400+).
• Bear trigger: A decisive daily close below $3,800 turns the current “healthy pullback” into a deeper correction, opening room toward prior lower shelves sub-$3,750 and likely volatility expansion.
________________________________________
💡 Market Drivers to Watch
• Fed & real yields: Odds of a December cut have ramped up again; any hawkish pushback or hotter data could cap rallies near resistance.
• U.S. fiscal/political risk: Shutdown and fiscal brinkmanship are still in the background; resolution headlines could briefly pressure gold, while renewed instability supports the bid.
• Flows & positioning: ETF and central-bank demand remain supportive, but after a 60% YTD run, fast money is quick to take profits into strength.
• Cross-asset behavior: Watch that equity–gold correlation; if risk-off hits and gold still sells with stocks, dips could run further before strategic buyers step in.
________________________________________
🔓 Bull / Bear Trigger Lines
• Bullish above: $4,350–$4,375 (sustained acceptance; ATH block reclaimed as support).
• Bearish below: $3,800 (opens risk of deeper liquidation below the current liquidity shelves).
________________________________________
🧭 Strategy for this week
Primary plan – short from resistance (your core idea):
• Entry zone: Scale into shorts around $4,220–4,230 front edge of the resistance block.
• TP #1: $3,925–3,935 fresh bullish liquidity; consider closing most size here.
• Runner / extension: If momentum extends lower, watch $3,800–3,825 for final profit-taking; below here the profile shifts into deeper correction mode.
• Risk: Hard invalidation if price accepts above $4,350–4,375 daily closes holding above and successful retests.
Alternative plan – buy the dip into liquidity:
• Entry zone: Stagger bids around $3,925–3,935 and, for more aggressive positioning, into $3,800–3,825.
• Exit zone: First target back into $4,220–4,230; consider de-risking heavily as you approach that resistance band.
• Risk: Cut or reduce if price fails to hold above $3,800 on a daily closing basis or if selling accelerates on high volume through that shelf.
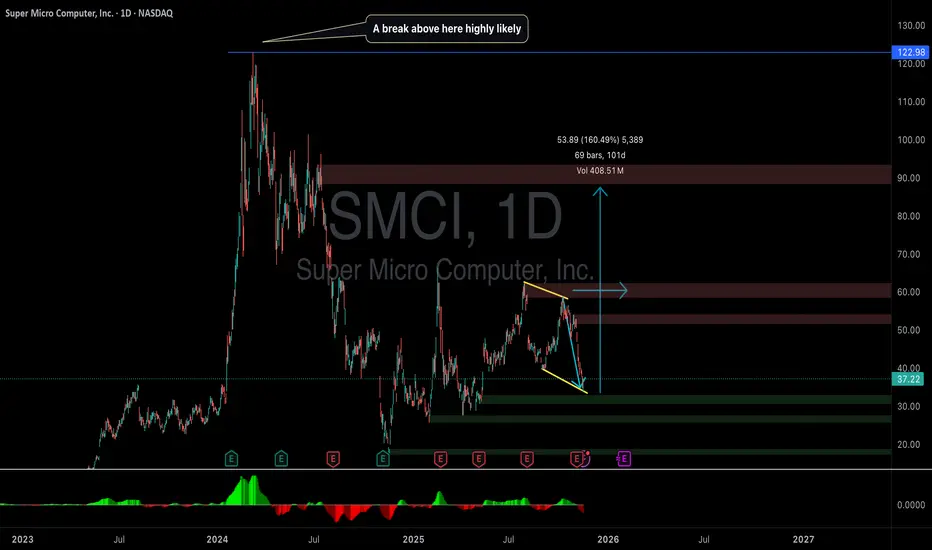
High 80s soon and will it rally towards 200?After a long break its back again with AI, self-driving software and much more. This can go down to high 80s in the near term. I think next year this can hit low 200s. All the best!!
Not a financial advice.

Bullish Case for SMCI: Why the Next Big Move Could Be ExplosiveSuper Micro Computer (SMCI) remains one of the most powerful AI-infrastructure plays in the market, and the bullish setup going into the next quarter looks exceptional.
1. Next Quarter Revenue Forecast: $10B — Up 100% QoQ
Analysts expect SMCI to report $10 billion in revenue next quarter — a 100% jump from the previous quarter.
This kind of acceleration is extremely rare for a company of SMCI’s size.
A triple-digit quarter-over-quarter growth rate signals:
Surging demand for AI servers
Rapid expansion of hyperscaler orders
Strong execution in supply chain and delivery
SMCI taking meaningful market share from Dell, HP, and legacy OEMs
Wall Street absolutely rewards revenue hyper-growth like this.
2. AI Infrastructure Demand Is Exploding
AI training and inference workloads are scaling at a pace never seen before. Every major AI company is racing to expand server capacity, and SMCI has positioned itself as:
Faster than competitors
Cheaper to deploy
Highly customizable
NVIDIA’s preferred partner for next-gen GPU systems
As long as AI accelerators remain the hottest commodity in tech, SMCI remains at the center of that demand.
3. Margins Are Expanding With High-End Configurations
High-performance racks built around H100, H200, B100, and next-gen NVIDIA/AMD GPUs carry much higher margins.
More customers are upgrading to fully-integrated racks rather than low-tier components.
This means earnings could beat expectations, not just revenue.
4. SMCI Is Becoming a Core AI Index Play
Funds that want exposure to AI infrastructure don’t have many pure plays available. SMCI is now viewed as:
A backbone of AI datacenters
A beneficiary of every new GPU cycle
A growth stock with real earnings, not hype
This attracts institutional inflows during AI-sector rotations.
5. Technical Setup Supports a Bullish Breakout
Although volatile, SMCI consistently builds higher lows over time.
With a $10B revenue forecast ahead, sentiment could flip extremely fast.
A strong earnings beat + raised guidance can trigger:
A major gap-up
Short covering
Renewed momentum buying
Bottom Line
SMCI is entering one of the strongest growth phases in its history. With revenue expected to double next quarter, rapidly expanding AI demand, and improving margins, the setup is highly bullish.
If the company delivers anything close to the $10B forecast —
the stock could reprice sharply to the upside.
Carrier: The AI Infrastructure Winner Hiding in Plain SighHey TradingView community!
I see Carrier as a company that can highly benefit from the AI data center expansion, while at the same time not being exposed to the AI potential downside. Why? Because Carrier is an air conditioning and cooling giant that has a strong commercial and residential business no matter whether we are in an AI bubble or not. Also, it's a 100-year company that is not going belly up anytime soon.
THE OPPORTUNITY
Carrier Global is not a pure AI stock, but it is a critical AI infrastructure enabler through its leadership in high-efficiency cooling for data centers and AI-powered building energy management.
Carrier is quietly becoming a picks-and-shovels play in the AI buildout, without the valuation froth of chip or software names.
AI data center cooling demand surging → Carrier’s liquid cooling investments makes it the number one choice.
They help AI scaling with cooling → 650M kWh saved, 437K tons CO₂ reduced.
Commercial HVAC + Service = Recurring Moat → 15–20% organic growth in data center vertical
Viessmann integration on track → Europe heat pump can be huge
Balance sheet deleveraged → Net debt/EBITDA ~2.0x post-divestitures
THE NUMBERS
Current stock price: $55.16
DCF model values CARR at ~$80/share
2.36x Sales, and 42x TTM P/E (P/E is high due to the amortization of their big Viessmann factory in Europe
EV/EBITDA ~16.5x
Dividend yield 1.5%
Among its competitors (Trane, JCI and Vertiv), Carrier has the lowest EV/EBITDA at 16.5x
EBITDA margin 16.5%
TECHNICAL ANALYSIS
The stock is currently sitting at the $55 resistance level, which seems to be a good entry point. RSI shows oversold. Since July this year, the stock has dropped 32%, giving it a good discount.
I see a potential upside of 40% to 50% over the next year, and a maximum drawdown of 25%
My final thought is that the market is pricing Carrier as a cyclical HVAC company. It’s actually a defensive AI infrastructure play with a 100-year brand, recurring revenue, and a seat at the data center table.

Insight Enterprises | NSIT | Long at $92.10Insight Enterprises NASDAQ:NSIT
Technical Analysis
Price entered my "crash" simple moving average zone. Often, but not always, this is an area of algorithmic share accumulation and price reversal. A red flag, however, is that there are still open price gaps on the daily chart down to $50. A green flag is that there are open price gaps up to $215. While the price gaps below will likely get filled in the future, I am betting on a short-term reversal (if not longer-term one) given the prospective growth and its current P/E of 20x (electronic industry currently near 30x).
Insight AI
Stock enters the "crash" zone, and suddenly there is an generative AI announcement to drive revenue and EPS growth: www.businesswire.com . Intentional drive down of stock price for entry? Time will tell.
Revenue and Earnings-per-Share Growth into 2028
Revenue: $8.32 billion in 2025 to $9.88 billion in 2028 (+10.8%)
EPS: $9.64 in 2025 to $12.38 in 2028 (+28.4%)
Health
Debt-to-Equity: 0.9x (pretty good)
Quick Ratio / ability to pay current bills: 1.3 (1.5-3.0 is ideal, but still pretty good)
Alman's Z Score / risk of bankruptcy: 1.8 (3+ is ideal, so moderate risk)
EBIDTA: 5% to 7% range, which is generally considered healthy
Action
Given the "value", AI integration, technical analysis assessment, and growth, NASDAQ:NSIT is in a personal buy zone at $92.10. Caution if the stock dead-cat bounces and aims to drop further into the $50s, but I suspect fundamentals will have to dramatically change in the near-term for that to happen (or the economy crashes)...
Conservative Targets into 2028
$105.00 (+14.0%)
$117.00 (+27.0%)
