Options Blueprint Series [Intermediate]: Lunar Timing and ThetaIntroduction
This edition of the Options Blueprint Series focuses on gold futures and micro gold futures, using an iron condor options structure to explore how time decay (theta) can be positioned in an environment where signals conflict rather than agree.
Gold has been trading at elevated levels, attracting strong participation from momentum-driven traders while simultaneously showing signs of short-term exhaustion. This creates a valuable learning environment for options traders, particularly those interested in non-directional strategies that rely more on time and range behavior than outright price direction.
This article is presented as a case study. All tools, indicators, and trade structures discussed are used for educational purposes only. Lunar timing, in particular, is included as a belief-based analytical lens used by some market participants, not as a predictive mechanism.
Market Context: Gold at Elevated Levels
Gold futures have experienced a powerful rally since the reopening of U.S. Sunday evening trading hours, extending an already strong longer-term uptrend. Price is now operating at new all-time highs, a condition that often amplifies emotional behavior among trend followers.
In such environments, markets frequently display two competing forces:
Continued upside pressure driven by momentum and fear of missing out
Short-term vulnerability driven by overextension, crowding, and mean-reversion dynamics
Rather than attempting to resolve which force will dominate, this Options Blueprint explores how options structures can be used to frame uncertainty itself.
Analytical Inputs Used in This Case Study
This framework combines multiple analytical perspectives. None are presented as definitive signals; instead, they are used to illustrate how diverse inputs can shape options structure selection.
Lunar Timing (Moon Phases Indicator)
The chart highlights waxing and waning moon phases:
Waxing moons are displayed in blue
Waning moons are displayed in gray
The current market condition coincides with a waxing moon phase, which some traders interpret as a potentially bearish timing window. It is important to stress that lunar analysis is belief-based, not empirically causal. Its inclusion here is intentional for educational diversity and contextual layering, not validation.
Bollinger Bands® on Multiple Timeframes
Two Bollinger Bands® sets are applied:
One based on the daily timeframe
One based on the weekly timeframe
Price is approaching, and in some instances penetrating, the upper bands on both timeframes simultaneously. This alignment often signals volatility expansion and late-stage trend behavior, increasing the probability of range stabilization or consolidation, even if the broader trend remains intact.
RSI and Divergence
The Relative Strength Index is set to standard parameters: Length = 14
A bearish divergence is visible, where momentum fails to confirm new price highs. Notably, the
RSI length coincides numerically with half of a lunar cycle. This coincidence is observational only and does not imply a functional relationship.
Structural Support Below Price: UFO Context
Below current price, the chart highlights UFOs (UnFilled Orders) clustered near 4,527. These represent areas where prior price discovery was incomplete, often acting as zones of liquidity and structural interest.
This region introduces an important counterbalance:
While short-term indicators lean bearish
Structural market mechanics suggest potential downside cushioning
This combination reinforces the idea of a bounded market environment, rather than a clean directional thesis.
Why an Iron Condor Fits This Environment
When markets present conflicting directional evidence, strategies that benefit from price containment and time decay become particularly relevant.
An iron condor:
Does not require a bullish or bearish forecast
Defines risk in advance
Benefits from theta as time passes
Allows strike placement around known volatility and structure zones
In this context, the iron condor serves as a framework for uncertainty, not a directional expression.
Iron Condor Structure (Illustrative Example)
This case study uses a January 27 expiration within the GCG contract cycle.
Call Side
Short 4,850 call
Long 4,900 call
Put Side
Short 4,500 put
Long 4,450 put
The strikes are positioned at approximately equal distance from current price, with the downside aligned near known UFO structural support.
Key Characteristics
Net theoretical credit: approximately 10.3 points
Theoretical maximum risk: approximately 39.7 points
Lower break-even: near 4,490
Upper break-even: near 4,860
As long as price remains within this range through expiration, the structure benefits from time decay. If price exits the range, losses are predefined and limited.
Theta: Time as the Primary Variable
In short-option structures, theta becomes the dominant driver of performance when price remains stable.
Key educational takeaways:
Theta accelerates as expiration approaches
Time decay is not linear
Volatility changes can amplify or offset theta
Direction matters less than location and pace
This structure highlights how patience and risk definition often matter more than directional conviction.
Managing an Iron Condor
There are many ways traders manage iron condors as conditions evolve. Without going into procedural detail, common approaches include:
Rolling positions forward in time
Adjusting strikes to rebalance risk
Reducing exposure on one side of the structure
Management decisions depend on price behavior, remaining time, volatility, and individual risk tolerance.
Contract Specifications: GC vs MGC
Gold Futures (GC)
Contract size: 100 troy ounces
Tick size: 0.1
Tick value: $10
Outright margin: $22,900
Micro Gold Futures (MGC)
Contract size: 10 troy ounces
Tick size: 0.1
Tick value: $1
Outright margin: $2,290
Both contracts follow the same structural logic, allowing traders to scale exposure while maintaining identical analytical frameworks.
Margin requirements for futures and futures options are dynamic rather than fixed, meaning they may vary over time in response to changes in market volatility, price levels, and risk conditions as determined by exchanges and clearing firms.
Depending on the broker and clearing arrangements, the specific margin requirement for an iron condor is frequently set near the position’s maximum theoretical risk; in this illustrative case study, that risk is approximately 39.7 points ($397), though margin treatment can vary.
Risk Management Considerations
Even defined-risk strategies carry meaningful risk. Key principles include:
Position sizing relative to account equity
Awareness of gap and volatility risk
Understanding assignment and expiration mechanics
Options limit risk by design, but do not eliminate uncertainty.
Final Thoughts
This Options Blueprint demonstrates how lunar timing, volatility structure, RSI behavior, and UFO context can coexist within a single framework, without requiring directional certainty.
The iron condor is not presented as a solution, but as a lens through which uncertainty can be structured, with time decay acting as the central variable.
Markets rarely offer clarity. Options allow traders to respond to that reality with structure, discipline, and predefined risk.
Data Consideration
When charting futures, the data provided could be delayed. Traders working with the ticker symbols discussed in this idea may prefer to use CME Group real-time data plan on TradingView: www.tradingview.com - This consideration is particularly important for shorter-term traders, whereas it may be less critical for those focused on longer-term trading strategies.
General Disclaimer
The trade ideas presented herein are solely for illustrative purposes forming a part of a case study intended to demonstrate key principles in risk management within the context of the specific market scenarios discussed. These ideas are not to be interpreted as investment recommendations or financial advice. They do not endorse or promote any specific trading strategies, financial products, or services. The information provided is based on data believed to be reliable; however, its accuracy or completeness cannot be guaranteed. Trading in financial markets involves risks, including the potential loss of principal. Each individual should conduct their own research and consult with professional financial advisors before making any investment decisions. The author or publisher of this content bears no responsibility for any actions taken based on the information provided or for any resultant financial or other losses.
Alltimehigh

XOM 1/15/2026 Very good bull activity + options activity. whopping $2.4 million dollars in XOM Calls @ $135 Strike Expiring 4/17/26
the entry is at 0.786 of the Daily Range 2
to avoid manipulation the stop is 2.5x of Daily ATR. Target is at $135.
special thanks for @m_p_d3 and whole crew of StockedUp for the aggregated information about options activity.

Options Blueprint Series [Intermediate]: Breakout With A Buffer1. Market Context: Strength at the Surface, Fragility Underneath
The NASDAQ-100 futures market currently occupies a rare and structurally important zone. Price is trading above a prior all-time high, yet remains below the most recent all-time high, with only a relatively modest distance separating current price from historical extremes.
From a purely technical standpoint, this positioning can be interpreted as constructive. Markets that hold above former highs often retain the potential to transition into renewed expansion and price discovery. However, context matters. This strength exists alongside broader signals of vulnerability across U.S. equity markets—signals that have been explored in prior work and that suggest upside continuation is not guaranteed.
This creates a dual-risk environment:
Upside risk: missing participation if the NASDAQ resumes trending higher.
Downside risk: absorbing full exposure if price fails near historical extremes.
In such conditions, directional certainty is low, but volatility risk is high. This is where outright futures exposure may be less efficient, and where options structures can offer a more robust framework.
2. The Problem With Linear Exposure at Elevated Levels
Holding NASDAQ-100 futures outright implies linear exposure:
Every point higher benefits the position.
Every point lower damages it.
Near historical highs, that symmetry becomes problematic. A trader must be correct not only on direction, but also on timing. Even a structurally bullish thesis can fail if volatility expands or if price retraces before resuming higher.
Linear exposure forces a binary outcome:
Be early and absorb drawdowns.
Be late and miss opportunity.
The goal of this blueprint is to avoid that binary trap by reshaping exposure, not eliminating it.
3. Why Options Are Better Suited for This Environment
Options allow traders to separate direction from risk. Rather than committing capital to a single path, options structures can be designed to:
Define maximum loss in advance
Shift break-even points away from current price
Allow time and volatility to work in favor of the position
Importantly, this blueprint does not rely on forecasting. It assumes uncertainty and builds around it.
The objective is not to predict whether the NASDAQ will break higher or fail lower. The objective is to remain functional across multiple outcomes.
4. Instruments Used: NQ and MNQ Options
This structure applies to:
NASDAQ-100 E-mini futures options (NQ)
NASDAQ-100 Micro E-mini futures options (MNQ)
The logic is identical across both contracts. The difference lies in scale:
NQ offers larger notional exposure and fewer contracts.
MNQ allows finer position sizing, particularly useful when structuring multi-leg options strategies.
Both instruments support the same conceptual framework.
5. Introducing the “Breakout With A Buffer” Concept
The core idea behind this blueprint is simple:
Do not chase price near highs
Do not stand aside entirely
Create a buffer below price while retaining upside access
This is achieved by combining:
A bull put spread placed well below current price
A long call positioned above current price
Together, these components transform uncertainty into a structured payoff.
6. Strategy Construction: Step by Step
The structure consists of three legs:
Short put at approximately 22,000
Long put at approximately 21,000
Long call at approximately 28,750
The bull put spread generates a net credit. That credit is then used to fund the long call.
This matters. Rather than paying outright for upside exposure, the structure monetizes downside stability to finance it.
7. Why a Bull Put Spread and Not a Naked Put
Selling naked puts would introduce undefined downside risk, which contradicts the purpose of this blueprint.
The long put:
Caps downside exposure
Converts the position into a defined-risk structure
Clarifies the maximum loss from the outset
This is not about maximizing credit. It is about controlling tail risk.
8. Strike Selection: Structural, Not Arbitrary
The selected put strikes align with:
The prior all-time high region
A visible concentration of UFOs (UnFilled Orders) acting as structural support
UnFilled Orders represent areas where institutional activity previously absorbed selling pressure. Positioning the put spread near such zones introduces a structural buffer, rather than relying on random distance.
The call strike, by contrast, is intentionally placed far above current price. This avoids overpaying for near-term momentum and instead positions for a regime where price transitions into sustained expansion.
9. Why This Is Not a Collar or a Covered Strategy
It is important to distinguish this blueprint from more common approaches:
Collars require long underlying exposure.
Covered calls cap upside and remain fully exposed to downside.
Outright calls depend heavily on timing and volatility expansion.
This structure does none of those things. It:
Does not require owning futures
Does not cap upside
Does not rely on immediate directional movement
Instead, it converts time and uncertainty into functional components of the trade.
10. Risk Profile: Defined, Asymmetric, Intentional
The resulting payoff has several key characteristics:
Maximum risk is limited to the width of the put spread (approximately 1,000 NASDAQ points), adjusted for net credit.
Break-even is pushed far below current price, near the 22,000 area.
Moderate upside benefits from both time decay on the put spread and directional exposure through the call.
Strong upside allows the long call to dominate the payoff.
This asymmetry is intentional. The structure sacrifices linear gains in exchange for survivability.
11. Scenario Analysis
At the time of constructing this case study, NASDAQ-100 futures trade near 25,900.
Possible outcomes:
Gradual advance: The put spread decays, the call gains sensitivity.
Strong breakout: The call drives returns.
Sideways consolidation: Time decay works in favor of the structure.
Moderate decline: The buffer absorbs volatility.
Deep decline below support: The defined maximum loss is realized.
Every outcome is known in advance. That clarity is the edge.
12. Volatility Considerations
This structure is volatility-aware:
Short puts benefit from volatility contraction.
Long calls benefit from volatility expansion during upside moves.
Rather than betting on volatility direction, the structure balances exposure across regimes.
13. NQ vs MNQ Implementation
For NQ:
Fewer contracts
Larger notional exposure
Greater margin efficiency per leg
For MNQ:
More granular sizing
Easier scaling
Reduced psychological pressure per contract
The strategy logic remains unchanged.
14. Contract Specifications
NQ Tick size: 0.25 points = $5
MNQ Tick size: 0.25 points = $0.50
Options multipliers mirror the futures contracts. Margin requirements vary by broker and volatility regime, currently:
NQ margin requirement = $33,500 per contract
MNQ margin requirement = $3,350 per contract
15. Risk Management Is the Strategy
Defined risk does not remove responsibility. This blueprint requires:
Proper sizing
Acceptance of worst-case outcomes
Discipline in structure selection
Options do not eliminate uncertainty. They make it visible.
16. Key Takeaways
Elevated markets demand adaptive exposure.
Options allow participation without blind commitment.
The Breakout With A Buffer blueprint prioritizes risk clarity first, opportunity second.
This framework is reusable whenever markets hover near historical extremes amid conflicting signals.
Data Consideration
When charting futures, the data provided could be delayed. Traders working with the ticker symbols discussed in this idea may prefer to use CME Group real-time data plan on TradingView: www.tradingview.com - This consideration is particularly important for shorter-term traders, whereas it may be less critical for those focused on longer-term trading strategies.
General Disclaimer
The trade ideas presented herein are solely for illustrative purposes forming a part of a case study intended to demonstrate key principles in risk management within the context of the specific market scenarios discussed. These ideas are not to be interpreted as investment recommendations or financial advice. They do not endorse or promote any specific trading strategies, financial products, or services. The information provided is based on data believed to be reliable; however, its accuracy or completeness cannot be guaranteed. Trading in financial markets involves risks, including the potential loss of principal. Each individual should conduct their own research and consult with professional financial advisors before making any investment decisions. The author or publisher of this content bears no responsibility for any actions taken based on the information provided or for any resultant financial or other losses.

AMAZON - EMA 200: Where Institutions Step InAMZN - CURRENT PRICE : 237.70
📈 AMZN — Institutional Support Holds, Momentum Breakout
AMZN continues to trade in a primary uptrend, with EMA 200 acting as a strong institutional accumulation zone. Multiple pullbacks toward the EMA 200 (highlighted in green) were met with immediate buying interest, confirming long-term demand.
Momentum is now turning bullish:
🔥Price has broken back above the Ichimoku Cloud, signaling trend resumption.
🔥RSI is crossing above the 60 level, a classic sign of bullish momentum acceleration.
This setup favors momentum traders looking to enter as the uptrend resumes.
ENTRY PRICE : 235.00 - 237.80
TARGET : 258.00 (All Time High level)
SUPPORT / INVALIDATION : EMA 200
📌 As long as price holds above EMA 200, the bullish structure remains intact.

FTAI – Momentum & Volume Align for Trend ContinuationFTAI – CURRENT PRICE : 196.85
FTAI remains in a strong bullish trend, supported by recurring momentum and volume behavior. The two vertical green lines highlight previous periods where RSI entered extreme bullish territory above 70, and in both instances, price continued to advance rather than form a top. The same momentum condition is now present again, suggesting RSI strength is acting as trend confirmation, not exhaustion.
Look at the volume pointed by red arrow. On 30 July 2025, there was a gap up with high volume, from there the stock continue rises - indicating strong buying interest. Now same scenario happens (30 DECEMBER 2025 candle) - gap up with strong volume (hint a strong bullish momentum). Take note also that there is a rising support line - indicating demand is getting higher. There is possibility that the stock may trend higher in near term.
ENTRY PRICE : 195.00 - 197.00
FIRST TARGET : 216.00
SECOND TARGET : 226.00
SUPPORT : 176.00

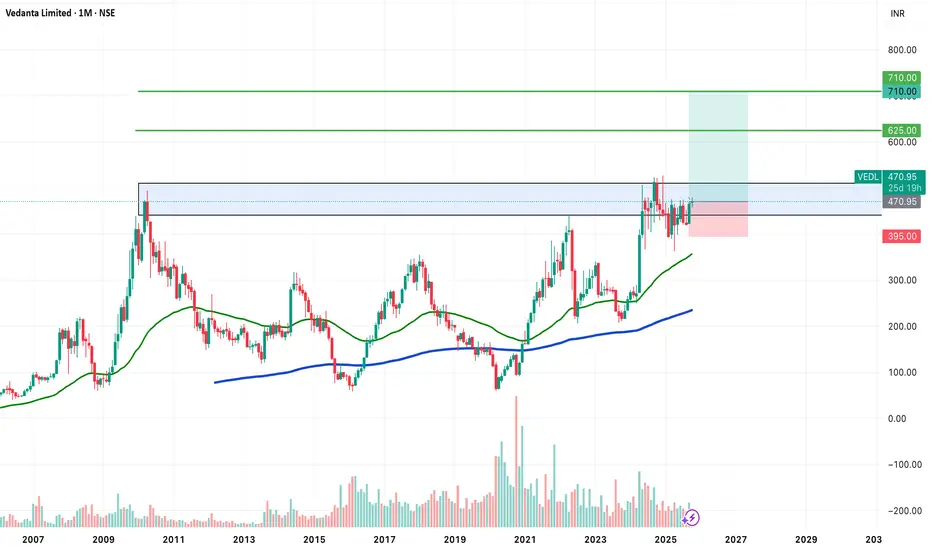
POSITIONAL IDEA - VEDANTA (VEDL)Vedanta Ltd , one of India’s leading diversified natural resources companies, is showing a strong long-term breakout setup supported by powerful technical signals.
Reasons are listed below :
Attempting a multi-year breakout after nearly 14 years of consolidation
Potential VCP (Volatility Contraction Pattern) breakout forming
Bullish engulfing candle on the monthly timeframe
Consolidating near all-time highs, showing strength in price structure
Trading above 50 & 200 EMA on both weekly and monthly charts
Maintaining a clear higher-high, higher-low trend structure
Target - 625 // 710
Stoploss - monthly close below 395
DISCLAIMER -
Decisions to buy, sell, hold or trade in securities, commodities and other investments involve risk and are best made based on the advice of qualified financial professionals. Any trading in securities or other investments involves a risk of substantial losses. The practice of "Day Trading" involves particularly high risks and can cause you to lose substantial sums of money. Before undertaking any trading program, you should consult a qualified financial professional. Please consider carefully whether such trading is suitable for you in light of your financial condition and ability to bear financial risks. Under no circumstances shall we be liable for any loss or damage you or anyone else incurs as a result of any trading or investment activity that you or anyone else engages in based on any information or material you receive through TradingView or our services.
@visionary.growth.insights
When Indexes Stop Agreeing, Markets Start TalkingEver notice how markets can look strong… yet feel a little off?
That’s usually when indexes stop marching in sync — and right now, that’s exactly what’s happening.
Let’s break it down, no jargon overload, no crystal balls.
Four Indexes, Four Different Stories
Here’s the current lineup in US equity index futures:
S&P 500 (ES) → Pushing to fresh all-time highs
Dow Jones (YM) → Also holding above prior highs
NASDAQ 100 (NQ) → Lagging below its peak
Russell 2000 (RTY) → Still stuck under its highs
When all four move together, trends tend to behave.
When they don’t? Markets usually get… interesting.
Why This Disagreement Matters
The NASDAQ is packed with technology and AI-related names — the same group that carried much of the upside through 2025. Its failure to confirm new highs raises an eyebrow.
Meanwhile:
The Dow (YM) is strong, despite being less tech-heavy
Small caps (RTY) aren’t joining the party
Leadership is narrowing, not expanding
That’s not a signal by itself — but it is a clue.
Momentum Is Whispering (Not Shouting)
Momentum indicators aren’t screaming danger, but they are quietly tapping the mic:
NASDAQ shows a bearish divergence
Dow also shows a bearish divergence (yes, even while strong)
Russell goes a step further with a divergence and a momentum crossover
The S&P 500? Still holding up — but increasingly alone.
When momentum fades while price stays elevated, markets often shift from trending to fragile.
The Levels That Actually Matter
Here’s where structure comes in.
Two UFO (UnFilled Orders) support zones sit right below price:
NASDAQ (NQ): ~25,608
Dow (YM): ~48,127
Above these levels, structure is intact.
Below them? That’s when momentum warnings could start turning into price action.
Think of these zones as market tripwires — nothing happens until they’re crossed.
Condition-Based Thinking (No Guessing Required)
Instead of asking “Will the market drop?”, a better question is:
What would need to happen for risk to expand?
A simple framework:
NQ below support + YM below support
Weakest and strongest indexes failing together
Divergences resolving through price, not time
That’s when downside scenarios become more relevant — not before.
Quick Note on Contract Specs & Margin
All four index futures discussed are available in E-mini and Micro E-mini versions, moving tick-for-tick with the same underlying index.
At a glance:
Micro contracts = 1/10 the tick value of E-minis
Typical tick values:
ES / MES: $12.50 vs. $1.25
NQ / MNQ: $5.00 vs. $0.50
YM / MYM: $5.00 vs. $0.50
RTY / M2K: $5.00 vs. $0.50
Margin context (approximate):
ES / MES: $22,500 vs. $2,250
NQ / MNQ: $33,500 vs. $3,350
YM / MYM: $14,250 vs. $1,425
RTY / M2K: $9,500 vs. $950
Same market, same analysis — just different risk granularity. This becomes especially useful when markets are hovering near key structural levels.
The Big Takeaway
Markets don’t usually turn when everyone expects them to.
They turn when participation fades, leadership narrows, and structure starts cracking.
Right now:
Some indexes are strong
Others are lagging
Momentum is diverging
Key levels are close
No conclusions. No assumptions.
Just evidence — and levels worth paying attention to as 2026 approaches.
Want More Depth?
If you’d like to go deeper into the building blocks of trading, check out our From Mystery to Mastery trilogy, three cornerstone articles that complement this one:
🔗 From Mystery to Mastery: Trading Essentials
🔗 From Mystery to Mastery: Futures Explained
🔗 From Mystery to Mastery: Options Explained
When charting futures, the data provided could be delayed. Traders working with the ticker symbols discussed in this idea may prefer to use CME Group real-time data plan on TradingView: www.tradingview.com - This consideration is particularly important for shorter-term traders, whereas it may be less critical for those focused on longer-term trading strategies.
General Disclaimer:
The trade ideas presented herein are solely for illustrative purposes forming a part of a case study intended to demonstrate key principles in risk management within the context of the specific market scenarios discussed. These ideas are not to be interpreted as investment recommendations or financial advice. They do not endorse or promote any specific trading strategies, financial products, or services. The information provided is based on data believed to be reliable; however, its accuracy or completeness cannot be guaranteed. Trading in financial markets involves risks, including the potential loss of principal. Each individual should conduct their own research and consult with professional financial advisors before making any investment decisions. The author or publisher of this content bears no responsibility for any actions taken based on the information provided or for any resultant financial or other losses.

BTC/USD Cycles, downtrends and uptrendsIf we look at the BTC/USD 6 Month Chart. We can see that BTC is still following its 730/731 day cycle. Almost like clockwork. Follow the Sign Wave Pattern up and down, you will see that it's been very accurate. I made the original version of the chart way in Dec 27, 2022, which you can see on the link.
Looking at the history of this chart, we can see that after various major increases and uptrends, BTC has always delivered a roughly ~72% to ~87% retrace roughly lasting Two or Three 6 Month Candles before continuing on to a make a new All Time High.
BTC had been in an uptrend for 3 long years and has very likely peaked for this Cycle. So what do I think will happen?
Shaded White area is where I think BTC will go with either a total
-70% drop to ~$37,931.
or resistance found at either ~$48,384 to ~32,061.
Alternatively:
Dashed Line =
-80% drop to ~$25,148
Dotted White Line =
-87% drop to ~$15,551
If BTC/USD continues to follow the 730/731 day cycle for this downtrend, then we can expect BTC to recover within either the 6 Month Candle that starts Wednesday 1st Jul 2026 or within the 6 Month Candle that starts Friday 1st Jan 2027. After this Downtrend, BTC should make a new All Time High within the 6 Month Candle that starts Sunday 1st July 2029, after that, it’s another year to a year and a half downtrend until the 6 Month Candle that starts Wednesday 1st Jan 2031. And so on, and so on.
I hope this is helpful.

BTC Macro Outlook (Regression, SMA)Long-term price analysis using confluence of Log regression bands, SMA's, and Fibonacci retracements.
Possible case for a test of the 400w SMA, based on % distance to previous all-time highs.

XAUUSD Trade SetupBackground:
- XAUUSD broke all time high at 4375
- zoned around 4378 - 4385
Trade Setup as per the chart.
⚠️ Disclaimer ⚠️This journal entry is for educational and documentation purposes only. It does not constitute financial advice or a recommendation to trade. All trading involves risk, and past performance does not guarantee future results. Always conduct your own analysis and consult with a licensed financial professional before making trading decisions.

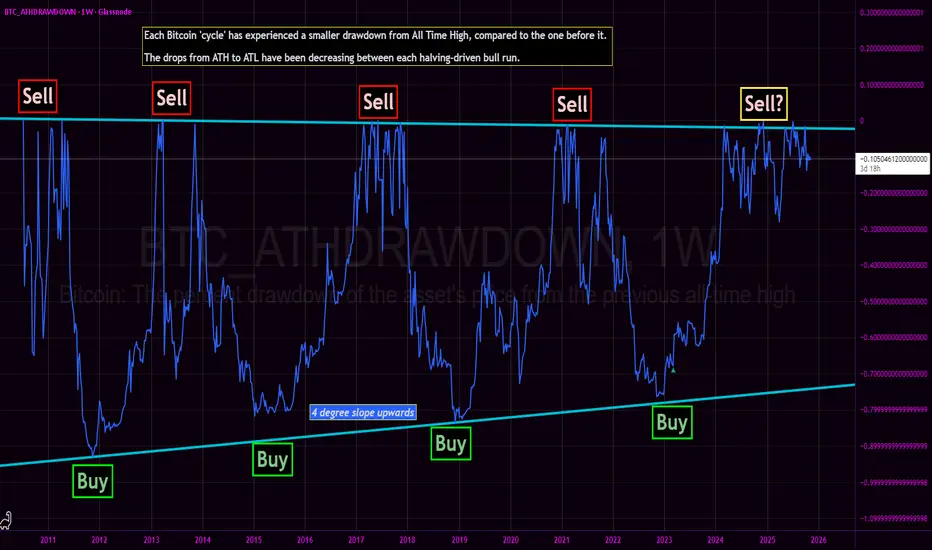
Bitcoin All Time High Drawdown - Bottom nowhere in sight?We revisit the Bitcoin All Time High Drawdown chart originally published in March 2023.
The core thesis of the BTC_ATHDRAWDOWN chart remains intact: each subsequent market cycle has exhibited a diminishing drawdown from its prior All-Time High, with generational cycle bottoms resting squarely on a discernible upward-sloping diagonal support (the 'Buy' line). The 2022-2023 bear market bottomed perfectly on this structural trendline, confirming the '4 degree slope upwards' trend.
Current Cycle Progress: The Sawtooth Fractal
Following the decisive breakthrough of the 2021 All-Time High, price action has entered an unprecedented and structurally complex phase. We are currently witnessing a prolonged high-frequency sawtooth waveform of continuous All-Time Highs.
This action represents the longest sawtooth fractal near ATH of any cycle prior.
This is a stark deviation from the swift, parabolic ascents that characterized previous blow-off tops:
Contrasting the 2017 Pattern: The 2017 bull run culminated in a sharp, almost vertical run-up to $20,000, immediately followed by a steep and rapid crash. That was a classic V-top.
The 2024/2025 Pattern: Instead of a quick V-top, the market is engaged in an extended, messy distribution/consolidation phase right at the very peak. The continuous setting of new, marginal ATHs followed by sharp, shallow pullbacks creates a dense, high-frequency signal in the ATH Drawdown chart.
This structural evolution—a prolonged struggle to hold and marginally exceed previous peaks—suggests that the market is either building a much larger, more resilient base for an extended super-cycle, or undergoing a slow, drawn-out distribution that fundamentally alters the historical BTC cycle cadence.
This is not financial advice, and presented merely as conjectural musing.
MU – Trend Still Intact, EMA50 Bounce SetupMU - CURRENT PRICE : 220.00 - 222.00
Technical Reasons (Bullish Bias)
1️⃣ Price retesting strong dynamic support
Price is holding above the 50-day EMA, which has acted as support throughout the uptrend. Pullback into EMA50 often forms a bullish continuation point.
2️⃣ Price still above the Ichimoku Cloud
Price is trading above the cloud, meaning long-term trend remains bullish. The cloud is thick — showing strong trend support. Latest pullback is testing the top of the cloud, usually a high-probability bounce area.
3️⃣ RSI turning up from mid-zone (not overbought)
RSI is around 50, which is a healthy reset in an uptrend. No overbought conditions → room for upside continuation.
4️⃣ Trend structure remains bullish
Higher highs & higher lows remain intact. Current candle shows buying interest at key support.
5️⃣ Market respects previous breakout area
Price pulled back to retest September–October breakout zone → classic break-and-retest setup.
ENTRY PRICE : 218.00 - 222.00
FIRST TARGET : 236.00
SECOND TARGET 260.00
SUPPORT : 201.00

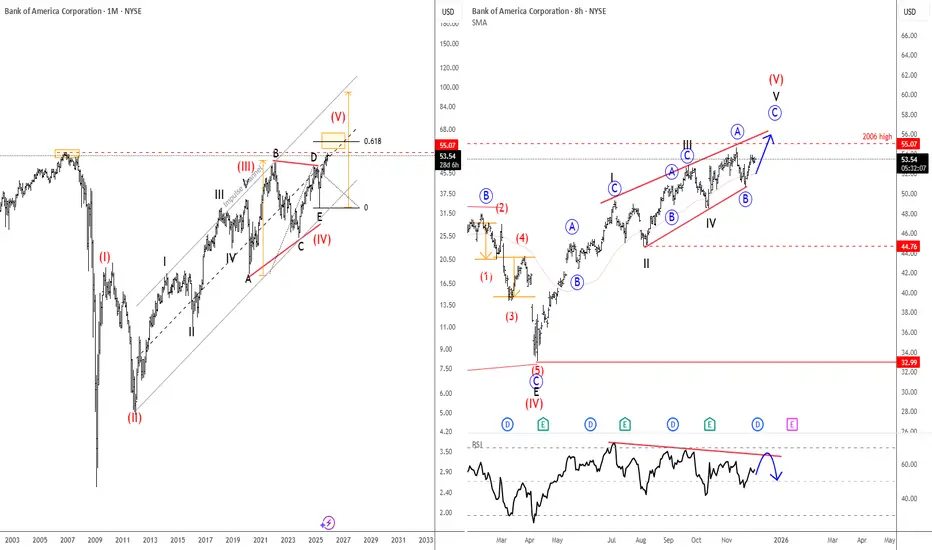
Bank Of America Is Eyeing All-Time Highs From 2006Bank of America is one of the largest banks in the world, serving millions of consumers, businesses, and institutions. It has a broad mix of operations — consumer banking, wealth management, corporate banking, and global markets — which helps keep its earnings stable. The bank has been heavily investing in digital services and technology, aiming to improve efficiency and customer experience. Its size and global reach make it a key player in the U.S. and global financial system.
Bank of America is in an uptrend with a very strong rebound since April 2025, and the price is now approaching the 2006 highs. That area around 55 is extremely important because the current structure looks like an ending diagonal in wave five, meaning we could be in the late stages of a higher-degree bullish cycle. The push up this year also comes out of a very big triangle on the monthly chart, so despite the positive momentum, we should be aware that resistance is getting closer and bullish momentum may slow down. We also see RSI divergence on the daily chart, which is very common when diagonals mature. So while the trend is still up for now, it makes sense to be careful around 55, as a potential reversal in 2026 would not be a surprise.
Highlights:
Trend: Bullish but late-stage (ending diagonal risk)
Resistance: 55-56 area (2006 high)
Invalidation of a bull trend: broken trendline support
Note: Watch RSI divergence and respect the 55/56 zone as potential exhaustion of wave five
PEGA - New 52-Week High, Next Stop All-Time High?PEGA - CURRENT PRICE : 66.27
PEGA has shown strong bullish momentum after breaking above its 52-week high resistance at USD 61.00. The breakout was followed by a successful retest, confirming strong buying interest and trend continuation.
RSI (45) remains steady above the 50 level, indicating a healthy and sustained uptrend with no signs of overbought pressure yet. Take note also that there is a rising support line - indicating demand is getting higher. If momentum continues, the stock has potential to retest its all-time high at around USD 74.40, representing strong upside potential. The stock’s immediate support lies at USD 57.66, aligning with the gap zone (rising window) formed earlier, which is expected to serve as a strong support area.
ENTRY PRICE : 64.00 - 67.00
FIRST TARGET : 74.30 (slightly below actual all time high resistance)
SECOND TARGET : 80.00
SUPPORT : 57.66

SWING IDEA - CHAMBAL FERTILIZERSChambal Fertilizers , a leading manufacturer of fertilizers and agri-products in India, is presenting a compelling swing trade setup with strong technical indicators.
Reasons are listed below :
Break of Cup and Handle Pattern : A classic bullish continuation pattern indicating potential for a significant upside.
Bullish Marubozu Candle : A strong bullish marubozu candle on the weekly timeframe highlights sustained buying pressure.
500 Zone Breakout : The price is attempting to break above the 500 resistance zone after consolidating near its all-time high, signaling strength.
Prolonged Consolidation Breakout : The stock is breaking out of a consolidation phase spanning over 3 years, suggesting a fresh trend initiation.
Target - 675
Stoploss - weekly close below 440
DISCLAIMER -
Decisions to buy, sell, hold or trade in securities, commodities and other investments involve risk and are best made based on the advice of qualified financial professionals. Any trading in securities or other investments involves a risk of substantial losses. The practice of "Day Trading" involves particularly high risks and can cause you to lose substantial sums of money. Before undertaking any trading program, you should consult a qualified financial professional. Please consider carefully whether such trading is suitable for you in light of your financial condition and ability to bear financial risks. Under no circumstances shall we be liable for any loss or damage you or anyone else incurs as a result of any trading or investment activity that you or anyone else engages in based on any information or material you receive through TradingView or our services.
@visionary.growth.insights

SOFI — Bullish Breakout with Strong VolumeSOFI has broken out to a new all-time high with strong volume, signaling strong buying pressure and renewed bullish momentum.
The stock remains in a clear uptrend, trading above the 50-day EMA. Recently, SOFI rebounded perfectly at the EMA 50, confirming it as a strong dynamic support zone. The bullish pennant pattern breakout further strengthens the case for a trend continuation.
The uptrend line is still intact, and as long as the price holds above the EMA 50, the bullish outlook remains valid.
Entry Price : 31.00 - 32.00
Stop Loss: Below EMA 50 (~26.80–26.90)
Targets: 35.00 and 38.00

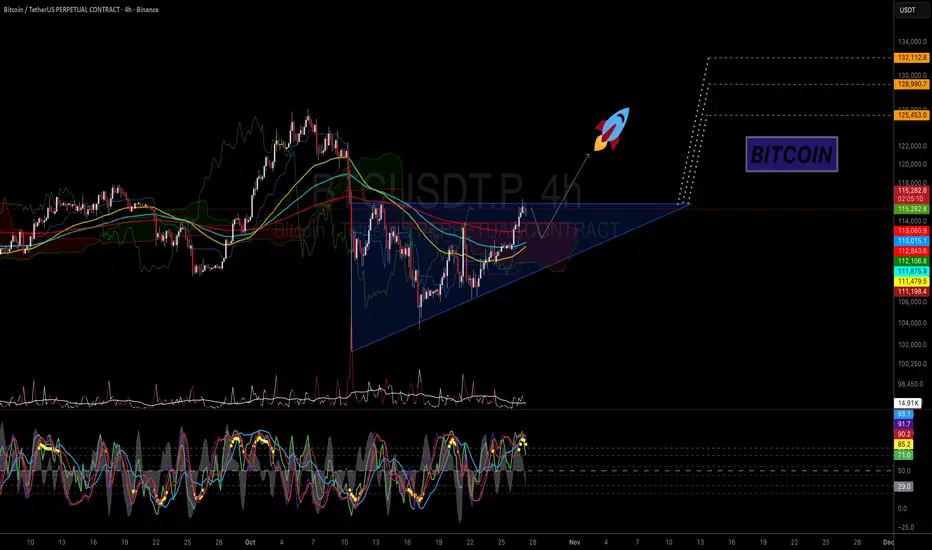
BTC - Ascending Triangle in PlayMorning fellas,
Halloween coming up and trust me, we gonna get that pump and one more leg up to ATH.
Obv you do you, its your money so its up to you the risk you take, but I am riding this like a biker riding a harley over a sunset.
Trade thirsty, my friends!
BTC - Liquidity Dynamics leading to new HighsMarket Context
Bitcoin has shown a constructive reaction from the recent lows, printing a clean double bottom structure that suggests short-term demand entering the market. After a previous buy-side liquidity sweep and rejection, price has rebalanced and is now challenging a fair value gap (FVG) that previously served as resistance. This marks a key decision zone where the next directional move will unfold.
Fair Value Gaps & Structure
The FVG overhead has already acted as resistance, capping the first impulsive move from the lows. Should price retrace slightly to take out the remaining sell-side liquidity below the double bottom before re-engaging higher, it would confirm the area as a springboard for a bullish continuation. A clean reclaim and hold above the FVG zone would signal a shift in order flow favoring buyers.
Liquidity Dynamics
The current setup offers both sides of the market clear liquidity targets: sell-side liquidity resting under the double bottom and buy-side liquidity resting above the prior high. Smart money could engineer a sweep of the lower side first to accumulate before expansion, or alternatively, break directly through resistance to trigger a larger bullish leg.
Final Thoughts
The structure reflects a balanced but bullish-leaning scenario — a classic accumulation and breakout setup. A deeper retest to clear out lower liquidity would strengthen the foundation for continuation, while sustained strength above the FVG opens the door for a reaction toward new highs.
If this analysis aligned with your view, drop a like — do you think we clear the lows first, or head straight for a bullish breakout?

EURCHF: All Time LOW!!Hello Traders,
EURCHF was mostly bearish in recent years, I'm the one who always like to follow trend but his time I believe we should consider Oversold of this European currency pair!

ETH 6K to 8K !? My analysis atm for ETH
Possible to bounce right back to ATH and price discovery mode to 6K hopefully 8K+
What ya all think, drop it bellow ?

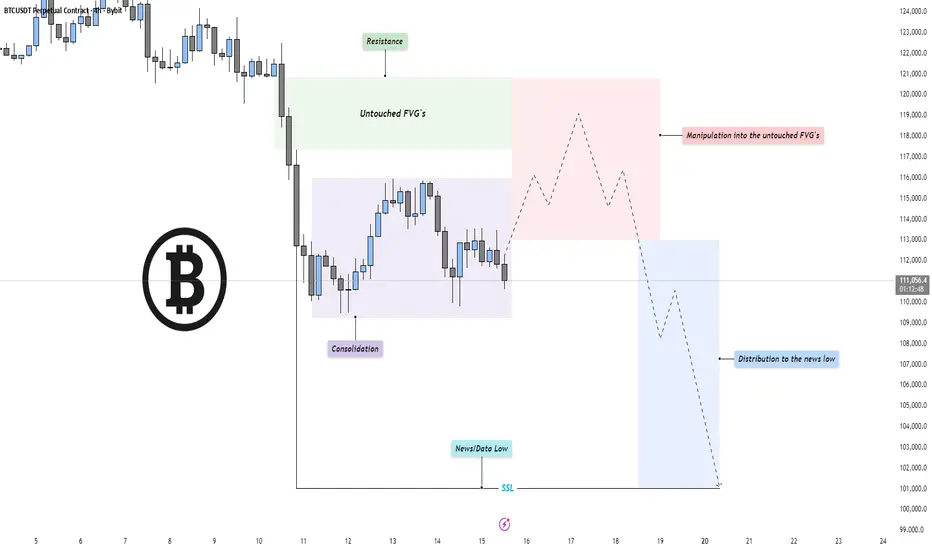
BTC - Perfect Power of 3 setup!Market Context
Bitcoin has entered a phase of compression after an extended bearish leg, with price currently consolidating near recent lows. The previous selloff created a clean structure of inefficiencies and untouched fair value gaps (FVGs) above, now acting as potential magnet zones for short-term retracements. The broader context remains bearish until those imbalances are efficiently mitigated.
Fair Value Gaps & Manipulation Zones
A clear pocket of untouched FVGs sits above the current range, aligning with resistance from prior breakdown points. Price could engineer a manipulation move into this zone, enticing late buyers before resuming the macro bearish direction. Such a move would serve as a liquidity grab and offer premium pricing for distribution before continuation lower.
Liquidity Dynamics
The market structure shows resting sell-side liquidity (SSL) below the recent “news/data low,” marked as a potential target for a deeper sweep. Once manipulation into the upper inefficiencies completes, the market could shift momentum to the downside, distributing into that liquidity and seeking new lows for rebalancing.
Final Thoughts
The current structure points toward a classic bearish continuation setup: consolidation, manipulation into premium inefficiencies, and a drive toward sell-side liquidity. Unless price breaks decisively above the untouched FVG chain, the expectation remains for a redistribution phase leading into the news low or beyond.
If this breakdown helped frame your bias, a like goes a long way — do you think price runs the FVG first, or dives straight into the liquidity below?
Silver has reached the launchpad.Not only did Silver finally hit a new all time high but even more impressive is that it finally closed a candle above the rimline of the 40 year old cup and handle pattern it has been forming since before I was even born. Considering how long it took to accomplish this I can not in good faith let one daily candle close trick me into thinking that it has validated the breakout but this is definitely a giant leap closer to validating an eventual breakout. I get the feeling people are going to be absolutely mindblown by what silver does when the breakout is validated. We are currently on our way to the dotted red trendline’s target but on the way they we should definitely validate the cup and handle breakout hitch will then has us heading to the exponentially higher dotted green lines target at around $722. Buckle up people and prepare for blastoff in the not so distant future. Also be aware that they could have multiple dips back below then back above and below and above the rimline of the cup (horizontal green line) before the actual breakout. Or it could just send a random moonshot candle up to the target as well n the very first try. Best to be prepared for both possibilities. *not financial advice*

EURAUD Reversal Play – Eyes on 1.7860Price has dropped sharply and is now showing signs of a possible reversal from the support base.
Current structure hints that buyers might step in, pushing price toward the Q1 resistance zone around 1.78602.
If momentum continues, we could see a clean breakout move aiming the upper liquidity zone near 1.7905.
However, a break below 1.77483 will invalidate the setup, so I’ll keep my stop below that level.
🎯 Target: 1.78602
🛑 Stop Loss: Below 1.77483
⚡ Bias: Short-term bullish retracement
