TOTAL MARKET CAP – UpdatePrice is still reacting exactly as planned.
My bias remains unchanged.
3.22T remains my primary target
This level aligns with the 50% Daily retracement
Also a key area of previous liquidity + resistance
As long as price trades below this zone, this move still looks like a retracement within a higher-timeframe range, not a confirmed continuation.
Once 3.22T is tapped, I’ll re-evaluate the thesis and start watching for possible short setups, depending on reaction and structure.
No rush. Let price come to you.
What do you expect to happen at 3.22T: clean breakout or rejection?
MrC
Altcoins

ETHEREUM: Crucial Formation, Important Levels to Watch!Hello There,
on the short-term perspective Ethereum is forming crucial bearish pressure which could be decisive within the near future. While Ethereum remains the second largest cryptocurrency, it is recently forming crucial formations that should not be underestimated. In the past weeks, trading actions already showed major selling pressure occurred from whales dropping their ETH on the market. Now, there is an important formation forming, which could be the setup of a determined continuation. Especially when the levels confirm this will likely lead to an exaggerated price move.
When looking at the chart, we can see Ethereum is now trading within this major downtrend channel in which it already formed major bearish pressure. Furthermore, it formed a bearish EMA crossover to the downside, confirming the bearish trend. The several lower lows of the bearish trend mark the significance of this condition. Now, within the past few days, Ethereum set up to form a bear flag formation within the downtrend.
Within this bear flag formation, Ethereum already completed the initial waves A and B of the inner bear flag formation. Now with wave C, Ethereum is likely to move into the upper resistance zones. There is a major resistance zone within the upper boundaries of the channels. Several resistances come together, such as the upper boundary of the descending channel, the upper boundary of the bear flag, and the horizontal resistance line.
With a bounce into this area, which should be expected within the next times, Ethereum is entering a really crucial zone from where a pullback is highly likely. Especially when more and more whales enter the market and short sell, a pullback from this area will be an origin for bearish pressure towards the downside. The whole bear flag formation will be confirmed with a breakout below the lower boundary of the flag formation.
Once this formation has been completed, the targets as seen in my chart will be activated. From there on, a bearish continuation could also be likely if Ethereum does not manage to reverse in this area. In any case, this will be a highly important area to watch out for. Currently, it is important to consider the next phases of development and how Ethereum reacts to the resistance zones. The bearish price pressure should not be underestimated in any case.
With this being said, it is great to consider the important trades upcoming.
We will watch out for the main market evolutions.
Thank you very much for watching!

ETHUSDT: Bullish Push to 3435?As the previous analysis worked exactly as predicted, BINANCE:ETHUSDT is eyeing a bullish breakout on the 4-hour chart , with price rebounding from consolidation after a pullback and breakout candle, forming higher lows that could trigger upside momentum if buyers defend amid recent volatility. This setup suggests a continuation opportunity post-correction, targeting higher levels with near 1:5 risk-reward overall.🔥
Entry between 3090–3100 for a long position (entry from current price with proper risk management is recommended)🎯. Targets at 3255 (first) , 3435 (second) . Set a stop loss at a daily close below 3050 , yielding a risk-reward ratio of near 1:5 overall. Monitor for confirmation via a bullish candle close above entry with rising volume, leveraging Ethereum's resilience post-pullback.🌟
📝 Trade Setup
🎯 Entry (Long):
3090 – 3100
(Entry from current price is valid with proper risk & position sizing.)
🎯 Targets:
• 3255 (first target)
• 3435 (second target)
❌ Stop Loss:
• Daily close below 3050
⚖️ Risk-to-Reward:
• ~1:5 overall
💡 Your view?
Does ETHUSDT continue this breakout toward 3255 → 3435, or do you expect another consolidation before the next leg up? 👇

TOP Altcoins for 2026 ~ ALTSHappy New Year 🥂
Here's a quick glance at my TOP 5 alts of choice for 2026, and why.
💭Injective (INJ)
Fast, interoperable DeFi infrastructure. Active development and a clear use-case in scaling decentralized trading.
💭Illuvium (ILV)
Prioritizes high-quality gameplay and steady development, backed by a solid revenue model.
💭Solana
ETH competitor, SOL is approaching some great buy zones that can have big bounces:
💭Origin Protocol (OGN)
Focuses on tokenized commerce and NFT marketplaces, making it easy for creators and brands to build decentralized storefronts.
💭Audius (AUDIO)
Decentralized music-streaming platform giving artists more control and growing consistently in real-world adoption.
Which alts are you watching for this year?

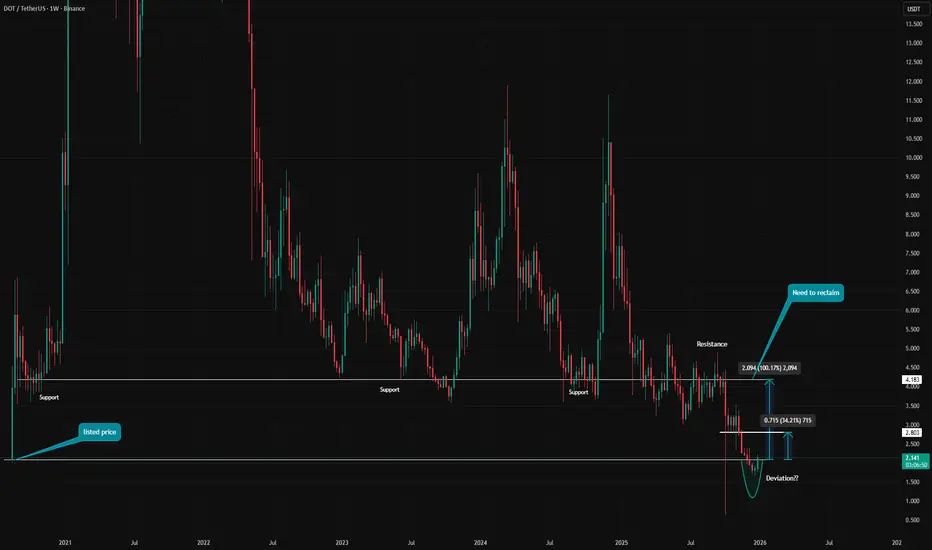
DOT / USDT – Weekly Structure Price is currently reacting around the listed price / origin level
This level has limited historical validation as support and should be treated as a reaction zone, not a confirmed long-term support.
Recent price action shows a strong move below this level followed by a reclaim, suggesting a possible deviation.
However, deviation alone does not confirm a structural shift.
From here, a short-term continuation toward local resistance is possible.
For any meaningful bullish continuation, price needs to reclaim and hold above that resistance.
As long as price remains below resistance, this move should be treated as a reactive bounce within a broader bearish structure, not a confirmed reversal.
This is a key decision area.
Let acceptance and structure confirm the next move.
Do you see this as a deviation reclaim, or just a temporary reaction?
MrC
BONK – Daily UpdateAfter a long downtrend, price finally broke the descending trendline with a strong impulsive move.
This impulsive candle also created a Daily FVG, showing clear imbalance to the upside.
At the moment, price is extended.
I’m not chasing this pump.
My plan is simple:
I’m waiting for a pullback into the 0.5 Fibonacci level, which aligns perfectly with the Daily FVG.
That zone is my area of interest.
If price retraces into that area, I’ll drop to the lower timeframes and wait for a clean long trigger.
No pullback, no confirmation = no trade.
Don’t chase the pump.
Let the price come to you.
Are you waiting for the retrace or already looking for entries?
MrC


ORDI – Daily Zoomed-In UpdatePrice is still trading below a key reclaimed level that previously acted as strong support.
This level is now acting as resistance and needs to be reclaimed for bullish continuation.
Recent price action shows a potential deviation below support, followed by acceptance back into the range.
If this deviation holds, it can act as a spring for a larger move.
Key idea:
No FOMO here.
Bullish continuation only makes sense after a clean reclaim and hold above resistance.
Key levels to watch:
Support: range lows / deviation area
Resistance: prior support level that must be reclaimed
Acceptance above resistance opens the path toward higher range targets.
Failure to reclaim keeps ORDI range-bound and vulnerable to another sweep lower.
Not financial advice. Always manage risk.
👍 Like if you’re still tracking ORDI
💬 Do you expect a clean reclaim or another deviation first?
MrC

bullish structure of alt coins of crypto marketalt coins are still undervalued, perfectly accumulated at base ,
ready to go bullish

CELO at a Key Inflection Point | Price OutlookELO has been consolidating since mid-December after a steep 62% decline from November’s highs.
📅 Thursday’s upcoming event could be the catalyst to break this range.
🔼 Bullish Scenario:
Breakout above $0.1318 could target resistance near $0.1401, within December 15’s bearish weekly void.
Further upside may stall at $0.1438–$0.1463, overlapping multiple voids and October’s swing low.
🔽 Bearish Scenario:
First support sits at $0.1227 (Jan 3 daily void), with confluence from:
$0.1215 (Dec 30 rejection),
$0.1197 (Dec 22 weekly rejection), and
$0.1089 (Jan 1 swing low).
These are key zones where accumulation and stop defense may be active.

ATOM / USDT – Weekly OutlookATOM is still trading in a long-term downtrend, but price is currently resting on a major historical support zone.
Market Structure
Clear sequence of lower highs, confirming bearish structure
Strong support zone that has been defended multiple times in the past
No confirmed trend shift yet
Key Zones
Support: current range where price is consolidating
Resistance: previous support that must be reclaimed and held
Above resistance, upside momentum can accelerate
Scenario
As long as support holds, a relief bounce is possible
Rejection at resistance would confirm trend continuation
Only a clean reclaim and hold above resistance would signal trend reversal
Do you expect ATOM to bounce from support or continue lower?
MrC

ZENUSDT: Bullish Push to 18.4? Over 100% Profit PotentialBINANCE:ZENUSDT is eyeing a massive bullish breakout on the daily chart , with price rebounding from key support after touching the downward trendline, converging with a potential entry zone that could launch explosive upside momentum if buyers overpower resistance amid recent consolidation. This setup hints at a game-changing reversal opportunity post-downtrend, targeting sky-high levels with insane risk-reward exceeding 1:4.5 and over 100% profit potential!🔥
Entry in the 7.5–8.3 range for a long position. Targets at 12.3 (first) , 18.4 (second) . Set a stop loss at a daily close below 6.2 , yielding a risk-reward ratio of more than 1:4.5 . Monitor for confirmation via a bullish candle close above entry with surging volume, leveraging ZEN's volatility for epic gains.🌟
📝 Trade Setup
🎯 Entry (Long):
7.5 – 8.3
(Scaling into this zone is valid with strict risk & capital management.)
🎯 Targets:
• 12.3 (first target)
• 18.4 (second target – macro expansion)
❌ Stop Loss:
• Daily close below 6.2
⚖️ Risk-to-Reward:
• > 1:4.5 Overall
💡 Your view?
Is ZENUSDT gearing up for a true trend reversal and 100%+ rally — or does it need more time to accumulate before the explosion? 👇
🌟If you have any question, don't hesitate to DM me:)

TOTAL3: Altcoins Prepare for $8.6T Market Cap by 2029Based on fractals and fibs, considering common possibilities and eliminating those which were deemed unlikely, TOTAL3 appears primed to extend its run throughout 2028. The waves may not produce pure verticals as it did in the past and instead, we could see years of overlapping, ping-pong action. With a market cap of $8.9T (predicted), this suggests that institutions and larger than retail players may find the risk/reward presented in the altcoin space as desirable. My surfboard is ready.

WHAT IF…... OTHERS/BTC is printing the exact “Alt Season ignition” setup again? 👀
✅ Macro support
✅ Squeeze into downtrend resistance
✅ MACD histogram about to flip GREEN + a bullish crossover brewing
Breakout = ALT SEASON 🚀
Breakdown = TOTAL REKT ☠️

Unlock Fibonacci Retracement: Predict Pullbacks & TargetsFibonacci Retracement is a powerful tool based on mathematical ratios from the Fibonacci sequence. It helps identify potential support/resistance levels during price pullbacks in trends.
Key levels: 23.6%, 38.2%, 50%, 61.8%, 78.6% (and extensions like 161.8%).
Draw from swing high to low (or low to high) – perfect for spotting entries in Forex, Crypto, and Stocks.
How Fibonacci Works (Quick Setup)
On TradingView: Use the Fib Retracement tool. Select recent high/low points. Levels auto-plot where price might bounce or reverse.
Key Strategies
1- Pullback Entries
Buy at 38.2% or 61.8% in uptrends; sell in downtrends.
2- Target Projections
Use extensions (100%, 161.8%) for take-profits beyond the swing.
3-Confluences
Combine with S&R, RSI, or MAs for stronger signals.
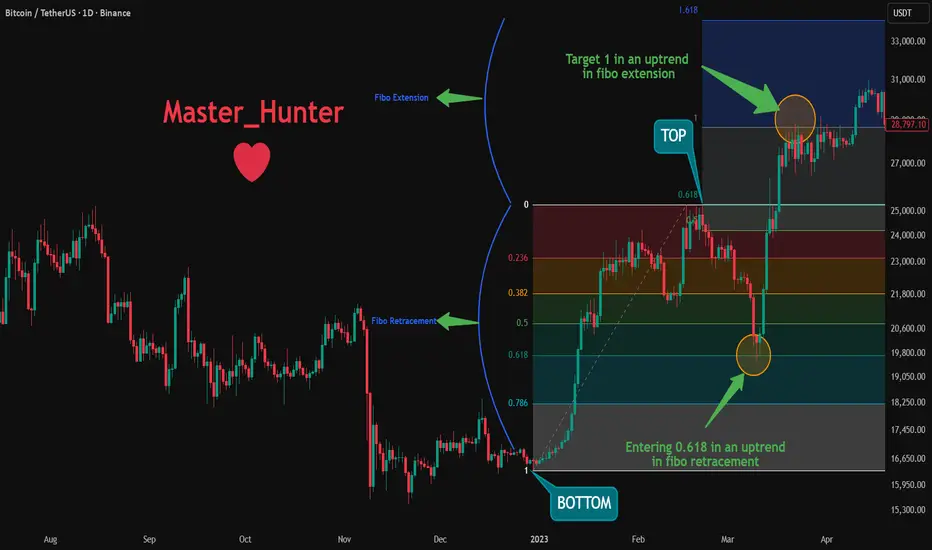
Real Examples Right Now (Jan 3, 2026)
Bitcoin BINANCE:BTCUSDT :
Between 30 Dec 2022 and 20 Feb 2023 We saw a pullback from top to the 0.618 Fibonacci level.
We also saw a hit to the 1st Fibonacci Extension level as a target on March 22, 2023.
Pro Tips
Use in trending markets; avoid choppy ranges.
Adjust for volatility: Shorter swings in Crypto, longer in Stocks.
Confirm with volume – strong moves break Fib levels.
Backtest on historical charts to master it!
Add Fib to your toolkit today and nail those pullbacks!
What's your best Fib win? Share in the comments! 👇
#MANTA [RR: 1/5] Price reversal and new growth BINANCE:MANTAUSDT
There is a 5-wave cycle with an elongated 3rd wave and a corrective (protracted) 4th wave.
At the moment, the asset has completed the movement of wave 5 and has shown signs of a reversal in the long direction at the 1.618 extension level.
If we look at W1, we see that the volume nodes (HVN) coincide with the 0.618 Fibonacci retracement level. This adds weight to the argument that the asset has just completed wave 5.
I am considering a move to HVN (0.12), which gives a risk/reward ratio of 1/5.
I do not rule out manipulative movements.

RENDER / USDT – Trade ideaPrice is still trading inside a range after a strong sell-off.
Market shows indecision, but structure is holding for now.
This trade is already active, based on confluence with the Total Market Cap analysis.
Market conditions align with a potential relief move, as long as structure holds.
Technical View
* Price is reacting around a key support zone
* Multiple rejections from range lows
* Break above range highs could confirm continuation
* Loss of support would invalidate the setup
Do you expect continuation from this range or a breakdown first?
MrC

Zcash Breakout Long IdeaIf you're like me, you missed the "privacy coin" meta narrative that sent Zooko's Zcash CRYPTOCAP:ZEC (and to a lesser extent, monero CRYPTOCAP:XMR ) soaring to prices NOBODY had on their bingo cards.
I haven't traded either of these dino coins since 2019 and 2020, respectively, but here we are. I actually love the renewed interest in privacy because it's true to crypto's cypherpunk origins and fights back against increasing surveillance.
But if you didn't ape Zcash early, like me, you got woefully sidelined, waiting for THIS MOMENT, a better entry point (potentially).
ZEC has retraced and printed a nice double-bottom pattern and now a potential cup & handle beneath a key S/R level. I think this long gets a lot less risky if you wait for a break above resistance + confirmation of S/R flip around that $443 level. Of course, you might get front run and it could just take off, so don't get too cute with it.
While ZEC fully decoupled from the rest of the crypto market during it's epic rally, this trade is probably at least somewhat dependent on BTC's cooperation and continued rally as bulls fight to defend 90k and push higher. IF instead we see a continuation of the downtrend, I think the odds of Zcash rallying are significantly lower.
Potential target levels: $528, $572, $644 and I would keep a tight SL given the shaky market conditions.
happy trades,
CD

PENDLE – Weekly Structure Higher timeframe structure remains bearish
Price continues to trade below a key resistance after a clear rejection
Previous support has flipped into resistance
→ R/S flip is holding, keeping downside pressure intact
Recent downside move fully filled the lower wick
This indicates liquidity has been taken and short-term relief is possible
On the lower timeframe, a Market Structure Shift (MSS) has formed
→ This suggests a potential corrective move
As long as price remains below HTF resistance, any bounce should be treated as reactive
Bullish continuation only becomes valid after a reclaim and hold
Level-to-level market
Wait for confirmation, not anticipation
Do you expect a corrective bounce or continuation to new lows from here?
Should I break this down on the lower timeframe?
MrC

ADA/Crypto Heavy longCardano aswell as many other cryptos have had a very rough 2025
Just for a second, forget about the cycle ideology, forget the fear and FUD, forget monetary policy, and put on a logical lens.
Crypto has expanded immensely the past five years, with banks and institutions investing heavily allowing access to exposure in the crypto markets for clients.
The pricing of these assets the past few years have been very hard, because on one side you have a crazed, fanatical user like the average crypto leverage trader
And on the other side you've had the new but experienced and decisive TradFi people moving into the space, whom are not only a larger driver in terms of capital, but also in understanding of how to manoeuvre markets properly.
To me, this seems like a prime opportunity to go in heavy and not to continue risk-off sentiment.
I've certainly been surprised myself just how deep this has gone, but it has gotten to a point where I couldn't be more certain we'll have a wild few years ahead of us.
In my view, if we're ever to experience a real dotcom type move, it would have to be the phase up next.
Moving retail into maximum greed over the next few years will be a piece of cake for TradFi, now that they are in a position of power, and crypto is largely still disregarded with the majority of people outside of the space, meaning there is a massive potential for expansion.
The specific timing will be impossible, but i believe we are at the very bottom, and that most of the well-established cryptos will reach ATH's in 2026
I hear of people calling ADA a dead coin, and you know what, maybe it is relatively, and maybe it will eventually die out, but it will NOT be this time around, there is simply far too much interest, you just have not seen it reflected in the price (yet)
Steel your resolve and make a leap. BINANCE:ADAUSDT BINANCE:ADABTC

Happy New Year XRP: These Events Set Up Major Moves for 2026.Hello There,
welcome to my new analysis about XRP. In recent times a very important dynamic with XRP caught my attention. Throughout 2025, major events happened that are setting up an important foundation for XRP and the upcoming year. These events are building major cornerstones that will have an enormous effect on the price action. From a fundamental and technical perspective, XRP is about to write an epic future.
When looking at my chart, you can watch this gigantic uptrend channel in which XRP has already several times bounced within the bullish accumulation zone marked in green. This zone was also the origin of XRP shooting to the moon in October 2024, marking the all-time high of $3.66. This major breakout was already part of the completion of this gigantic bullish triangle formation. Such a formation already completed once for XRP, being the origin of the historical upthrust.
While the MA structure is holding this whole trend to the upside, there are also key fundamental signs that reveal an underlying bullishness for XRP. One of them is that XRP just ended its year-long battle against the SEC. This makes way for a financial framework that does not ignore the positive prospects cryptocurrencies like XRP bring to the monetary market. The winning of this case makes XRP much more attractive for further investments and volume into the market.
Also, the launch of the XRP ETF on the 18th of September 2025 at CME has pumped massive volume into the market. In some minutes, millions and millions of dollars were pumped into the XRP network. The key element of an ETF, which makes XRP a much better investment for institutions, is a major milestone. Such an ETF event could be the beginning of historical price moves never seen before, similarly to what has been seen with other cryptocurrencies.
Technically speaking, XRP is now just about to confirm this gigantic triangle formation. An important factor here is the bounce from the upper boundary of the triangle. As seen in my chart, such a price move is supported by the moving averages, the lower boundary of the gigantic uptrend channel, and also the lower boundary of the triangle formation. This level is extremely important to hold; however, currently there are no signs of invalidation.
It will be an interesting journey ahead. And it will be particularly important to consider how XRP reacts to the main zones of support. In any case, it will be compelling to watch how these major levels will be approached.
Thank you very much for watching.

29/12/25 Weekly OutlookLast weeks high: $90,597.02
Last weeks low: $86,423.04
Midpoint: $88,510.03
As 2025 draws to a close, BTC is currently -6% from yearly open ($93,300). Can the yearly candle be flipped green?
Last weeks price action was very much more of the same as the previous few weeks. Clearly defined range with overlapping candles from start to end. That has been the story for the entirety of December and I expect the same for this week also.
The struggle is still liquidity based and until that changes this chart pattern will persist. At this stage in the year a lot of Banks and Institutions are window dressing for the end of the year so this is just a waiting game until the new year now in my opinion.
Broadly speaking altcoins are the same, BTC.D is relatively flat so the across the entire crypto market the trend is flat with a few outliers.
For me the bullish target should be to flip the yearly open $93,300 with acceptance. For the bears a breakdown below $84,000 opens the door to a further drawdown into the $74,500 level.

HYPE – Weekly Structure Price got rejected from a major weekly resistance
Clear distribution at the highs → structure shifted bearish
Previous support has flipped into resistance (R/S flip)
As long as price stays below this level, downside pressure remains valid
Price is currently consolidating above a local support zone
This area is critical for short-term direction
If support fails on a weekly close, continuation to the downside becomes likely
Bullish scenario only activates if price reclaims resistance and holds
Level-to-level market
No prediction — wait for confirmation. Monitor on the LTF
What’s your bias from here: support hold or further continuation?
MrC
